SlideShare a Scribd company logo
1 of 7
Problem Statement:
Color Concentrate usage is above the
standard on 500 - 700 ton injection molded
parts, resulting in a raw material variance.
Project Definition
CTC:
Accurate use of concentrate.
CTQ:
Maintain accurate color match and plastic
stability.
Defect Definition:
Concentrate usage that is not within the
standard of 1.85%-2.15%.
Project Objective:
Develop a process to accurately measure 2%
concentrate into the molding process, by
May 1, 2001.
Benefits:
•Annual cost save of $292,184.
•Consistent color match.
•Part Stability.
Define
DPMO, Short Term Sigma and RTY:
Baseline 1,000,000 -3.00 0.0%
Goal 200,000 2.34 80.0%
Current 43,875 4.17 90.0%
Baseline Performance Measure
Comments:
•30 Samples Collected By
S.VanMetre During 1 Week
Over 3 Shifts
•Data is long term.
Concentrate Usage Percentage
0.00%
1.00%
2.00%
3.00%
4.00%
5.00%
6.00%
7.00%
8.00%
1 3 5 7 9 11 13 15 17 19 21 23 25 27 29
# of Samples
Percentage
Actual Usage Machine 67
Average Usage #67
Standard Usage
Average of
4% Over
Standard
Measure
2% StandardBaseline
7
6
5
4
3
2
1
0
Boxplots of Old and Standard
Ho:Baseline = 2% Standard
Ha:Baseline ≠ 2% Standard
N Mean StDev SE Mean
Baseline 50 5.710 0.605 0.086
2% Stnd 50 2.12 1.34 0.19
Difference = mu Mach 67 - mu Mach 65
Estimate for difference: 3.593
95% CI for difference: (3.178, 4.007)
T-Test of difference = 0 (vs not =): T-Value = 17.30 P-Value = 0.000 DF = 68
Old Equip. at Standard
is not better due to
standard deviation.
The deviation could
allow the percentage
to be too low.
T - Test #1
Improve
Test for Equal Variance
Test Statistic: 17.599
P-Value : 0.000
Baseline
vs
2% Standard
2 Sample T Test
T - Test #2
Improve
Ho:Baseline = New Equip at 2%
Ha:Baseline ≠ New Equip at 2%
N Mean StDev SE Mean
Old System 50 5.710 0.605 0.086
New System 50 1.8833 0.0855 0.012
Difference = mu Old - mu New
Estimate for difference: 3.8270
95% CI for difference: (3.6535, 4.0005)
T-Test of difference = 0 (vs not =): T-Value = 44.30 P-Value = 0.000 DF = 50
The new blender, dispenses
the concentrate more accurately
than the old system.
The Average amount of
concentrate used per mix, is
improve by nearly 4%.
2 Sample T Test
New at 2%Baseline
7
6
5
4
3
2
1
Boxplots of Old and New
Test for Equal Variance
Test Statistic: 36.364
P-Value : 0.000
Baseline Equip.
vs
New Blender
T - Test #3
2 Sample T Test New vs Mat’l Order Improve
Ho:Conc 2nd = Conc. 1st
Ha:Conc 2nd ≠ Conc. 1st
N Mean StDev SE Mean
Conc 2nd 50 1.8833 0.0855 0.012
Conc 1st 50 1.9377 0.0513 0.0073
Difference = mu Conc 2nd - mu Conc 1st
Estimate for difference: -0.0543
95% CI for difference: (-0.0824, -0.0263)
T-Test of difference = 0 (vs not =): T-Value = -3.85 P-Value = 0.000 DF =
80
Conc 2nd Conc 1st
1.5
1.6
1.7
1.8
1.9
2.0
2.1
Boxplots of Conc 2nd and Conc 1st
2 Sample T Test
Dispensing Concentrate 1st,
has a smaller standard deviation.
The blender will dispense
a more accurate percentage of
concentrate.
Test for Equal Variance
Test Statistic: 5.700
P-Value : 0.019
New Equipment Dispensing
Concentrate 2nd
vs
Concentrate 1st
Improve
Concentrate Usage by Blender
0.00%
1.00%
2.00%
3.00%
4.00%
5.00%
6.00%
7.00%
8.00%
1
3
5
7
9
11
13
15
17
19
21
23
25
27
29
31
33
35
37
39
41
43
45
47
49
Samples
Percentage
Goal
Old System
Concentrate 1st
Current Performance Measure
Old System
Average of
4% Over
Standard
Concentrate
Dispensed
1st.

More Related Content

Viewers also liked

Production management.. ppt
Production management.. pptProduction management.. ppt
Production management.. pptKusum Parmar
 
Production Management Introduction
Production Management IntroductionProduction Management Introduction
Production Management IntroductionDr. Gururaj Phatak
 
Pharmaceutical Marketing Management
Pharmaceutical Marketing ManagementPharmaceutical Marketing Management
Pharmaceutical Marketing ManagementSheraz Pervaiz
 
E Commerce Presentation
E  Commerce  PresentationE  Commerce  Presentation
E Commerce PresentationTylerjd
 
Program evaluation review technique (pert)
Program evaluation review technique (pert)Program evaluation review technique (pert)
Program evaluation review technique (pert)tomeh
 
Six Sigma the best ppt
Six Sigma the best pptSix Sigma the best ppt
Six Sigma the best pptRabia Sgh S
 
Pharmaceutical marketing course
Pharmaceutical marketing coursePharmaceutical marketing course
Pharmaceutical marketing courseMadhukar Tanna
 
Production & operations management
Production & operations managementProduction & operations management
Production & operations managementshart sood
 
Total Quality Management (TQM)
Total Quality Management (TQM)Total Quality Management (TQM)
Total Quality Management (TQM)Mudassar Salman
 
Email Marketing 101: Strategy
Email Marketing 101: StrategyEmail Marketing 101: Strategy
Email Marketing 101: StrategySendGrid
 
Maintenance Management
Maintenance ManagementMaintenance Management
Maintenance ManagementBisina Keshara
 
E commerce
E commerceE commerce
E commerceGBC
 

Viewers also liked (16)

Production management.. ppt
Production management.. pptProduction management.. ppt
Production management.. ppt
 
Production Management Introduction
Production Management IntroductionProduction Management Introduction
Production Management Introduction
 
Maintenance
MaintenanceMaintenance
Maintenance
 
Pharmaceutical Marketing Management
Pharmaceutical Marketing ManagementPharmaceutical Marketing Management
Pharmaceutical Marketing Management
 
E Commerce Presentation
E  Commerce  PresentationE  Commerce  Presentation
E Commerce Presentation
 
Program evaluation review technique (pert)
Program evaluation review technique (pert)Program evaluation review technique (pert)
Program evaluation review technique (pert)
 
Six Sigma the best ppt
Six Sigma the best pptSix Sigma the best ppt
Six Sigma the best ppt
 
Pharmaceutical marketing course
Pharmaceutical marketing coursePharmaceutical marketing course
Pharmaceutical marketing course
 
Production & operations management
Production & operations managementProduction & operations management
Production & operations management
 
Project Management PERT and CPM
Project Management PERT and CPMProject Management PERT and CPM
Project Management PERT and CPM
 
Tqm power point
Tqm power pointTqm power point
Tqm power point
 
Total Quality Management (TQM)
Total Quality Management (TQM)Total Quality Management (TQM)
Total Quality Management (TQM)
 
Email Marketing 101: Strategy
Email Marketing 101: StrategyEmail Marketing 101: Strategy
Email Marketing 101: Strategy
 
Maintenance Management
Maintenance ManagementMaintenance Management
Maintenance Management
 
E commerce
E commerceE commerce
E commerce
 
E commerce
E commerceE commerce
E commerce
 

Similar to Project Example using Six Sigma

The following calendar-year information is taken from the December.docx
The following calendar-year information is taken from the December.docxThe following calendar-year information is taken from the December.docx
The following calendar-year information is taken from the December.docxcherry686017
 
Critical Checks for Pharmaceuticals and Healthcare: Validating Your Data Inte...
Critical Checks for Pharmaceuticals and Healthcare: Validating Your Data Inte...Critical Checks for Pharmaceuticals and Healthcare: Validating Your Data Inte...
Critical Checks for Pharmaceuticals and Healthcare: Validating Your Data Inte...Minitab, LLC
 
Lecture 3 about it governanace and how it works
Lecture 3 about it governanace and how it worksLecture 3 about it governanace and how it works
Lecture 3 about it governanace and how it worksssuser2d7235
 
6Six sigma-in-measurement-systems-evaluating-the-hidden-factory (2)
6Six sigma-in-measurement-systems-evaluating-the-hidden-factory (2)6Six sigma-in-measurement-systems-evaluating-the-hidden-factory (2)
6Six sigma-in-measurement-systems-evaluating-the-hidden-factory (2)Bibhuti Prasad Nanda
 
Six sigma-in-measurement-systems-evaluating-the-hidden-factory (2)
Six sigma-in-measurement-systems-evaluating-the-hidden-factory (2)Six sigma-in-measurement-systems-evaluating-the-hidden-factory (2)
Six sigma-in-measurement-systems-evaluating-the-hidden-factory (2)Bibhuti Prasad Nanda
 
six-sigma-in-measurement-systems-evaluating-the-hidden-factory.ppt
six-sigma-in-measurement-systems-evaluating-the-hidden-factory.pptsix-sigma-in-measurement-systems-evaluating-the-hidden-factory.ppt
six-sigma-in-measurement-systems-evaluating-the-hidden-factory.pptMuniyappanT
 
Pr. 12-6Problem 12-6 represents an incorrect N answer =COUNTIF(A.docx
Pr. 12-6Problem 12-6 represents an incorrect N answer  =COUNTIF(A.docxPr. 12-6Problem 12-6 represents an incorrect N answer  =COUNTIF(A.docx
Pr. 12-6Problem 12-6 represents an incorrect N answer =COUNTIF(A.docxChantellPantoja184
 
Analytical chemistry lecture 3
Analytical chemistry lecture 3Analytical chemistry lecture 3
Analytical chemistry lecture 3Sunita Jobli
 
Auto titrator T70 presentation
Auto titrator T70 presentationAuto titrator T70 presentation
Auto titrator T70 presentationTanzeem Khan
 
Rodebaugh sixsigma[1]
Rodebaugh sixsigma[1]Rodebaugh sixsigma[1]
Rodebaugh sixsigma[1]Jitesh Gaurav
 
6304_Final project
6304_Final project6304_Final project
6304_Final projectJianru Shi
 
Product development of a Direct To Consumer (DTC) Microbiome genomic test
Product development of a Direct To Consumer (DTC) Microbiome genomic testProduct development of a Direct To Consumer (DTC) Microbiome genomic test
Product development of a Direct To Consumer (DTC) Microbiome genomic testkirpren
 
Pipette Calibration Worksheet & Guidelines -M. Asif
Pipette Calibration Worksheet & Guidelines -M. AsifPipette Calibration Worksheet & Guidelines -M. Asif
Pipette Calibration Worksheet & Guidelines -M. AsifRana Muhammad Asif
 
Download-manuals-water quality-technicalpapers-within-labaq-cfindings-2ndround
 Download-manuals-water quality-technicalpapers-within-labaq-cfindings-2ndround Download-manuals-water quality-technicalpapers-within-labaq-cfindings-2ndround
Download-manuals-water quality-technicalpapers-within-labaq-cfindings-2ndroundhydrologywebsite1
 
Method 8260C by Purge and Trap Gas Chromatography Mass Spectrometry using the...
Method 8260C by Purge and Trap Gas Chromatography Mass Spectrometry using the...Method 8260C by Purge and Trap Gas Chromatography Mass Spectrometry using the...
Method 8260C by Purge and Trap Gas Chromatography Mass Spectrometry using the...PerkinElmer, Inc.
 
Sustainable Manufacturing: Optimization of single pass Turning machining oper...
Sustainable Manufacturing: Optimization of single pass Turning machining oper...Sustainable Manufacturing: Optimization of single pass Turning machining oper...
Sustainable Manufacturing: Optimization of single pass Turning machining oper...sajal dixit
 
3.3 Measures of Variation
3.3 Measures of Variation3.3 Measures of Variation
3.3 Measures of Variationmlong24
 

Similar to Project Example using Six Sigma (20)

The following calendar-year information is taken from the December.docx
The following calendar-year information is taken from the December.docxThe following calendar-year information is taken from the December.docx
The following calendar-year information is taken from the December.docx
 
Critical Checks for Pharmaceuticals and Healthcare: Validating Your Data Inte...
Critical Checks for Pharmaceuticals and Healthcare: Validating Your Data Inte...Critical Checks for Pharmaceuticals and Healthcare: Validating Your Data Inte...
Critical Checks for Pharmaceuticals and Healthcare: Validating Your Data Inte...
 
Lecture 3 about it governanace and how it works
Lecture 3 about it governanace and how it worksLecture 3 about it governanace and how it works
Lecture 3 about it governanace and how it works
 
6Six sigma-in-measurement-systems-evaluating-the-hidden-factory (2)
6Six sigma-in-measurement-systems-evaluating-the-hidden-factory (2)6Six sigma-in-measurement-systems-evaluating-the-hidden-factory (2)
6Six sigma-in-measurement-systems-evaluating-the-hidden-factory (2)
 
Six sigma-in-measurement-systems-evaluating-the-hidden-factory (2)
Six sigma-in-measurement-systems-evaluating-the-hidden-factory (2)Six sigma-in-measurement-systems-evaluating-the-hidden-factory (2)
Six sigma-in-measurement-systems-evaluating-the-hidden-factory (2)
 
six-sigma-in-measurement-systems-evaluating-the-hidden-factory.ppt
six-sigma-in-measurement-systems-evaluating-the-hidden-factory.pptsix-sigma-in-measurement-systems-evaluating-the-hidden-factory.ppt
six-sigma-in-measurement-systems-evaluating-the-hidden-factory.ppt
 
Pr. 12-6Problem 12-6 represents an incorrect N answer =COUNTIF(A.docx
Pr. 12-6Problem 12-6 represents an incorrect N answer  =COUNTIF(A.docxPr. 12-6Problem 12-6 represents an incorrect N answer  =COUNTIF(A.docx
Pr. 12-6Problem 12-6 represents an incorrect N answer =COUNTIF(A.docx
 
Analytical chemistry lecture 3
Analytical chemistry lecture 3Analytical chemistry lecture 3
Analytical chemistry lecture 3
 
Auto titrator T70 presentation
Auto titrator T70 presentationAuto titrator T70 presentation
Auto titrator T70 presentation
 
Rodebaugh sixsigma[1]
Rodebaugh sixsigma[1]Rodebaugh sixsigma[1]
Rodebaugh sixsigma[1]
 
6304_Final project
6304_Final project6304_Final project
6304_Final project
 
Chapter07.pdf
Chapter07.pdfChapter07.pdf
Chapter07.pdf
 
Product development of a Direct To Consumer (DTC) Microbiome genomic test
Product development of a Direct To Consumer (DTC) Microbiome genomic testProduct development of a Direct To Consumer (DTC) Microbiome genomic test
Product development of a Direct To Consumer (DTC) Microbiome genomic test
 
Pipette Calibration Worksheet & Guidelines -M. Asif
Pipette Calibration Worksheet & Guidelines -M. AsifPipette Calibration Worksheet & Guidelines -M. Asif
Pipette Calibration Worksheet & Guidelines -M. Asif
 
Download-manuals-water quality-technicalpapers-within-labaq-cfindings-2ndround
 Download-manuals-water quality-technicalpapers-within-labaq-cfindings-2ndround Download-manuals-water quality-technicalpapers-within-labaq-cfindings-2ndround
Download-manuals-water quality-technicalpapers-within-labaq-cfindings-2ndround
 
Method 8260C by Purge and Trap Gas Chromatography Mass Spectrometry using the...
Method 8260C by Purge and Trap Gas Chromatography Mass Spectrometry using the...Method 8260C by Purge and Trap Gas Chromatography Mass Spectrometry using the...
Method 8260C by Purge and Trap Gas Chromatography Mass Spectrometry using the...
 
Sustainable Manufacturing: Optimization of single pass Turning machining oper...
Sustainable Manufacturing: Optimization of single pass Turning machining oper...Sustainable Manufacturing: Optimization of single pass Turning machining oper...
Sustainable Manufacturing: Optimization of single pass Turning machining oper...
 
3.3 Measures of Variation
3.3 Measures of Variation3.3 Measures of Variation
3.3 Measures of Variation
 
Ultem9075
Ultem9075Ultem9075
Ultem9075
 
Ultem9075
Ultem9075Ultem9075
Ultem9075
 

Project Example using Six Sigma

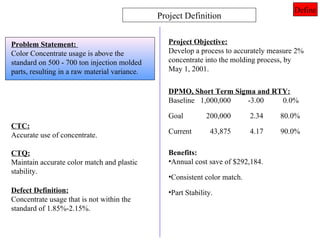
  • 1. Problem Statement: Color Concentrate usage is above the standard on 500 - 700 ton injection molded parts, resulting in a raw material variance. Project Definition CTC: Accurate use of concentrate. CTQ: Maintain accurate color match and plastic stability. Defect Definition: Concentrate usage that is not within the standard of 1.85%-2.15%. Project Objective: Develop a process to accurately measure 2% concentrate into the molding process, by May 1, 2001. Benefits: •Annual cost save of $292,184. •Consistent color match. •Part Stability. Define DPMO, Short Term Sigma and RTY: Baseline 1,000,000 -3.00 0.0% Goal 200,000 2.34 80.0% Current 43,875 4.17 90.0%
  • 2. Baseline Performance Measure Comments: •30 Samples Collected By S.VanMetre During 1 Week Over 3 Shifts •Data is long term. Concentrate Usage Percentage 0.00% 1.00% 2.00% 3.00% 4.00% 5.00% 6.00% 7.00% 8.00% 1 3 5 7 9 11 13 15 17 19 21 23 25 27 29 # of Samples Percentage Actual Usage Machine 67 Average Usage #67 Standard Usage Average of 4% Over Standard Measure
  • 3. 2% StandardBaseline 7 6 5 4 3 2 1 0 Boxplots of Old and Standard Ho:Baseline = 2% Standard Ha:Baseline ≠ 2% Standard N Mean StDev SE Mean Baseline 50 5.710 0.605 0.086 2% Stnd 50 2.12 1.34 0.19 Difference = mu Mach 67 - mu Mach 65 Estimate for difference: 3.593 95% CI for difference: (3.178, 4.007) T-Test of difference = 0 (vs not =): T-Value = 17.30 P-Value = 0.000 DF = 68 Old Equip. at Standard is not better due to standard deviation. The deviation could allow the percentage to be too low. T - Test #1 Improve Test for Equal Variance Test Statistic: 17.599 P-Value : 0.000 Baseline vs 2% Standard 2 Sample T Test
  • 4. T - Test #2 Improve Ho:Baseline = New Equip at 2% Ha:Baseline ≠ New Equip at 2% N Mean StDev SE Mean Old System 50 5.710 0.605 0.086 New System 50 1.8833 0.0855 0.012 Difference = mu Old - mu New Estimate for difference: 3.8270 95% CI for difference: (3.6535, 4.0005) T-Test of difference = 0 (vs not =): T-Value = 44.30 P-Value = 0.000 DF = 50 The new blender, dispenses the concentrate more accurately than the old system. The Average amount of concentrate used per mix, is improve by nearly 4%. 2 Sample T Test New at 2%Baseline 7 6 5 4 3 2 1 Boxplots of Old and New Test for Equal Variance Test Statistic: 36.364 P-Value : 0.000 Baseline Equip. vs New Blender
  • 5. T - Test #3 2 Sample T Test New vs Mat’l Order Improve Ho:Conc 2nd = Conc. 1st Ha:Conc 2nd ≠ Conc. 1st N Mean StDev SE Mean Conc 2nd 50 1.8833 0.0855 0.012 Conc 1st 50 1.9377 0.0513 0.0073 Difference = mu Conc 2nd - mu Conc 1st Estimate for difference: -0.0543 95% CI for difference: (-0.0824, -0.0263) T-Test of difference = 0 (vs not =): T-Value = -3.85 P-Value = 0.000 DF = 80 Conc 2nd Conc 1st 1.5 1.6 1.7 1.8 1.9 2.0 2.1 Boxplots of Conc 2nd and Conc 1st 2 Sample T Test Dispensing Concentrate 1st, has a smaller standard deviation. The blender will dispense a more accurate percentage of concentrate. Test for Equal Variance Test Statistic: 5.700 P-Value : 0.019 New Equipment Dispensing Concentrate 2nd vs Concentrate 1st
  • 6. Improve Concentrate Usage by Blender 0.00% 1.00% 2.00% 3.00% 4.00% 5.00% 6.00% 7.00% 8.00% 1 3 5 7 9 11 13 15 17 19 21 23 25 27 29 31 33 35 37 39 41 43 45 47 49 Samples Percentage Goal Old System Concentrate 1st Current Performance Measure Old System Average of 4% Over Standard Concentrate Dispensed 1st.
  • 7. Improve Concentrate Usage by Blender 0.00% 1.00% 2.00% 3.00% 4.00% 5.00% 6.00% 7.00% 8.00% 1 3 5 7 9 11 13 15 17 19 21 23 25 27 29 31 33 35 37 39 41 43 45 47 49 Samples Percentage Goal Old System Concentrate 1st Current Performance Measure Old System Average of 4% Over Standard Concentrate Dispensed 1st.