SlideShare a Scribd company logo
1 of 10
Download to read offline
This report describes member activity for the association and is not confined to any specific geographic area.
Produced by Florida RealtorsĀ® with data provided by Florida's multiple listing services. Statistics for each month compiled from MLS feeds on the 15th day of the following month.
Data released on Thursday, July 20, 2023. Next data release is Thursday, October 19, 2023.
Year-to-Date 199 -31.8%
-26.2%
141 -14.2%
Closed Sales
104
80 Days
50 -12.0%
117 88.9%
2.7 233.3%
Summary Statistics
Closed Sales
Paid in Cash
90.1%
Q2 2023
$1,525,000
Median Sale Price
Average Sale Price
Dollar Volume
Median Percent of Original
List Price Received
$1,275,000 19.6%
$248.9 Million $334.9 Million -25.7%
$2,393,622 $2,374,987 0.8%
Q2 2022
Percent Change
Year-over-Year
81 118 -31.4%
104 141 -26.2%
97.8% -7.9%
79 Days 20 Days 295.0%
Q2 2023
Median Time to Contract
121 Days
90
Median Time to Sale
New Pending Sales
New Listings
Quarter
121
Pending Inventory 44
Inventory (Active Listings) 221
Months Supply of Inventory 9.0
51.3%
108 -16.7%
Percent Change
Year-over-Year
135
Q2 2020 82
Q3 2021 114
Q2 2021 289
Q2 2022 141
Q1 2022 151
Q4 2021 122
Economists' note : Closed Sales are one of the simplestā€”yet most
importantā€”indicators for the residential real estate market. When
comparing Closed Sales across markets of different sizes, we
recommend comparing the percent changes in sales rather than the
number of sales. Closed Sales (and many other market metrics) are
affected by seasonal cycles, so actual trends are more accurately
represented by year-over-year changes (i.e. comparing a quarter's
sales to the amount of sales in the same quarter in the previous year),
rather than changes from one quarter to the next.
Q1 2023 95 -37.1%
-62.3%
-55.3%
Q4 2022 46
Q3 2022 51
-51.8%
Q1 2021 215
Q4 2020 168
72.0%
60.0%
16.4%
-51.2%
-29.8%
-15.6%
252.4%
-27.4%
Q3 2020
Q1 Q2 Q3 Q4 Q1 Q2 Q3 Q4 Q1 Q2 Q3 Q4 Q1 Q2 Q3 Q4 Q1 Q2
Quarterly Market Detail - Q2 2023
Palm Beach Board of REALTORSĀ®
Townhouses and Condos
Closed Sales
The number of sales transactions which closed during
the quarter
2019 2020 2021 2022
0
50
100
150
200
250
300
350
Closed
Sales
This report describes member activity for the association and is not confined to any specific geographic area.
Produced by Florida RealtorsĀ® with data provided by Florida's multiple listing services. Statistics for each month compiled from MLS feeds on the 15th day of the following month.
Data released on Thursday, July 20, 2023. Next data release is Thursday, October 19, 2023.
Q3 2022
Quarter Cash Sales
Percent Change
Year-over-Year
Q2 2023 81 -31.4%
Q1 2023 82 -32.8%
Q4 2022 35 -63.9%
Year-to-Date 163 -32.1%
175 71.6%
35 -61.5%
Q2 2022 118 -50.4%
Q3 2021 91 -7.1%
Q1 2022 122 -30.3%
Q4 2021 97 -23.6%
Q2 2023 77.9% -6.9%
Q1 2023 86.3% 6.8%
Q4 2022 76.1% -4.3%
Q3 2022 68.6% -14.0%
-7.7%
Q2 2022 83.7% 1.6%
Q1 2022 80.8% -0.7%
Q4 2021 79.5% 5.2%
Q3 2021 79.8% 9.9%
Q2 2021 82.4% 12.6%
Economists' note : This statistic is simply another way of viewing
Cash Sales. The remaining percentages of Closed Sales (i.e. those not
paid fully in cash) each quarter involved some sort of financing, such
as mortgages, owner/seller financing, assumed loans, etc.
Economists' note : Cash Sales can be a useful indicator of the extent
to which investors are participating in the market. Why? Investors
are far more likely to have the funds to purchase a home available up
front, whereas the typical homebuyer requires a mortgage or some
other form of financing. There are, of course, many possible
exceptions, so this statistic should be interpreted with care.
Year-to-Date 81.9% -0.4%
Quarter
Percent of Closed
Sales Paid in Cash
Percent Change
Year-over-Year
Q3 2020 72.6% -1.0%
Q2 2020
Q2 2020 60 -51.2%
Q4 2020
73.2% 1.1%
Q1 2021 81.4%
Q2 2021 238 296.7%
Q1 2021
127 47.7%
Q3 2020 98 15.3%
-0.2%
Q4 2020 75.6%
Q1 Q2 Q3 Q4 Q1 Q2 Q3 Q4 Q1 Q2 Q3 Q4 Q1 Q2 Q3 Q4 Q1 Q2
0%
20%
40%
60%
80%
100%
Pct.
of
Closed
Sales
Paid
in
Cash
0
50
100
150
200
250
Cash
Sales
Quarterly Market Detail - Q2 2023
2019 2020 2021 2022
Palm Beach Board of REALTORSĀ®
Townhouses and Condos
Cash Sales
The number of Closed Sales during the quarter in
which buyers exclusively paid in cash
2019 2020 2021 2022
Cash Sales as a Percentage of Closed Sales
The percentage of Closed Sales during the quarter
which were Cash Sales
This report describes member activity for the association and is not confined to any specific geographic area.
Produced by Florida RealtorsĀ® with data provided by Florida's multiple listing services. Statistics for each month compiled from MLS feeds on the 15th day of the following month.
Data released on Thursday, July 20, 2023. Next data release is Thursday, October 19, 2023.
Quarter Median Sale Price
Percent Change
Year-over-Year
Q2 2023 $1,525,000 19.6%
Year-to-Date $1,400,000 8.0%
Q3 2021 $725,000 -7.3%
Q1 2023 $1,305,000 -1.4%
Q4 2022 $1,145,000 42.2%
Q1 2022 $1,323,000 39.3%
Q4 2021 $805,000 -8.0%
Q3 2022 $998,000 37.7%
Q2 2022 $1,275,000 27.6%
Q2 2021 $999,500 22.1%
Q1 2021 $950,000 19.5%
Q4 2020 $875,000 26.4%
Q3 2020 $782,500 7.6%
Q2 2020 $818,750 23.4%
Quarter Average Sale Price
Percent Change
Year-over-Year
Q2 2023 $2,393,622 0.8%
Q1 2023 $2,511,458 23.0%
Q4 2022 $2,268,867 36.2%
Q3 2022 $1,732,392 21.7%
-29.3%
Q2 2022 $2,374,987 51.6%
Q1 2022 $2,041,792 31.2%
Q4 2021 $1,666,358 5.1%
Q3 2021 $1,423,596 1.6%
Q2 2021 $1,566,302 7.1%
11.2%
$2,449,875
Year-to-Date
Economists' note : Median Sale Price is our preferred summary
statistic for price activity because, unlike Average Sale Price, Median
Sale Price is not sensitive to high sale prices for small numbers of
homes that may not be characteristic of the market area. Keep in
mind that median price trends over time are not always solely caused
by changes in the general value of local real estate. Median sale price
only reflects the values of the homes that sold each quarter, and the
mix of the types of homes that sell can change over time.
Economists' note : Usually, we prefer Median Sale Price over
Average Sale Price as a summary statistic for home prices. However,
Average Sale Price does have its usesā€”particularly when it is
analyzed alongside the Median Sale Price. For one, the relative
difference between the two statistics can provide some insight into
the market for higher-end homes in an area.
Q3 2020 $1,400,570 -40.7%
Q2 2020 $1,462,160 22.3%
Q1 2021 $1,556,520 6.5%
Q4 2020 $1,585,254
Q1 Q2 Q3 Q4 Q1 Q2 Q3 Q4 Q1 Q2 Q3 Q4 Q1 Q2 Q3 Q4 Q1 Q2
$0K
$500K
$1000K
$1500K
$2000K
$2500K
$3000K
Average
Sale
Price
$0K
$500K
$1000K
$1500K
$2000K
Median
Sale
Price
Quarterly Market Detail - Q2 2023
2019 2020 2021 2022
Palm Beach Board of REALTORSĀ®
Townhouses and Condos
Median Sale Price
The median sale price reported for the quarter (i.e.
50% of sales were above and 50% of sales were below)
2019 2020 2021 2022
Average Sale Price
The average sale price reported for the quarter (i.e.
total sales in dollars divided by the number of sales)
This report describes member activity for the association and is not confined to any specific geographic area.
Produced by Florida RealtorsĀ® with data provided by Florida's multiple listing services. Statistics for each month compiled from MLS feeds on the 15th day of the following month.
Data released on Thursday, July 20, 2023. Next data release is Thursday, October 19, 2023.
Quarter Dollar Volume
Percent Change
Year-over-Year
Q2 2023 $248.9 Million -25.7%
Year-to-Date $487.5 Million -24.2%
-14.2%
Q1 2023 $238.6 Million -22.6%
Q4 2022 $104.4 Million -48.7%
$334.7 Million 83.2%
Q3 2022 $88.4 Million -45.6%
Q2 2022 $334.9 Million -26.0%
Q1 2022 $308.3 Million -7.9%
Q4 2021 $203.3 Million -23.7%
Q3 2021 $162.3 Million
Q2 2023 90.1% -7.9%
Q1 2023 91.3% -4.8%
Q4 2022 91.5% -5.3%
Q3 2022 94.7% -1.0%
-1.4%
Q2 2022 97.8% 2.9%
Q1 2022 95.9% 2.2%
Q4 2021 96.6% 5.6%
Q3 2021 95.7% 6.2%
Q2 2021 95.0% 4.9%
Economists' note : The Median Percent of Original List Price
Received is useful as an indicator of market recovery, since it
typically rises as buyers realize that the market may be moving away
from them and they need to match the selling price (or better it) in
order to get a contract on the house. This is usually the last measure
to indicate a market has shifted from down to up, so it is what we
would call a lagging indicator.
Economists' note : Dollar Volume is simply the sum of all sale prices
in a given time period, and can quickly be calculated by multiplying
Closed Sales by Average Sale Price. It is a strong indicator of the
health of the real estate industry in a market, and is of particular
interest to real estate professionals, investors, analysts, and
government agencies. Potential home sellers and home buyers, on
the other hand, will likely be better served by paying attention to
trends in the two components of Dollar Volume (i.e. sales and prices)
individually.
-6.5%
91.0%
Year-to-Date
Quarter
Med. Pct. of Orig.
List Price Received
Percent Change
Year-over-Year
Q3 2020 90.1% -0.9%
Q2 2020
Q2 2020 $119.9 Million -41.0%
Q4 2020
90.6% 1.8%
Q1 2021 93.8%
Q2 2021 $452.7 Million 277.5%
Q1 2021
$266.3 Million 13.0%
Q3 2020 $189.1 Million -31.0%
3.9%
Q4 2020 91.5%
Q1 Q2 Q3 Q4 Q1 Q2 Q3 Q4 Q1 Q2 Q3 Q4 Q1 Q2 Q3 Q4 Q1 Q2
0%
20%
40%
60%
80%
100%
120%
Med.
Pct.
of
Orig.
List
Price
Received
$0
$100 M
$200 M
$300 M
$400 M
$500 M
Dollar
Volume
Quarterly Market Detail - Q2 2023
2019 2020 2021 2022
Palm Beach Board of REALTORSĀ®
Townhouses and Condos
Dollar Volume
The sum of the sale prices for all sales which closed
during the quarter
2019 2020 2021 2022
Median Percent of Original List Price Received
The median of the sale price (as a percentage of the original list
price) across all properties selling during the quarter
This report describes member activity for the association and is not confined to any specific geographic area.
Produced by Florida RealtorsĀ® with data provided by Florida's multiple listing services. Statistics for each month compiled from MLS feeds on the 15th day of the following month.
Data released on Thursday, July 20, 2023. Next data release is Thursday, October 19, 2023.
60 Days 100.0%
Q3 2022 21 Days -63.2%
Q2 2021 70 Days -45.3%
Quarter
Median Time to
Contract
Percent Change
Year-over-Year
Q2 2023 79 Days 295.0%
75 Days 212.5%
Year-to-Date
Q1 2023 74 Days 138.7%
Q4 2022
Q4 2021 30 Days -78.4%
Q3 2021 57 Days -67.6%
Q2 2022 20 Days -71.4%
Q1 2022 31 Days -71.0%
107 Days -8.5%
Q4 2020 139 Days -7.9%
Q1 2021
Q3 2020 176 Days 8.0%
Q2 2020 128 Days 7.6%
Quarter Median Time to Sale
Percent Change
Year-over-Year
Q2 2023 121 Days 51.3%
47.4%
115 Days
Year-to-Date
Q1 2023 113 Days 44.9%
Q4 2022 105 Days 47.9%
-7.7%
Q3 2022 83 Days -26.5%
Q2 2022 80 Days -30.4%
Q1 2022 78 Days -45.5%
Q4 2021 71 Days -56.4%
Q3 2021 113 Days -47.2%
Q2 2020 165 Days 5.1%
Economists' note : Time to Sale is a measure of the length of the
home selling process, calculated as the number of days between the
initial listing of a property and the closing of the sale. Median Time
to Sale is the amount of time the "middle" property selling this month
was on the market. That is, 50% of homes selling this month took
less time to sell, and 50% of homes took more time to sell. Median
Time to Sale gives a more accurate picture than Average Time to Sale,
which can be skewed upward by small numbers of properties taking
an abnormally long time to sell.
Economists' note : Like Time to Sale, Time to Contract is a measure
of the length of the home selling process calculated for sales which
closed during the quarter. The difference is that Time to Contract
measures the number of days between the initial listing of a property
and the signing of the contract which eventually led to the closing of
the sale. When the gap between Median Time to Contract and Median
Time to Sale grows, it is usually a sign of longer closing times and/or
declining numbers of cash sales.
Q4 2020 163 Days -35.3%
Q3 2020 214 Days -7.0%
Q2 2021 115 Days -30.3%
Q1 2021 143 Days
Q1 Q2 Q3 Q4 Q1 Q2 Q3 Q4 Q1 Q2 Q3 Q4 Q1 Q2 Q3 Q4 Q1 Q2
0
50
100
150
200
250
300
Median
Time
to
Sale
0
50
100
150
200
Median
Time
to
Contract
Quarterly Market Detail - Q2 2023
2019 2020 2021 2022
Palm Beach Board of REALTORSĀ®
Townhouses and Condos
Median Time to Contract
The median number of days between the listing date
and contract date for all Closed Sales during the quarter
2019 2020 2021 2022
Median Time to Sale
The median number of days between the listing date
and closing date for all Closed Sales during the quarter
This report describes member activity for the association and is not confined to any specific geographic area.
Produced by Florida RealtorsĀ® with data provided by Florida's multiple listing services. Statistics for each month compiled from MLS feeds on the 15th day of the following month.
Data released on Thursday, July 20, 2023. Next data release is Thursday, October 19, 2023.
Economists' note : New Listings tend to rise in delayed response to
increasing prices, so they are often seen as a lagging indicator of
market health. As prices rise, potential sellers raise their estimations
of valueā€”and in the most recent cycle, rising prices have freed up
many potential sellers who were previously underwater on their
mortgages. Note that in our calculations, we take care to not include
properties that were recently taken off the market and quickly
relisted, since these are not really new listings.
Economists' note : Because of the typical length of time it takes for a
sale to close, economists consider Pending Sales to be a decent
indicator of potential future Closed Sales. It is important to bear in
mind, however, that not all Pending Sales will be closed successfully.
So, the effectiveness of Pending Sales as a future indicator of Closed
Sales is susceptible to changes in market conditions such as the
availability of financing for homebuyers and the inventory of
distressed properties for sale.
Quarter New Pending Sales
Percent Change
Year-over-Year
Q2 2023 90 -16.7%
Year-to-Date 216 -29.2%
Q3 2021 113 -28.0%
Q1 2023 126 -36.0%
Q4 2022 63 -52.6%
Q1 2022 197 -38.1%
Q4 2021 133 -25.3%
Q3 2022 41 -63.7%
Q2 2022 108 -53.0%
Q2 2021 230 125.5%
Q1 2021 318 120.8%
Q4 2020 178 87.4%
Q3 2020 157 76.4%
Q2 2020 102 -40.0%
Quarter New Listings
Percent Change
Year-over-Year
Q2 2023 121 -14.2%
Q1 2023 198 10.6%
Q4 2022 152 -4.4%
Q3 2022 91 -26.0%
123 -39.4%
Q2 2021 150 -16.7%
Q2 2020 180 -1.6%
Q1 2021 216 -14.3%
Q4 2020 224 -16.7%
Year-to-Date 319 -0.3%
Q3 2020 203 23.0%
Q2 2022 141 -6.0%
Q1 2022 179 -17.1%
Q4 2021 159 -29.0%
Q3 2021
Q1 Q2 Q3 Q4 Q1 Q2 Q3 Q4 Q1 Q2 Q3 Q4 Q1 Q2 Q3 Q4 Q1 Q2
0
50
100
150
200
250
300
New
Listings
0
50
100
150
200
250
300
350
Pending
Sales
Quarterly Market Detail - Q2 2023
2019 2020 2021 2022
Palm Beach Board of REALTORSĀ®
Townhouses and Condos
New Pending Sales
The number of listed properties that went under
contract during the quarter
2019 2020 2021 2022
New Listings
The number of properties put onto the market during
the quarter
This report describes member activity for the association and is not confined to any specific geographic area.
Produced by Florida RealtorsĀ® with data provided by Florida's multiple listing services. Statistics for each month compiled from MLS feeds on the 15th day of the following month.
Data released on Thursday, July 20, 2023. Next data release is Thursday, October 19, 2023.
Economists' note : There are a number of ways to define and
calculate Inventory. Our method is to simply count the number of
active listings on the last day of the quarter, and hold this number to
compare with the same quarter the following year. Inventory rises
when New Listings are outpacing the number of listings that go off-
market (regardless of whether they actually sell). Likewise, it falls
when New Listings aren't keeping up with the rate at which homes
are going off-market.
Economists' note : MSI is a useful indicator of market conditions.
The benchmark for a balanced market (favoring neither buyer nor
seller) is 5.5 months of inventory. Anything higher is traditionally a
buyers' market, and anything lower is a sellers' market. There is no
single accepted way of calculating MSI. A common method is to
divide current Inventory by the most recent month's Closed Sales
count, but this count is a usually poor predictor of future Closed Sales
due to seasonal cycles. To eliminate seasonal effects, we use the 12-
month average of monthly Closed Sales instead.
YTD (Monthly Avg) 9.0 373.7%
Quarter Months Supply
Percent Change
Year-over-Year
Q2 2020 13.1 21.3%
Q4 2020 9.0 -30.2%
Q3 2020 11.0
Q2 2020 468 4.9%
Q4 2020 381 -30.0%
Q3 2020 408 -8.3%
3.8%
Q2 2021 1.7 -87.0%
Q1 2021 4.4 -61.7%
Q4 2021 1.9 -78.9%
Q3 2021 1.6 -85.5%
Q2 2022 2.7 58.8%
Q1 2022 1.6 -63.6%
Q4 2022 6.4 236.8%
Q3 2022 3.5 118.8%
Q2 2023 9.0 233.3%
Q1 2023 9.0 462.5%
221 -55.4%
Q4 2021 118 -69.0%
Q3 2021 107 -73.8%
Q2 2021 112 -76.1%
Q1 2021
27.1%
Q2 2022 117 4.5%
Q1 2022 91 -58.8%
Q3 2022 136
Quarter Inventory
Percent Change
Year-over-Year
Q2 2023 221 88.9%
244 147.7%
YTD (Monthly Avg)
Q1 2023 251 175.8%
Q4 2022 208 76.3%
Q1 Q2 Q3 Q4 Q1 Q2 Q3 Q4 Q1 Q2 Q3 Q4 Q1 Q2 Q3 Q4 Q1 Q2
0.0
2.0
4.0
6.0
8.0
10.0
12.0
14.0
Months
Supply
of
Inventory
0
100
200
300
400
500
600
Inventory
Quarterly Market Detail - Q2 2023
2019 2020 2021 2022
Palm Beach Board of REALTORSĀ®
Townhouses and Condos
Inventory (Active Listings)
The number of property listings active at the end of
the quarter
2019 2020 2021 2022
Months Supply of Inventory
An estimate of the number of months it will take to
deplete the current Inventory given recent sales rates
This report describes member activity for the association and is not confined to any specific geographic area.
Produced by Florida RealtorsĀ® with data provided by Florida's multiple listing services. Statistics for each month compiled from MLS feeds on the 15th day of the following month.
Data released on Thursday, July 20, 2023. Next data release is Thursday, October 19, 2023.
$600,000 - $999,999 126 Days 500.0%
$1,000,000 or more 79 Days 259.1%
Economists' note : Like Time to Sale, Time to Contract is a measure
of the length of the home selling process calculated for sales which
closed during the quarter. The difference is that Time to Contract
measures the number of days between the initial listing of a property
and the signing of the contract which eventually led to the closing of
the sale. When the gap between Median Time to Contract and Median
Time to Sale grows, it is usually a sign of longer closing times and/or
declining numbers of cash sales.
$150,000 - $199,999 (No Sales) N/A
$200,000 - $249,999 12 Days 9.1%
$250,000 - $299,999
$400,000 - $599,999 19 Days 137.5%
(No Sales) N/A
$300,000 - $399,999 51 Days -7.3%
Economists' note: Closed Sales are one of the simplestā€”yet most
importantā€”indicators for the residential real estate market. When
comparing Closed Sales across markets of different sizes, we
recommend comparing the percent changes in sales rather than the
number of sales. Closed Sales (and many other market metrics) are
affected by seasonal cycles, so actual trends are more accurately
represented by year-over-year changes (i.e. comparing a quarter's
sales to the amount of sales in the same quarter in the previous year),
rather than changes from one quarter to the next.
Sale Price
Median Time to
Contract
Percent Change
Year-over-Year
Less than $50,000 (No Sales) N/A
$1,000,000 or more 66 -22.4%
$250,000 - $299,999 0 -100.0%
$300,000 - $399,999 9 200.0%
$50,000 - $99,999 7 Days N/A
$100,000 - $149,999
$400,000 - $599,999 7 -66.7%
$600,000 - $999,999 19 -20.8%
(No Sales) N/A
$150,000 - $199,999 0 -100.0%
$200,000 - $249,999 2 100.0%
$100,000 - $149,999 0 -100.0%
Sale Price Closed Sales
Percent Change
Year-over-Year
Less than $50,000 0 N/A
$50,000 - $99,999 1 N/A
0
20
40
60
80
100
120
140
Less than
$50,000
$50,000 -
$99,999
$100,000 -
$149,999
$150,000 -
$199,999
$200,000 -
$249,999
$250,000 -
$299,999
$300,000 -
$399,999
$400,000 -
$599,999
$600,000 -
$999,999
$1,000,000 or
more
Median
Time
to
Contract
Q2 2022 Q2 2023
0
20
40
60
80
100
120
140
0
10
20
30
40
50
60
70
80
90
Less than
$50,000
$50,000 -
$99,999
$100,000 -
$149,999
$150,000 -
$199,999
$200,000 -
$249,999
$250,000 -
$299,999
$300,000 -
$399,999
$400,000 -
$599,999
$600,000 -
$999,999
$1,000,000 or
more
Closed
Sales
Q2 2022 Q2 2023
0
10
20
30
40
50
60
70
80
90
Quarterly Market Detail - Q2 2023
Palm Beach Board of REALTORSĀ®
Townhouses and Condos
Closed Sales by Sale Price
The number of sales transactions which closed during
the quarter
Median Time to Contract by Sale Price
The median number of days between the listing date
and contract date for all Closed Sales during the quarter
This report describes member activity for the association and is not confined to any specific geographic area.
Produced by Florida RealtorsĀ® with data provided by Florida's multiple listing services. Statistics for each month compiled from MLS feeds on the 15th day of the following month.
Data released on Thursday, July 20, 2023. Next data release is Thursday, October 19, 2023.
$600,000 - $999,999 39 178.6%
$1,000,000 or more 142 79.7%
Economists' note : There are a number of ways to define and
calculate Inventory. Our method is to simply count the number of
active listings on the last day of the quarter, and hold this number to
compare with the same quarter the following year. Inventory rises
when New Listings are outpacing the number of listings that go off-
market (regardless of whether they actually sell). Likewise, it falls
when New Listings aren't keeping up with the rate at which homes
are going off-market.
$150,000 - $199,999 1 0.0%
$200,000 - $249,999 0 N/A
$250,000 - $299,999 3 N/A
$300,000 - $399,999 6 -14.3%
$400,000 - $599,999 29 107.1%
$50,000 - $99,999 0 N/A
$100,000 - $149,999 1 -50.0%
Current Listing Price Inventory
Percent Change
Year-over-Year
Less than $50,000 0 N/A
$600,000 - $999,999 22 4.8%
$1,000,000 or more 73 -13.1%
Economists' note: New Listings tend to rise in delayed response to
increasing prices, so they are often seen as a lagging indicator of
market health. As prices rise, potential sellers raise their estimations
of valueā€”and in the most recent cycle, rising prices have freed up
many potential sellers who were previously underwater on their
mortgages. Note that in our calculations, we take care to not include
properties that were recently taken off the market and quickly
relisted, since these are not really new listings.
$150,000 - $199,999 1 N/A
$200,000 - $249,999 1 0.0%
$250,000 - $299,999 2 100.0%
$300,000 - $399,999 3 -76.9%
$400,000 - $599,999 18 -14.3%
$50,000 - $99,999 1 N/A
$100,000 - $149,999 0 N/A
Initial Listing Price New Listings
Percent Change
Year-over-Year
Less than $50,000 0 N/A
0
20
40
60
80
100
120
140
160
Less than
$50,000
$50,000 -
$99,999
$100,000 -
$149,999
$150,000 -
$199,999
$200,000 -
$249,999
$250,000 -
$299,999
$300,000 -
$399,999
$400,000 -
$599,999
$600,000 -
$999,999
$1,000,000 or
more
Inventory
Q2 2022 Q2 2023
0
20
40
60
80
100
120
140
160
0
10
20
30
40
50
60
70
80
90
Less than
$50,000
$50,000 -
$99,999
$100,000 -
$149,999
$150,000 -
$199,999
$200,000 -
$249,999
$250,000 -
$299,999
$300,000 -
$399,999
$400,000 -
$599,999
$600,000 -
$999,999
$1,000,000 or
more
New
Listings
Q2 2022 Q2 2023
0
10
20
30
40
50
60
70
80
90
Quarterly Market Detail - Q2 2023
Palm Beach Board of REALTORSĀ®
Townhouses and Condos
New Listings by Initial Listing Price
The number of properties put onto the market during
the quarter
Inventory by Current Listing Price
The number of property listings active at the end of
the quarter
This report describes member activity for the association and is not confined to any specific geographic area.
Closed Sales
Median Sale Price
Closed Sales
Median Sale Price
Closed Sales
Median Sale Price
Produced by Florida RealtorsĀ® with data provided by Florida's multiple listing services. Statistics for each month compiled from MLS feeds on the 15th day of the following month.
Data released on Thursday, July 20, 2023. Next data release is Thursday, October 19, 2023.
Short Sale
0 0 N/A
(No Sales) (No Sales) N/A
Foreclosure/REO
0 0 N/A
(No Sales) (No Sales) N/A
Q2 2023 Q2 2022
Percent Change
Year-over-Year
Traditional
104 141 -26.2%
$1,525,000 $1,275,000 19.6%
$0
$200,000
$400,000
$600,000
$800,000
$1,000,000
$1,200,000
$1,400,000
$1,600,000
$1,800,000
Median
Sale
Price
0%
10%
20%
30%
40%
50%
60%
70%
80%
90%
100%
Closed
Sales
Traditional Foreclosure/REO Short Sale
2019 2020 2021 2022
Q1 Q2 Q3 Q4 Q1 Q2 Q3 Q4 Q1 Q2 Q3 Q4 Q1 Q2 Q3 Q4 Q1 Q2
Quarterly Distressed Market - Q2 2023
Palm Beach Board of REALTORSĀ®
Townhouses and Condos
2019 2020 2021 2022

More Related Content

Similar to The Palm Beach Real Estate Market: A Cooling Off

San Francisco Market Report November 2022.pdf
San Francisco Market Report November 2022.pdfSan Francisco Market Report November 2022.pdf
San Francisco Market Report November 2022.pdfRonny Budiutama
Ā 
San Francisco Market Report July 2022.pdf
San Francisco Market Report July 2022.pdfSan Francisco Market Report July 2022.pdf
San Francisco Market Report July 2022.pdfRonny Budiutama
Ā 
San Francisco May 2023 Market Report.pdf
San Francisco May 2023 Market Report.pdfSan Francisco May 2023 Market Report.pdf
San Francisco May 2023 Market Report.pdfRonny Budiutama
Ā 
San Francisco Market Report June 2022.pdf
San Francisco Market Report June 2022.pdfSan Francisco Market Report June 2022.pdf
San Francisco Market Report June 2022.pdfRonny Budiutama
Ā 
San Francisco Market Report May 2022.
San Francisco Market Report May 2022.San Francisco Market Report May 2022.
San Francisco Market Report May 2022.Ronny Budiutama
Ā 
San Francisco November 2023 Market Report
San Francisco November 2023 Market ReportSan Francisco November 2023 Market Report
San Francisco November 2023 Market ReportRonny Budiutama
Ā 
October 2023 Report: San Francisco Real Estate Market Insights
October 2023 Report: San Francisco Real Estate Market InsightsOctober 2023 Report: San Francisco Real Estate Market Insights
October 2023 Report: San Francisco Real Estate Market InsightsRonny Budiutama
Ā 
San Francisco Market Report For July 2021
San Francisco Market Report For July 2021San Francisco Market Report For July 2021
San Francisco Market Report For July 2021Ronny Budiutama
Ā 
San Francisco Market Focus Report Jan 2020
San Francisco Market Focus Report Jan 2020San Francisco Market Focus Report Jan 2020
San Francisco Market Focus Report Jan 2020Ronny Budiutama
Ā 
San Francisco Market Report February 2022
San Francisco Market Report February 2022San Francisco Market Report February 2022
San Francisco Market Report February 2022Ronny Budiutama
Ā 
San Francisco market focus report December 2019
San Francisco market focus report December 2019San Francisco market focus report December 2019
San Francisco market focus report December 2019Ronny Budiutama
Ā 
San Francisco market report August 2020
San Francisco market report August 2020San Francisco market report August 2020
San Francisco market report August 2020Ronny Budiutama
Ā 
San Francisco June 2023 Market Report.pdf
San Francisco June 2023 Market Report.pdfSan Francisco June 2023 Market Report.pdf
San Francisco June 2023 Market Report.pdfRonny Budiutama
Ā 
San Francisco Market Report July 2023.pdf
San Francisco Market Report July 2023.pdfSan Francisco Market Report July 2023.pdf
San Francisco Market Report July 2023.pdfRonny Budiutama
Ā 
October Stats.pdf
October Stats.pdfOctober Stats.pdf
October Stats.pdfMichelle Makos
Ā 
San Francisco Market Report April 2022.pdf
San Francisco Market Report April 2022.pdfSan Francisco Market Report April 2022.pdf
San Francisco Market Report April 2022.pdfRonny Budiutama
Ā 
San Francisco Market Report December 2020
San Francisco Market Report December 2020San Francisco Market Report December 2020
San Francisco Market Report December 2020Ronny Budiutama
Ā 
San Francisco December 2023 Market Report
San Francisco December 2023 Market ReportSan Francisco December 2023 Market Report
San Francisco December 2023 Market ReportRonny Budiutama
Ā 
San Francisco market report April 2020
San Francisco market report April 2020San Francisco market report April 2020
San Francisco market report April 2020Ronny Budiutama
Ā 
San Francisco Market Report for March 2020
San Francisco Market Report for March 2020San Francisco Market Report for March 2020
San Francisco Market Report for March 2020Ronny Budiutama
Ā 

Similar to The Palm Beach Real Estate Market: A Cooling Off (20)

San Francisco Market Report November 2022.pdf
San Francisco Market Report November 2022.pdfSan Francisco Market Report November 2022.pdf
San Francisco Market Report November 2022.pdf
Ā 
San Francisco Market Report July 2022.pdf
San Francisco Market Report July 2022.pdfSan Francisco Market Report July 2022.pdf
San Francisco Market Report July 2022.pdf
Ā 
San Francisco May 2023 Market Report.pdf
San Francisco May 2023 Market Report.pdfSan Francisco May 2023 Market Report.pdf
San Francisco May 2023 Market Report.pdf
Ā 
San Francisco Market Report June 2022.pdf
San Francisco Market Report June 2022.pdfSan Francisco Market Report June 2022.pdf
San Francisco Market Report June 2022.pdf
Ā 
San Francisco Market Report May 2022.
San Francisco Market Report May 2022.San Francisco Market Report May 2022.
San Francisco Market Report May 2022.
Ā 
San Francisco November 2023 Market Report
San Francisco November 2023 Market ReportSan Francisco November 2023 Market Report
San Francisco November 2023 Market Report
Ā 
October 2023 Report: San Francisco Real Estate Market Insights
October 2023 Report: San Francisco Real Estate Market InsightsOctober 2023 Report: San Francisco Real Estate Market Insights
October 2023 Report: San Francisco Real Estate Market Insights
Ā 
San Francisco Market Report For July 2021
San Francisco Market Report For July 2021San Francisco Market Report For July 2021
San Francisco Market Report For July 2021
Ā 
San Francisco Market Focus Report Jan 2020
San Francisco Market Focus Report Jan 2020San Francisco Market Focus Report Jan 2020
San Francisco Market Focus Report Jan 2020
Ā 
San Francisco Market Report February 2022
San Francisco Market Report February 2022San Francisco Market Report February 2022
San Francisco Market Report February 2022
Ā 
San Francisco market focus report December 2019
San Francisco market focus report December 2019San Francisco market focus report December 2019
San Francisco market focus report December 2019
Ā 
San Francisco market report August 2020
San Francisco market report August 2020San Francisco market report August 2020
San Francisco market report August 2020
Ā 
San Francisco June 2023 Market Report.pdf
San Francisco June 2023 Market Report.pdfSan Francisco June 2023 Market Report.pdf
San Francisco June 2023 Market Report.pdf
Ā 
San Francisco Market Report July 2023.pdf
San Francisco Market Report July 2023.pdfSan Francisco Market Report July 2023.pdf
San Francisco Market Report July 2023.pdf
Ā 
October Stats.pdf
October Stats.pdfOctober Stats.pdf
October Stats.pdf
Ā 
San Francisco Market Report April 2022.pdf
San Francisco Market Report April 2022.pdfSan Francisco Market Report April 2022.pdf
San Francisco Market Report April 2022.pdf
Ā 
San Francisco Market Report December 2020
San Francisco Market Report December 2020San Francisco Market Report December 2020
San Francisco Market Report December 2020
Ā 
San Francisco December 2023 Market Report
San Francisco December 2023 Market ReportSan Francisco December 2023 Market Report
San Francisco December 2023 Market Report
Ā 
San Francisco market report April 2020
San Francisco market report April 2020San Francisco market report April 2020
San Francisco market report April 2020
Ā 
San Francisco Market Report for March 2020
San Francisco Market Report for March 2020San Francisco Market Report for March 2020
San Francisco Market Report for March 2020
Ā 

Recently uploaded

Listing Turkey Sylvana Istanbul - Bahcesehir
Listing Turkey Sylvana Istanbul - BahcesehirListing Turkey Sylvana Istanbul - Bahcesehir
Listing Turkey Sylvana Istanbul - BahcesehirListing Turkey
Ā 
Call Girls in Sarai Kale Khan Delhi šŸ’ÆCall Us šŸ”8264348440šŸ”
Call Girls in Sarai Kale Khan Delhi šŸ’ÆCall Us šŸ”8264348440šŸ”Call Girls in Sarai Kale Khan Delhi šŸ’ÆCall Us šŸ”8264348440šŸ”
Call Girls in Sarai Kale Khan Delhi šŸ’ÆCall Us šŸ”8264348440šŸ”soniya singh
Ā 
Low Rate Call Girls in Triveni Complex Delhi Call 9990771857
Low Rate Call Girls in Triveni Complex Delhi Call 9990771857Low Rate Call Girls in Triveni Complex Delhi Call 9990771857
Low Rate Call Girls in Triveni Complex Delhi Call 9990771857delhimodel235
Ā 
9990771857 Call Girls in Noida Sector 1 Noida (Call Girls) Delhi
9990771857 Call Girls in Noida Sector 1 Noida (Call Girls) Delhi9990771857 Call Girls in Noida Sector 1 Noida (Call Girls) Delhi
9990771857 Call Girls in Noida Sector 1 Noida (Call Girls) Delhidelhimodel235
Ā 
Magarpatta Nova Elegance Mundhwa Pune E-Brochure.pdf
Magarpatta Nova Elegance Mundhwa Pune  E-Brochure.pdfMagarpatta Nova Elegance Mundhwa Pune  E-Brochure.pdf
Magarpatta Nova Elegance Mundhwa Pune E-Brochure.pdfManishSaxena95
Ā 
Call Girls In Mayur Vihar Delhi ā˜†ā†«8447779280 ā¤Escorts Service In Delhi
Call Girls In Mayur Vihar Delhi ā˜†ā†«8447779280 ā¤Escorts Service In DelhiCall Girls In Mayur Vihar Delhi ā˜†ā†«8447779280 ā¤Escorts Service In Delhi
Call Girls In Mayur Vihar Delhi ā˜†ā†«8447779280 ā¤Escorts Service In Delhiasmaqueen5
Ā 
Call Girls in Kashmiri Gate Delhi šŸ’ÆCall Us šŸ”8264348440šŸ”
Call Girls in Kashmiri Gate Delhi šŸ’ÆCall Us šŸ”8264348440šŸ”Call Girls in Kashmiri Gate Delhi šŸ’ÆCall Us šŸ”8264348440šŸ”
Call Girls in Kashmiri Gate Delhi šŸ’ÆCall Us šŸ”8264348440šŸ”soniya singh
Ā 
The Omaxe State Dwarka Delhi-broucher.pdf.pdf
The Omaxe State Dwarka Delhi-broucher.pdf.pdfThe Omaxe State Dwarka Delhi-broucher.pdf.pdf
The Omaxe State Dwarka Delhi-broucher.pdf.pdfkratirudram
Ā 
Model Call Girl in Shastri Nagar Delhi reach out to us at šŸ”8264348440šŸ”
Model Call Girl in Shastri Nagar Delhi reach out to us at šŸ”8264348440šŸ”Model Call Girl in Shastri Nagar Delhi reach out to us at šŸ”8264348440šŸ”
Model Call Girl in Shastri Nagar Delhi reach out to us at šŸ”8264348440šŸ”soniya singh
Ā 
Call Girls in Pitampura Delhi šŸ’ÆCall Us šŸ”8264348440šŸ”
Call Girls in Pitampura Delhi šŸ’ÆCall Us šŸ”8264348440šŸ”Call Girls in Pitampura Delhi šŸ’ÆCall Us šŸ”8264348440šŸ”
Call Girls in Pitampura Delhi šŸ’ÆCall Us šŸ”8264348440šŸ”soniya singh
Ā 
Call Girls in Model Town Delhi šŸ’ÆCall Us šŸ”8264348440šŸ”
Call Girls in Model Town Delhi šŸ’ÆCall Us šŸ”8264348440šŸ”Call Girls in Model Town Delhi šŸ’ÆCall Us šŸ”8264348440šŸ”
Call Girls in Model Town Delhi šŸ’ÆCall Us šŸ”8264348440šŸ”soniya singh
Ā 
Call Girls in Khan Market 9654467111 ESCORTS SERVICE
Call Girls in Khan Market 9654467111 ESCORTS SERVICECall Girls in Khan Market 9654467111 ESCORTS SERVICE
Call Girls in Khan Market 9654467111 ESCORTS SERVICESapana Sha
Ā 
Sankla East World Hadapsar Pune E-Brochure.pdf
Sankla East World Hadapsar Pune  E-Brochure.pdfSankla East World Hadapsar Pune  E-Brochure.pdf
Sankla East World Hadapsar Pune E-Brochure.pdfManishSaxena95
Ā 
Call Girls in Noida Sector 11 Noida šŸ’ÆCall Us šŸ” 9582086666 šŸ” South Delhi Escor...
Call Girls in Noida Sector 11 Noida šŸ’ÆCall Us šŸ” 9582086666 šŸ” South Delhi Escor...Call Girls in Noida Sector 11 Noida šŸ’ÆCall Us šŸ” 9582086666 šŸ” South Delhi Escor...
Call Girls in Noida Sector 11 Noida šŸ’ÆCall Us šŸ” 9582086666 šŸ” South Delhi Escor...delhimodel235
Ā 
Call Girls Janta Market {Delhi//8447779280)) ā‚¹ā†¬Short 2000 Full Night 5500 ā†«Es...
Call Girls Janta Market {Delhi//8447779280)) ā‚¹ā†¬Short 2000 Full Night 5500 ā†«Es...Call Girls Janta Market {Delhi//8447779280)) ā‚¹ā†¬Short 2000 Full Night 5500 ā†«Es...
Call Girls Janta Market {Delhi//8447779280)) ā‚¹ā†¬Short 2000 Full Night 5500 ā†«Es...asmaqueen5
Ā 
Low Rate Call Girls in Tughlakabad Delhi Call 9990771857
Low Rate Call Girls in Tughlakabad Delhi Call 9990771857Low Rate Call Girls in Tughlakabad Delhi Call 9990771857
Low Rate Call Girls in Tughlakabad Delhi Call 9990771857delhimodel235
Ā 
Aparna Greenscapes Kompally Hyderabad E - Brochure.pdf
Aparna Greenscapes Kompally Hyderabad E - Brochure.pdfAparna Greenscapes Kompally Hyderabad E - Brochure.pdf
Aparna Greenscapes Kompally Hyderabad E - Brochure.pdffaheemali990101
Ā 
9990771857 Call Girls in Noida Sector 11 Noida (Call Girls) Delhi
9990771857 Call Girls in Noida Sector 11 Noida (Call Girls) Delhi9990771857 Call Girls in Noida Sector 11 Noida (Call Girls) Delhi
9990771857 Call Girls in Noida Sector 11 Noida (Call Girls) Delhidelhimodel235
Ā 
Purva Palm Hills Devanahalli, Bangalore E- Brochure.pdf
Purva Palm Hills Devanahalli, Bangalore E- Brochure.pdfPurva Palm Hills Devanahalli, Bangalore E- Brochure.pdf
Purva Palm Hills Devanahalli, Bangalore E- Brochure.pdffaheemali990101
Ā 
Building Dreams: Newman Leech's Visionary Approach to Real Estate Investment
Building Dreams: Newman Leech's Visionary Approach to Real Estate InvestmentBuilding Dreams: Newman Leech's Visionary Approach to Real Estate Investment
Building Dreams: Newman Leech's Visionary Approach to Real Estate InvestmentNewman George Leech
Ā 

Recently uploaded (20)

Listing Turkey Sylvana Istanbul - Bahcesehir
Listing Turkey Sylvana Istanbul - BahcesehirListing Turkey Sylvana Istanbul - Bahcesehir
Listing Turkey Sylvana Istanbul - Bahcesehir
Ā 
Call Girls in Sarai Kale Khan Delhi šŸ’ÆCall Us šŸ”8264348440šŸ”
Call Girls in Sarai Kale Khan Delhi šŸ’ÆCall Us šŸ”8264348440šŸ”Call Girls in Sarai Kale Khan Delhi šŸ’ÆCall Us šŸ”8264348440šŸ”
Call Girls in Sarai Kale Khan Delhi šŸ’ÆCall Us šŸ”8264348440šŸ”
Ā 
Low Rate Call Girls in Triveni Complex Delhi Call 9990771857
Low Rate Call Girls in Triveni Complex Delhi Call 9990771857Low Rate Call Girls in Triveni Complex Delhi Call 9990771857
Low Rate Call Girls in Triveni Complex Delhi Call 9990771857
Ā 
9990771857 Call Girls in Noida Sector 1 Noida (Call Girls) Delhi
9990771857 Call Girls in Noida Sector 1 Noida (Call Girls) Delhi9990771857 Call Girls in Noida Sector 1 Noida (Call Girls) Delhi
9990771857 Call Girls in Noida Sector 1 Noida (Call Girls) Delhi
Ā 
Magarpatta Nova Elegance Mundhwa Pune E-Brochure.pdf
Magarpatta Nova Elegance Mundhwa Pune  E-Brochure.pdfMagarpatta Nova Elegance Mundhwa Pune  E-Brochure.pdf
Magarpatta Nova Elegance Mundhwa Pune E-Brochure.pdf
Ā 
Call Girls In Mayur Vihar Delhi ā˜†ā†«8447779280 ā¤Escorts Service In Delhi
Call Girls In Mayur Vihar Delhi ā˜†ā†«8447779280 ā¤Escorts Service In DelhiCall Girls In Mayur Vihar Delhi ā˜†ā†«8447779280 ā¤Escorts Service In Delhi
Call Girls In Mayur Vihar Delhi ā˜†ā†«8447779280 ā¤Escorts Service In Delhi
Ā 
Call Girls in Kashmiri Gate Delhi šŸ’ÆCall Us šŸ”8264348440šŸ”
Call Girls in Kashmiri Gate Delhi šŸ’ÆCall Us šŸ”8264348440šŸ”Call Girls in Kashmiri Gate Delhi šŸ’ÆCall Us šŸ”8264348440šŸ”
Call Girls in Kashmiri Gate Delhi šŸ’ÆCall Us šŸ”8264348440šŸ”
Ā 
The Omaxe State Dwarka Delhi-broucher.pdf.pdf
The Omaxe State Dwarka Delhi-broucher.pdf.pdfThe Omaxe State Dwarka Delhi-broucher.pdf.pdf
The Omaxe State Dwarka Delhi-broucher.pdf.pdf
Ā 
Model Call Girl in Shastri Nagar Delhi reach out to us at šŸ”8264348440šŸ”
Model Call Girl in Shastri Nagar Delhi reach out to us at šŸ”8264348440šŸ”Model Call Girl in Shastri Nagar Delhi reach out to us at šŸ”8264348440šŸ”
Model Call Girl in Shastri Nagar Delhi reach out to us at šŸ”8264348440šŸ”
Ā 
Call Girls in Pitampura Delhi šŸ’ÆCall Us šŸ”8264348440šŸ”
Call Girls in Pitampura Delhi šŸ’ÆCall Us šŸ”8264348440šŸ”Call Girls in Pitampura Delhi šŸ’ÆCall Us šŸ”8264348440šŸ”
Call Girls in Pitampura Delhi šŸ’ÆCall Us šŸ”8264348440šŸ”
Ā 
Call Girls in Model Town Delhi šŸ’ÆCall Us šŸ”8264348440šŸ”
Call Girls in Model Town Delhi šŸ’ÆCall Us šŸ”8264348440šŸ”Call Girls in Model Town Delhi šŸ’ÆCall Us šŸ”8264348440šŸ”
Call Girls in Model Town Delhi šŸ’ÆCall Us šŸ”8264348440šŸ”
Ā 
Call Girls in Khan Market 9654467111 ESCORTS SERVICE
Call Girls in Khan Market 9654467111 ESCORTS SERVICECall Girls in Khan Market 9654467111 ESCORTS SERVICE
Call Girls in Khan Market 9654467111 ESCORTS SERVICE
Ā 
Sankla East World Hadapsar Pune E-Brochure.pdf
Sankla East World Hadapsar Pune  E-Brochure.pdfSankla East World Hadapsar Pune  E-Brochure.pdf
Sankla East World Hadapsar Pune E-Brochure.pdf
Ā 
Call Girls in Noida Sector 11 Noida šŸ’ÆCall Us šŸ” 9582086666 šŸ” South Delhi Escor...
Call Girls in Noida Sector 11 Noida šŸ’ÆCall Us šŸ” 9582086666 šŸ” South Delhi Escor...Call Girls in Noida Sector 11 Noida šŸ’ÆCall Us šŸ” 9582086666 šŸ” South Delhi Escor...
Call Girls in Noida Sector 11 Noida šŸ’ÆCall Us šŸ” 9582086666 šŸ” South Delhi Escor...
Ā 
Call Girls Janta Market {Delhi//8447779280)) ā‚¹ā†¬Short 2000 Full Night 5500 ā†«Es...
Call Girls Janta Market {Delhi//8447779280)) ā‚¹ā†¬Short 2000 Full Night 5500 ā†«Es...Call Girls Janta Market {Delhi//8447779280)) ā‚¹ā†¬Short 2000 Full Night 5500 ā†«Es...
Call Girls Janta Market {Delhi//8447779280)) ā‚¹ā†¬Short 2000 Full Night 5500 ā†«Es...
Ā 
Low Rate Call Girls in Tughlakabad Delhi Call 9990771857
Low Rate Call Girls in Tughlakabad Delhi Call 9990771857Low Rate Call Girls in Tughlakabad Delhi Call 9990771857
Low Rate Call Girls in Tughlakabad Delhi Call 9990771857
Ā 
Aparna Greenscapes Kompally Hyderabad E - Brochure.pdf
Aparna Greenscapes Kompally Hyderabad E - Brochure.pdfAparna Greenscapes Kompally Hyderabad E - Brochure.pdf
Aparna Greenscapes Kompally Hyderabad E - Brochure.pdf
Ā 
9990771857 Call Girls in Noida Sector 11 Noida (Call Girls) Delhi
9990771857 Call Girls in Noida Sector 11 Noida (Call Girls) Delhi9990771857 Call Girls in Noida Sector 11 Noida (Call Girls) Delhi
9990771857 Call Girls in Noida Sector 11 Noida (Call Girls) Delhi
Ā 
Purva Palm Hills Devanahalli, Bangalore E- Brochure.pdf
Purva Palm Hills Devanahalli, Bangalore E- Brochure.pdfPurva Palm Hills Devanahalli, Bangalore E- Brochure.pdf
Purva Palm Hills Devanahalli, Bangalore E- Brochure.pdf
Ā 
Building Dreams: Newman Leech's Visionary Approach to Real Estate Investment
Building Dreams: Newman Leech's Visionary Approach to Real Estate InvestmentBuilding Dreams: Newman Leech's Visionary Approach to Real Estate Investment
Building Dreams: Newman Leech's Visionary Approach to Real Estate Investment
Ā 

The Palm Beach Real Estate Market: A Cooling Off

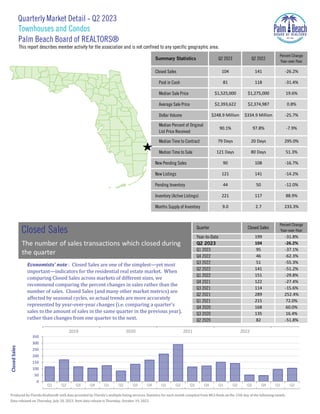
  • 1. This report describes member activity for the association and is not confined to any specific geographic area. Produced by Florida RealtorsĀ® with data provided by Florida's multiple listing services. Statistics for each month compiled from MLS feeds on the 15th day of the following month. Data released on Thursday, July 20, 2023. Next data release is Thursday, October 19, 2023. Year-to-Date 199 -31.8% -26.2% 141 -14.2% Closed Sales 104 80 Days 50 -12.0% 117 88.9% 2.7 233.3% Summary Statistics Closed Sales Paid in Cash 90.1% Q2 2023 $1,525,000 Median Sale Price Average Sale Price Dollar Volume Median Percent of Original List Price Received $1,275,000 19.6% $248.9 Million $334.9 Million -25.7% $2,393,622 $2,374,987 0.8% Q2 2022 Percent Change Year-over-Year 81 118 -31.4% 104 141 -26.2% 97.8% -7.9% 79 Days 20 Days 295.0% Q2 2023 Median Time to Contract 121 Days 90 Median Time to Sale New Pending Sales New Listings Quarter 121 Pending Inventory 44 Inventory (Active Listings) 221 Months Supply of Inventory 9.0 51.3% 108 -16.7% Percent Change Year-over-Year 135 Q2 2020 82 Q3 2021 114 Q2 2021 289 Q2 2022 141 Q1 2022 151 Q4 2021 122 Economists' note : Closed Sales are one of the simplestā€”yet most importantā€”indicators for the residential real estate market. When comparing Closed Sales across markets of different sizes, we recommend comparing the percent changes in sales rather than the number of sales. Closed Sales (and many other market metrics) are affected by seasonal cycles, so actual trends are more accurately represented by year-over-year changes (i.e. comparing a quarter's sales to the amount of sales in the same quarter in the previous year), rather than changes from one quarter to the next. Q1 2023 95 -37.1% -62.3% -55.3% Q4 2022 46 Q3 2022 51 -51.8% Q1 2021 215 Q4 2020 168 72.0% 60.0% 16.4% -51.2% -29.8% -15.6% 252.4% -27.4% Q3 2020 Q1 Q2 Q3 Q4 Q1 Q2 Q3 Q4 Q1 Q2 Q3 Q4 Q1 Q2 Q3 Q4 Q1 Q2 Quarterly Market Detail - Q2 2023 Palm Beach Board of REALTORSĀ® Townhouses and Condos Closed Sales The number of sales transactions which closed during the quarter 2019 2020 2021 2022 0 50 100 150 200 250 300 350 Closed Sales
  • 2. This report describes member activity for the association and is not confined to any specific geographic area. Produced by Florida RealtorsĀ® with data provided by Florida's multiple listing services. Statistics for each month compiled from MLS feeds on the 15th day of the following month. Data released on Thursday, July 20, 2023. Next data release is Thursday, October 19, 2023. Q3 2022 Quarter Cash Sales Percent Change Year-over-Year Q2 2023 81 -31.4% Q1 2023 82 -32.8% Q4 2022 35 -63.9% Year-to-Date 163 -32.1% 175 71.6% 35 -61.5% Q2 2022 118 -50.4% Q3 2021 91 -7.1% Q1 2022 122 -30.3% Q4 2021 97 -23.6% Q2 2023 77.9% -6.9% Q1 2023 86.3% 6.8% Q4 2022 76.1% -4.3% Q3 2022 68.6% -14.0% -7.7% Q2 2022 83.7% 1.6% Q1 2022 80.8% -0.7% Q4 2021 79.5% 5.2% Q3 2021 79.8% 9.9% Q2 2021 82.4% 12.6% Economists' note : This statistic is simply another way of viewing Cash Sales. The remaining percentages of Closed Sales (i.e. those not paid fully in cash) each quarter involved some sort of financing, such as mortgages, owner/seller financing, assumed loans, etc. Economists' note : Cash Sales can be a useful indicator of the extent to which investors are participating in the market. Why? Investors are far more likely to have the funds to purchase a home available up front, whereas the typical homebuyer requires a mortgage or some other form of financing. There are, of course, many possible exceptions, so this statistic should be interpreted with care. Year-to-Date 81.9% -0.4% Quarter Percent of Closed Sales Paid in Cash Percent Change Year-over-Year Q3 2020 72.6% -1.0% Q2 2020 Q2 2020 60 -51.2% Q4 2020 73.2% 1.1% Q1 2021 81.4% Q2 2021 238 296.7% Q1 2021 127 47.7% Q3 2020 98 15.3% -0.2% Q4 2020 75.6% Q1 Q2 Q3 Q4 Q1 Q2 Q3 Q4 Q1 Q2 Q3 Q4 Q1 Q2 Q3 Q4 Q1 Q2 Q1 Q2 Q3 Q4 Q1 Q2 Q3 Q4 Q1 Q2 Q3 Q4 Q1 Q2 Q3 Q4 Q1 Q2 0% 20% 40% 60% 80% 100% Pct. of Closed Sales Paid in Cash 0 50 100 150 200 250 Cash Sales Quarterly Market Detail - Q2 2023 2019 2020 2021 2022 Palm Beach Board of REALTORSĀ® Townhouses and Condos Cash Sales The number of Closed Sales during the quarter in which buyers exclusively paid in cash 2019 2020 2021 2022 Cash Sales as a Percentage of Closed Sales The percentage of Closed Sales during the quarter which were Cash Sales
  • 3. This report describes member activity for the association and is not confined to any specific geographic area. Produced by Florida RealtorsĀ® with data provided by Florida's multiple listing services. Statistics for each month compiled from MLS feeds on the 15th day of the following month. Data released on Thursday, July 20, 2023. Next data release is Thursday, October 19, 2023. Quarter Median Sale Price Percent Change Year-over-Year Q2 2023 $1,525,000 19.6% Year-to-Date $1,400,000 8.0% Q3 2021 $725,000 -7.3% Q1 2023 $1,305,000 -1.4% Q4 2022 $1,145,000 42.2% Q1 2022 $1,323,000 39.3% Q4 2021 $805,000 -8.0% Q3 2022 $998,000 37.7% Q2 2022 $1,275,000 27.6% Q2 2021 $999,500 22.1% Q1 2021 $950,000 19.5% Q4 2020 $875,000 26.4% Q3 2020 $782,500 7.6% Q2 2020 $818,750 23.4% Quarter Average Sale Price Percent Change Year-over-Year Q2 2023 $2,393,622 0.8% Q1 2023 $2,511,458 23.0% Q4 2022 $2,268,867 36.2% Q3 2022 $1,732,392 21.7% -29.3% Q2 2022 $2,374,987 51.6% Q1 2022 $2,041,792 31.2% Q4 2021 $1,666,358 5.1% Q3 2021 $1,423,596 1.6% Q2 2021 $1,566,302 7.1% 11.2% $2,449,875 Year-to-Date Economists' note : Median Sale Price is our preferred summary statistic for price activity because, unlike Average Sale Price, Median Sale Price is not sensitive to high sale prices for small numbers of homes that may not be characteristic of the market area. Keep in mind that median price trends over time are not always solely caused by changes in the general value of local real estate. Median sale price only reflects the values of the homes that sold each quarter, and the mix of the types of homes that sell can change over time. Economists' note : Usually, we prefer Median Sale Price over Average Sale Price as a summary statistic for home prices. However, Average Sale Price does have its usesā€”particularly when it is analyzed alongside the Median Sale Price. For one, the relative difference between the two statistics can provide some insight into the market for higher-end homes in an area. Q3 2020 $1,400,570 -40.7% Q2 2020 $1,462,160 22.3% Q1 2021 $1,556,520 6.5% Q4 2020 $1,585,254 Q1 Q2 Q3 Q4 Q1 Q2 Q3 Q4 Q1 Q2 Q3 Q4 Q1 Q2 Q3 Q4 Q1 Q2 Q1 Q2 Q3 Q4 Q1 Q2 Q3 Q4 Q1 Q2 Q3 Q4 Q1 Q2 Q3 Q4 Q1 Q2 $0K $500K $1000K $1500K $2000K $2500K $3000K Average Sale Price $0K $500K $1000K $1500K $2000K Median Sale Price Quarterly Market Detail - Q2 2023 2019 2020 2021 2022 Palm Beach Board of REALTORSĀ® Townhouses and Condos Median Sale Price The median sale price reported for the quarter (i.e. 50% of sales were above and 50% of sales were below) 2019 2020 2021 2022 Average Sale Price The average sale price reported for the quarter (i.e. total sales in dollars divided by the number of sales)
  • 4. This report describes member activity for the association and is not confined to any specific geographic area. Produced by Florida RealtorsĀ® with data provided by Florida's multiple listing services. Statistics for each month compiled from MLS feeds on the 15th day of the following month. Data released on Thursday, July 20, 2023. Next data release is Thursday, October 19, 2023. Quarter Dollar Volume Percent Change Year-over-Year Q2 2023 $248.9 Million -25.7% Year-to-Date $487.5 Million -24.2% -14.2% Q1 2023 $238.6 Million -22.6% Q4 2022 $104.4 Million -48.7% $334.7 Million 83.2% Q3 2022 $88.4 Million -45.6% Q2 2022 $334.9 Million -26.0% Q1 2022 $308.3 Million -7.9% Q4 2021 $203.3 Million -23.7% Q3 2021 $162.3 Million Q2 2023 90.1% -7.9% Q1 2023 91.3% -4.8% Q4 2022 91.5% -5.3% Q3 2022 94.7% -1.0% -1.4% Q2 2022 97.8% 2.9% Q1 2022 95.9% 2.2% Q4 2021 96.6% 5.6% Q3 2021 95.7% 6.2% Q2 2021 95.0% 4.9% Economists' note : The Median Percent of Original List Price Received is useful as an indicator of market recovery, since it typically rises as buyers realize that the market may be moving away from them and they need to match the selling price (or better it) in order to get a contract on the house. This is usually the last measure to indicate a market has shifted from down to up, so it is what we would call a lagging indicator. Economists' note : Dollar Volume is simply the sum of all sale prices in a given time period, and can quickly be calculated by multiplying Closed Sales by Average Sale Price. It is a strong indicator of the health of the real estate industry in a market, and is of particular interest to real estate professionals, investors, analysts, and government agencies. Potential home sellers and home buyers, on the other hand, will likely be better served by paying attention to trends in the two components of Dollar Volume (i.e. sales and prices) individually. -6.5% 91.0% Year-to-Date Quarter Med. Pct. of Orig. List Price Received Percent Change Year-over-Year Q3 2020 90.1% -0.9% Q2 2020 Q2 2020 $119.9 Million -41.0% Q4 2020 90.6% 1.8% Q1 2021 93.8% Q2 2021 $452.7 Million 277.5% Q1 2021 $266.3 Million 13.0% Q3 2020 $189.1 Million -31.0% 3.9% Q4 2020 91.5% Q1 Q2 Q3 Q4 Q1 Q2 Q3 Q4 Q1 Q2 Q3 Q4 Q1 Q2 Q3 Q4 Q1 Q2 Q1 Q2 Q3 Q4 Q1 Q2 Q3 Q4 Q1 Q2 Q3 Q4 Q1 Q2 Q3 Q4 Q1 Q2 0% 20% 40% 60% 80% 100% 120% Med. Pct. of Orig. List Price Received $0 $100 M $200 M $300 M $400 M $500 M Dollar Volume Quarterly Market Detail - Q2 2023 2019 2020 2021 2022 Palm Beach Board of REALTORSĀ® Townhouses and Condos Dollar Volume The sum of the sale prices for all sales which closed during the quarter 2019 2020 2021 2022 Median Percent of Original List Price Received The median of the sale price (as a percentage of the original list price) across all properties selling during the quarter
  • 5. This report describes member activity for the association and is not confined to any specific geographic area. Produced by Florida RealtorsĀ® with data provided by Florida's multiple listing services. Statistics for each month compiled from MLS feeds on the 15th day of the following month. Data released on Thursday, July 20, 2023. Next data release is Thursday, October 19, 2023. 60 Days 100.0% Q3 2022 21 Days -63.2% Q2 2021 70 Days -45.3% Quarter Median Time to Contract Percent Change Year-over-Year Q2 2023 79 Days 295.0% 75 Days 212.5% Year-to-Date Q1 2023 74 Days 138.7% Q4 2022 Q4 2021 30 Days -78.4% Q3 2021 57 Days -67.6% Q2 2022 20 Days -71.4% Q1 2022 31 Days -71.0% 107 Days -8.5% Q4 2020 139 Days -7.9% Q1 2021 Q3 2020 176 Days 8.0% Q2 2020 128 Days 7.6% Quarter Median Time to Sale Percent Change Year-over-Year Q2 2023 121 Days 51.3% 47.4% 115 Days Year-to-Date Q1 2023 113 Days 44.9% Q4 2022 105 Days 47.9% -7.7% Q3 2022 83 Days -26.5% Q2 2022 80 Days -30.4% Q1 2022 78 Days -45.5% Q4 2021 71 Days -56.4% Q3 2021 113 Days -47.2% Q2 2020 165 Days 5.1% Economists' note : Time to Sale is a measure of the length of the home selling process, calculated as the number of days between the initial listing of a property and the closing of the sale. Median Time to Sale is the amount of time the "middle" property selling this month was on the market. That is, 50% of homes selling this month took less time to sell, and 50% of homes took more time to sell. Median Time to Sale gives a more accurate picture than Average Time to Sale, which can be skewed upward by small numbers of properties taking an abnormally long time to sell. Economists' note : Like Time to Sale, Time to Contract is a measure of the length of the home selling process calculated for sales which closed during the quarter. The difference is that Time to Contract measures the number of days between the initial listing of a property and the signing of the contract which eventually led to the closing of the sale. When the gap between Median Time to Contract and Median Time to Sale grows, it is usually a sign of longer closing times and/or declining numbers of cash sales. Q4 2020 163 Days -35.3% Q3 2020 214 Days -7.0% Q2 2021 115 Days -30.3% Q1 2021 143 Days Q1 Q2 Q3 Q4 Q1 Q2 Q3 Q4 Q1 Q2 Q3 Q4 Q1 Q2 Q3 Q4 Q1 Q2 Q1 Q2 Q3 Q4 Q1 Q2 Q3 Q4 Q1 Q2 Q3 Q4 Q1 Q2 Q3 Q4 Q1 Q2 0 50 100 150 200 250 300 Median Time to Sale 0 50 100 150 200 Median Time to Contract Quarterly Market Detail - Q2 2023 2019 2020 2021 2022 Palm Beach Board of REALTORSĀ® Townhouses and Condos Median Time to Contract The median number of days between the listing date and contract date for all Closed Sales during the quarter 2019 2020 2021 2022 Median Time to Sale The median number of days between the listing date and closing date for all Closed Sales during the quarter
  • 6. This report describes member activity for the association and is not confined to any specific geographic area. Produced by Florida RealtorsĀ® with data provided by Florida's multiple listing services. Statistics for each month compiled from MLS feeds on the 15th day of the following month. Data released on Thursday, July 20, 2023. Next data release is Thursday, October 19, 2023. Economists' note : New Listings tend to rise in delayed response to increasing prices, so they are often seen as a lagging indicator of market health. As prices rise, potential sellers raise their estimations of valueā€”and in the most recent cycle, rising prices have freed up many potential sellers who were previously underwater on their mortgages. Note that in our calculations, we take care to not include properties that were recently taken off the market and quickly relisted, since these are not really new listings. Economists' note : Because of the typical length of time it takes for a sale to close, economists consider Pending Sales to be a decent indicator of potential future Closed Sales. It is important to bear in mind, however, that not all Pending Sales will be closed successfully. So, the effectiveness of Pending Sales as a future indicator of Closed Sales is susceptible to changes in market conditions such as the availability of financing for homebuyers and the inventory of distressed properties for sale. Quarter New Pending Sales Percent Change Year-over-Year Q2 2023 90 -16.7% Year-to-Date 216 -29.2% Q3 2021 113 -28.0% Q1 2023 126 -36.0% Q4 2022 63 -52.6% Q1 2022 197 -38.1% Q4 2021 133 -25.3% Q3 2022 41 -63.7% Q2 2022 108 -53.0% Q2 2021 230 125.5% Q1 2021 318 120.8% Q4 2020 178 87.4% Q3 2020 157 76.4% Q2 2020 102 -40.0% Quarter New Listings Percent Change Year-over-Year Q2 2023 121 -14.2% Q1 2023 198 10.6% Q4 2022 152 -4.4% Q3 2022 91 -26.0% 123 -39.4% Q2 2021 150 -16.7% Q2 2020 180 -1.6% Q1 2021 216 -14.3% Q4 2020 224 -16.7% Year-to-Date 319 -0.3% Q3 2020 203 23.0% Q2 2022 141 -6.0% Q1 2022 179 -17.1% Q4 2021 159 -29.0% Q3 2021 Q1 Q2 Q3 Q4 Q1 Q2 Q3 Q4 Q1 Q2 Q3 Q4 Q1 Q2 Q3 Q4 Q1 Q2 Q1 Q2 Q3 Q4 Q1 Q2 Q3 Q4 Q1 Q2 Q3 Q4 Q1 Q2 Q3 Q4 Q1 Q2 0 50 100 150 200 250 300 New Listings 0 50 100 150 200 250 300 350 Pending Sales Quarterly Market Detail - Q2 2023 2019 2020 2021 2022 Palm Beach Board of REALTORSĀ® Townhouses and Condos New Pending Sales The number of listed properties that went under contract during the quarter 2019 2020 2021 2022 New Listings The number of properties put onto the market during the quarter
  • 7. This report describes member activity for the association and is not confined to any specific geographic area. Produced by Florida RealtorsĀ® with data provided by Florida's multiple listing services. Statistics for each month compiled from MLS feeds on the 15th day of the following month. Data released on Thursday, July 20, 2023. Next data release is Thursday, October 19, 2023. Economists' note : There are a number of ways to define and calculate Inventory. Our method is to simply count the number of active listings on the last day of the quarter, and hold this number to compare with the same quarter the following year. Inventory rises when New Listings are outpacing the number of listings that go off- market (regardless of whether they actually sell). Likewise, it falls when New Listings aren't keeping up with the rate at which homes are going off-market. Economists' note : MSI is a useful indicator of market conditions. The benchmark for a balanced market (favoring neither buyer nor seller) is 5.5 months of inventory. Anything higher is traditionally a buyers' market, and anything lower is a sellers' market. There is no single accepted way of calculating MSI. A common method is to divide current Inventory by the most recent month's Closed Sales count, but this count is a usually poor predictor of future Closed Sales due to seasonal cycles. To eliminate seasonal effects, we use the 12- month average of monthly Closed Sales instead. YTD (Monthly Avg) 9.0 373.7% Quarter Months Supply Percent Change Year-over-Year Q2 2020 13.1 21.3% Q4 2020 9.0 -30.2% Q3 2020 11.0 Q2 2020 468 4.9% Q4 2020 381 -30.0% Q3 2020 408 -8.3% 3.8% Q2 2021 1.7 -87.0% Q1 2021 4.4 -61.7% Q4 2021 1.9 -78.9% Q3 2021 1.6 -85.5% Q2 2022 2.7 58.8% Q1 2022 1.6 -63.6% Q4 2022 6.4 236.8% Q3 2022 3.5 118.8% Q2 2023 9.0 233.3% Q1 2023 9.0 462.5% 221 -55.4% Q4 2021 118 -69.0% Q3 2021 107 -73.8% Q2 2021 112 -76.1% Q1 2021 27.1% Q2 2022 117 4.5% Q1 2022 91 -58.8% Q3 2022 136 Quarter Inventory Percent Change Year-over-Year Q2 2023 221 88.9% 244 147.7% YTD (Monthly Avg) Q1 2023 251 175.8% Q4 2022 208 76.3% Q1 Q2 Q3 Q4 Q1 Q2 Q3 Q4 Q1 Q2 Q3 Q4 Q1 Q2 Q3 Q4 Q1 Q2 Q1 Q2 Q3 Q4 Q1 Q2 Q3 Q4 Q1 Q2 Q3 Q4 Q1 Q2 Q3 Q4 Q1 Q2 0.0 2.0 4.0 6.0 8.0 10.0 12.0 14.0 Months Supply of Inventory 0 100 200 300 400 500 600 Inventory Quarterly Market Detail - Q2 2023 2019 2020 2021 2022 Palm Beach Board of REALTORSĀ® Townhouses and Condos Inventory (Active Listings) The number of property listings active at the end of the quarter 2019 2020 2021 2022 Months Supply of Inventory An estimate of the number of months it will take to deplete the current Inventory given recent sales rates
  • 8. This report describes member activity for the association and is not confined to any specific geographic area. Produced by Florida RealtorsĀ® with data provided by Florida's multiple listing services. Statistics for each month compiled from MLS feeds on the 15th day of the following month. Data released on Thursday, July 20, 2023. Next data release is Thursday, October 19, 2023. $600,000 - $999,999 126 Days 500.0% $1,000,000 or more 79 Days 259.1% Economists' note : Like Time to Sale, Time to Contract is a measure of the length of the home selling process calculated for sales which closed during the quarter. The difference is that Time to Contract measures the number of days between the initial listing of a property and the signing of the contract which eventually led to the closing of the sale. When the gap between Median Time to Contract and Median Time to Sale grows, it is usually a sign of longer closing times and/or declining numbers of cash sales. $150,000 - $199,999 (No Sales) N/A $200,000 - $249,999 12 Days 9.1% $250,000 - $299,999 $400,000 - $599,999 19 Days 137.5% (No Sales) N/A $300,000 - $399,999 51 Days -7.3% Economists' note: Closed Sales are one of the simplestā€”yet most importantā€”indicators for the residential real estate market. When comparing Closed Sales across markets of different sizes, we recommend comparing the percent changes in sales rather than the number of sales. Closed Sales (and many other market metrics) are affected by seasonal cycles, so actual trends are more accurately represented by year-over-year changes (i.e. comparing a quarter's sales to the amount of sales in the same quarter in the previous year), rather than changes from one quarter to the next. Sale Price Median Time to Contract Percent Change Year-over-Year Less than $50,000 (No Sales) N/A $1,000,000 or more 66 -22.4% $250,000 - $299,999 0 -100.0% $300,000 - $399,999 9 200.0% $50,000 - $99,999 7 Days N/A $100,000 - $149,999 $400,000 - $599,999 7 -66.7% $600,000 - $999,999 19 -20.8% (No Sales) N/A $150,000 - $199,999 0 -100.0% $200,000 - $249,999 2 100.0% $100,000 - $149,999 0 -100.0% Sale Price Closed Sales Percent Change Year-over-Year Less than $50,000 0 N/A $50,000 - $99,999 1 N/A 0 20 40 60 80 100 120 140 Less than $50,000 $50,000 - $99,999 $100,000 - $149,999 $150,000 - $199,999 $200,000 - $249,999 $250,000 - $299,999 $300,000 - $399,999 $400,000 - $599,999 $600,000 - $999,999 $1,000,000 or more Median Time to Contract Q2 2022 Q2 2023 0 20 40 60 80 100 120 140 0 10 20 30 40 50 60 70 80 90 Less than $50,000 $50,000 - $99,999 $100,000 - $149,999 $150,000 - $199,999 $200,000 - $249,999 $250,000 - $299,999 $300,000 - $399,999 $400,000 - $599,999 $600,000 - $999,999 $1,000,000 or more Closed Sales Q2 2022 Q2 2023 0 10 20 30 40 50 60 70 80 90 Quarterly Market Detail - Q2 2023 Palm Beach Board of REALTORSĀ® Townhouses and Condos Closed Sales by Sale Price The number of sales transactions which closed during the quarter Median Time to Contract by Sale Price The median number of days between the listing date and contract date for all Closed Sales during the quarter
  • 9. This report describes member activity for the association and is not confined to any specific geographic area. Produced by Florida RealtorsĀ® with data provided by Florida's multiple listing services. Statistics for each month compiled from MLS feeds on the 15th day of the following month. Data released on Thursday, July 20, 2023. Next data release is Thursday, October 19, 2023. $600,000 - $999,999 39 178.6% $1,000,000 or more 142 79.7% Economists' note : There are a number of ways to define and calculate Inventory. Our method is to simply count the number of active listings on the last day of the quarter, and hold this number to compare with the same quarter the following year. Inventory rises when New Listings are outpacing the number of listings that go off- market (regardless of whether they actually sell). Likewise, it falls when New Listings aren't keeping up with the rate at which homes are going off-market. $150,000 - $199,999 1 0.0% $200,000 - $249,999 0 N/A $250,000 - $299,999 3 N/A $300,000 - $399,999 6 -14.3% $400,000 - $599,999 29 107.1% $50,000 - $99,999 0 N/A $100,000 - $149,999 1 -50.0% Current Listing Price Inventory Percent Change Year-over-Year Less than $50,000 0 N/A $600,000 - $999,999 22 4.8% $1,000,000 or more 73 -13.1% Economists' note: New Listings tend to rise in delayed response to increasing prices, so they are often seen as a lagging indicator of market health. As prices rise, potential sellers raise their estimations of valueā€”and in the most recent cycle, rising prices have freed up many potential sellers who were previously underwater on their mortgages. Note that in our calculations, we take care to not include properties that were recently taken off the market and quickly relisted, since these are not really new listings. $150,000 - $199,999 1 N/A $200,000 - $249,999 1 0.0% $250,000 - $299,999 2 100.0% $300,000 - $399,999 3 -76.9% $400,000 - $599,999 18 -14.3% $50,000 - $99,999 1 N/A $100,000 - $149,999 0 N/A Initial Listing Price New Listings Percent Change Year-over-Year Less than $50,000 0 N/A 0 20 40 60 80 100 120 140 160 Less than $50,000 $50,000 - $99,999 $100,000 - $149,999 $150,000 - $199,999 $200,000 - $249,999 $250,000 - $299,999 $300,000 - $399,999 $400,000 - $599,999 $600,000 - $999,999 $1,000,000 or more Inventory Q2 2022 Q2 2023 0 20 40 60 80 100 120 140 160 0 10 20 30 40 50 60 70 80 90 Less than $50,000 $50,000 - $99,999 $100,000 - $149,999 $150,000 - $199,999 $200,000 - $249,999 $250,000 - $299,999 $300,000 - $399,999 $400,000 - $599,999 $600,000 - $999,999 $1,000,000 or more New Listings Q2 2022 Q2 2023 0 10 20 30 40 50 60 70 80 90 Quarterly Market Detail - Q2 2023 Palm Beach Board of REALTORSĀ® Townhouses and Condos New Listings by Initial Listing Price The number of properties put onto the market during the quarter Inventory by Current Listing Price The number of property listings active at the end of the quarter
  • 10. This report describes member activity for the association and is not confined to any specific geographic area. Closed Sales Median Sale Price Closed Sales Median Sale Price Closed Sales Median Sale Price Produced by Florida RealtorsĀ® with data provided by Florida's multiple listing services. Statistics for each month compiled from MLS feeds on the 15th day of the following month. Data released on Thursday, July 20, 2023. Next data release is Thursday, October 19, 2023. Short Sale 0 0 N/A (No Sales) (No Sales) N/A Foreclosure/REO 0 0 N/A (No Sales) (No Sales) N/A Q2 2023 Q2 2022 Percent Change Year-over-Year Traditional 104 141 -26.2% $1,525,000 $1,275,000 19.6% $0 $200,000 $400,000 $600,000 $800,000 $1,000,000 $1,200,000 $1,400,000 $1,600,000 $1,800,000 Median Sale Price 0% 10% 20% 30% 40% 50% 60% 70% 80% 90% 100% Closed Sales Traditional Foreclosure/REO Short Sale 2019 2020 2021 2022 Q1 Q2 Q3 Q4 Q1 Q2 Q3 Q4 Q1 Q2 Q3 Q4 Q1 Q2 Q3 Q4 Q1 Q2 Q1 Q2 Q3 Q4 Q1 Q2 Q3 Q4 Q1 Q2 Q3 Q4 Q1 Q2 Q3 Q4 Q1 Q2 Quarterly Distressed Market - Q2 2023 Palm Beach Board of REALTORSĀ® Townhouses and Condos 2019 2020 2021 2022