An Analysis of Indian Commercial Dynamism in International Trade: 2000-2021

The study first looks at the fundamentals of growth rate, trade balance, coverage rate, openness rate, and the share of global indicators before presenting each of them in more detail. It thus assesses India's overall commercial dynamism. A thorough analysis is made using data gathered from the World Bank's databank in order to carry out this study. An analysis of time series data is performed using data from 2000 to 2021. MS Excel is then used to analyze the data and provide a suitable interpretation. The results show that India has an average growth rate of 12.16 for imports and 12.02 for exports, a deficit trade balance over the years, a coverage rate that ranges from 78.49 (2012) to 97.97 (2020), trade openness that ranges from 26 (2001) to 56 (2012) percent, and a total global market share of 2.52 (2021) and 0.79. (2000). Researchers, other stakeholders in the field, and policymakers in nearby countries, specifically mentioning Bangladeshi, Pakistani, Myanmar and Indian governments, could all benefit from this study's findings.

Recommended
Recommended
More Related Content
Similar to An Analysis of Indian Commercial Dynamism in International Trade: 2000-2021
Similar to An Analysis of Indian Commercial Dynamism in International Trade: 2000-2021 (20)
More from Samsul Alam
More from Samsul Alam (17)
Recently uploaded
Recently uploaded (20)
An Analysis of Indian Commercial Dynamism in International Trade: 2000-2021
- 1. 179 An Analysis of Indian Commercial Dynamism in International Trade: 2000-2021 * Samsul Alam, Begum Rokeya University, Rangpur Repon Miah, Daffodil International University Rasheda Akter Rupa, Ahsanullah University of Science and Technology E-mail: alam@mis.brur.ac.bd Abstract: The study first looks at the fundamentals of growth rate, trade balance, coverage rate, openness rate, and the share of global indicators before presenting each of them in more detail. It thus assesses India's overall commercial dynamism. A thorough analysis is made using data gathered from the World Bank (WB)'s databank in order to carry out this study. An analysis of time series data is performed using data from 2000 to 2021. MS Excel is then used to analyze the data and provide a suitable interpretation. The results show that India has an average growth rate of 12.16 for imports and 12.02 for exports, a deficit trade balance over the years, a coverage rate that ranges from 78.49 (2012) to 97.97 (2020), trade openness that ranges from 26 (2001) to 56 (2012) percent, and a total global market share of 2.52 (2021) and 0.79. (2000). Researchers, other stakeholders in the field, and policymakers in nearby countries, specifically mentioning Bangladeshi, Pakistani, Myanmar and Indian governments, could all benefit from this study's findings. Keywords: Commercial dynamism, Export-import analysis, India, International trade, Time-series data JEL Classification: F1, O2, O4 1. Introduction Globalization has increased collaboration and communication among various nations. International trading is also a byproduct of globalization which leads to enhancing economic affiliation with other countries of the world (Khandare, 2011). Most nations are allowing the free movement of goods and services across their national borders. Ensuring trade balance is the fundamental aim for all nations taking part in international trading, as ------------------------------ *Corresponding Author
- 2. An Analysis of Indian Commercial Dynamism in International.................... 180 trade balance is the reflection of the collective effects of other macroeconomic policies of the country (Uddin, 2009). India is a growing economy (Raghuramapatruni, 2014). It is one of the prominent nations in the world with a large population and economic prospects (World Bank, 2018). In recent years, its economic growth has accelerated. The real Gross Domestic Product (GDP) was U.S. dollar 2,013.3 billion in 2018-19 fiscal year (WTO, 2020). There was a prominent increase in export after liberalization. This trend continues to increase for some other years. After that, it started to decline (Chakrabarty & Chakravarty, 2012). The average real GDP growth was 7.4% from 2013-14 to 2018-19 (WTO, 2020). The per capita income was U.S. dollar 5,464.9 in 2015, which rose to 7,333.5 in 2021 (World Bank, 2022). Although the country is performing well in various economic parameters, Covid-19 has restricted the form of the economy (Phelps, 2008). Due to Covid-19 and frequent lockdowns, there has been a significant negative impact on international trading. The shutdown of workplaces negatively affected trading of durable goods (Hayakawa & Mukunoki, 2021). On the contrary, the inflation rate has increased significantly. In 2015, the inflation rate was 2.3%, while in 2021, it becomes 9.6%. (World Bank, 2022). However, India is performing well in various economic parameters showing consistent growth in trade. Such growth demand dynamism in trades and commercial activities. Dynamism requires a blending of economic policies in international trade and economic activities (Phelps, 2008). Dynamism is a measure of sustainable economic growth. During Covid-19, the dynamism of various nations has reshaped significantly (Agresti et al., 2022). After Upender's (2007) study on India’s export- import equilibrium from 1949-2005, no likely study is found that focused on India’s international trade nature of dynamism. Therefore, based on the discussion, the authors tend to seek the answer to the following question: How dynamic the international trade of India is, and what affects this dynamism pattern over time? Thus, the study aims at representing the commercial dynamism of India. Specifically, the authors show the ins and outs of Indian patterns of commercial dynamism in various aspects and compare the performance
- 3. ISSN 2664-3413 (Print) 2664-3421 (Online) Daffodil International University Journal of Business and Entrepreneurship Vol. 16 No. 1 PP. 179-200 June 2023 181 year to year. As a result, this study will provide necessary ideas about the dynamism of trade and trade policies of India to policymakers, researchers, economists, and various government agencies. Next, this study is divided into several parts. In the first part, relevant literature has been reviewed and presented briefly. The second part covers the analysis of commercial dynamism in India using various charts, graphs, and tables of relevant data. Finally, the last part reflects some recommendations for policymakers regarding international trade in India. 2. Literature Review International trade expedites the flow of goods and services across borders and greatly boosts the countries' GDP (Poon & Rigby, 2017). Chakrabarty and Chakravarty (2012) state that international trade is one of the major elements of the growth of a nation. Taylor and Smith (2007) emphasize international trade as it leads to expanding existing markets, adopting new technologies, and developing efficient production processes. Phelps (2008) defines commercial dynamism as the appropriate mixture of economic policies of a country. Technological advancement and a well-planned bureaucratic system contribute to commercial dynamism (Phelps, 2008). Decker et al. (2016) emphasize business companies' formation, growth, expansion, and contract to ensure dynamism in commercial activities. Agresti et al. (2022) use the term business dynamism to reflect the sustainable growth of a nation. They define it as the number of new firms entering a market and leave from the market. Trading and sharing of economic interests strive to improve dynamism among countries through enhancing trade and exchanges (Agresti et al., 2022). In the USA, the speed with which new firms enter the market and old ones leave the market, and the pace with which new employment opportunities are created are the measures of commercial dynamism for that country. The creativity and innovation in starting a new business and creating opportunities for others make the economy more dynamic than ever (Decker et al., 2014). The commercial dynamism of India has been investigated by Anoopkumar (2014). In that study, the author focuses on the crops market and price stability as the major agent of dynamism in that market. The revenue for the farmers from the crops market is unstable due to changes in price in the market. Trading and sharing of economic interests strive to improve dynamism among countries through enhancing trade and exchanges. The interconnection of commercial interests between
- 4. An Analysis of Indian Commercial Dynamism in International.................... 182 Chain and Taiwan has enhanced the economic dynamism of both countries (Sutter, 2002). Trade needs to determine the growth factors and drivers as well as to separate the growth barriers to international trade (Loungani et al., 2017). Usually, countries try to get a comparative advantage in international trade by exporting quite similar products. There are inherent reasons for such composition. The use of similar technologies is one of the reasons. Interconnectivity among product mixing provides benefits of comparative advantages in product space. The availability of materials and capabilities of production determine nations exporting the products (Hausmann & Klinger, 2007). Carrasco and Tovar-García (2021) conducted a study using panel data from 19 developing countries to assess the role of export and import composition in economic development. They found that the impact of such composition on development is insignificant. Utkulu and Seymen (2004) conducted a study using Revealed Comparative Advantage (RCA) indices to examine Turkey's competitiveness and the sectoral patterns of trade flows and trade specialization with the EU. Turkey gets a competitive edge for seven products out of 63 product groups. Assadzadeh et al. (2013) also studied the comparative competitiveness in the clothing industry of Turkey and Iran using RCA to compare Turkey and Iran's textile and apparel sectors' competitiveness. According to the findings, Turkey maintains a comparative advantage over Iran in the markets for textiles and apparel (Assadzadeh et al. 2013). Akgüngör et al. (2002) also evaluated the trade pattern of Turkey especially focusing on the trade policies of the fruit and vegetable industries. They found that Turkey’s performance is far better than Greece, Spain, and Portugal's in the EU market. Raghuramapatruni (2014) studied the trade pattern of India in comparison to China applying Trade Intensity Index (TII) and Modified TII. It has been found that China and India are the two economic engines of the world, having skilled manpower and production processes. Both countries complement each other in sharing factors of production. The interdependence and agreement between these two counties made them a giant in the global marketplace (Raghuramapatruni, 2014). Upender (2007) studied the long-term equilibrium between the import and export of India from 1949-50 to 2004-05. They discovered that import and export are co- integrated based on root unit tests, co-integration, and error correction models. It indicates that there is a significant relationship between export
- 5. ISSN 2664-3413 (Print) 2664-3421 (Online) Daffodil International University Journal of Business and Entrepreneurship Vol. 16 No. 1 PP. 179-200 June 2023 183 and import. Although there is slight disequilibrium between India’s imports and exports, economic reformation during 1992 has contributed a lot to reducing that disequilibrium. The study revealed a bidirectional relationship between export and import from a long-term perspective (Uddin, 2009). From the literature, it is obvious that no study specifically analyzes the commercial dynamism of Indian international trade. This instigates the authors' conduct of the current study. In this study, the writers examine the basics of growth rate, trade balance, coverage rate, openness rate, and share of world indicators before analyzing the commercial dynamism of India and presenting each of them in depth. 3. Methodology To achieve the study objective, the authors use time series data analysis. It is regarded as one of the major ways to evaluate the commercial dynamism of a country. For example, Uddin (2009) applied time series analysis to assess the international trade behavior of a developing country like Bangladesh. The authors conduct a quantitative study on the dynamic nature of international trade in India. Various charts, graphs, and tables have been prepared to analyze the statistical databases of the WB, which are considered primary data. The data considered are from a time series starting from 2000 through 2021. The data are placed into the mathematically based recognized formulae already applied in determining indicators of a country’s dynamic nature in international trade, e.g., growth rate, trade balance, coverage rate, export propensity, openness rate, share in world exports, imports, and total trade. The sources of collecting the data are the databank of the WB, which are reposited publicly available in the database. A total of 21 years, starting from 2000 through 2021, is considered a series of times. On the other hand, different secondary published sources have been analyzed to assess the trade policies of the country. These data are collected from journals, conference proceedings, reports, website servers, etc. Table 1 shows all the relevant data useful in conducting this study.
- 6. An Analysis of Indian Commercial Dynamism in International.................... 184 Table 1: India's Year-Over-Year Trade Data, Including Coverage and Openness Rates Yea r India Export (U.S. dollar in billion) India Import (U.S. dollar in billion) India GDP (U.S. dollar in billion) World Exports (U.S. dollar in billion) World Imports (U.S. dollar in billion) World GDP (U.S. dollar in billion) 200 0 60.88 65.12 468.39 8,032.68 8,005.77 33,830.8 8 200 1 60.96 65.22 485.44 7,781.99 7,798.78 33,615.4 4 200 2 73.45 78.50 514.94 8,172.33 8,100.60 34,911,4 3 200 3 90.84 95.07 607.70 9,462.66 9,387.15 39,146.9 9 200 4 126.65 139.31 709.15 11,493.71 11,365.36 44,117.6 0 200 5 160.84 183.74 820.38 13,065.70 12,892.76 47,779.7 1 200 6 199.97 229.96 940.26 15,058.64 14,748.54 51,779.8 5 200 7 253.08 302.80 1,216.74 17,509.11 17,100.97 58,355.0 1 200 8 288.90 350.93 1,198.90 20,000.60 19,605.07 64,123.7 0 200 273.75 347.18 1,341.89 16,124.80 15,756.16 60,809.1
- 7. ISSN 2664-3413 (Print) 2664-3421 (Online) Daffodil International University Journal of Business and Entrepreneurship Vol. 16 No. 1 PP. 179-200 June 2023 185 Yea r India Export (U.S. dollar in billion) India Import (U.S. dollar in billion) India GDP (U.S. dollar in billion) World Exports (U.S. dollar in billion) World Imports (U.S. dollar in billion) World GDP (U.S. dollar in billion) 9 1 201 0 375.35 449.97 1,675.62 19,243.64 18,675.28 66,596.0 5 201 1 447.38 566.67 1,823.05 22,681.80 22,023.77 73,853.7 8 201 2 448.40 571.31 1,827.64 23,009.87 22,278.92 75,488.0 6 201 3 472.18 527.56 1,856.72 23,591.38 22,843.16 77,607.2 0 201 4 468.35 529.24 2,039.13 23,958.19 23,341.46 79,708.8 1 201 5 416.79 465.10 2,103.59 21,304.88 20,753.07 75,179.2 7 201 6 439.64 480.17 2,294.80 20,896.16 20,354.34 76,465.5 9 201 7 498.26 582.02 2,651.47 23,000.93 22,401.35 81,403.9 8 201 8 538.64 639.01 2,702.93 25,185.95 24,629.11 86,413.0 3 201 9 529.24 602.31 2,831.55 24,733.87 24,287.87 87,652.8 6
- 8. An Analysis of Indian Commercial Dynamism in International.................... 186 Yea r India Export (U.S. dollar in billion) India Import (U.S. dollar in billion) India GDP (U.S. dollar in billion) World Exports (U.S. dollar in billion) World Imports (U.S. dollar in billion) World GDP (U.S. dollar in billion) 202 0 499.10 509.43 2,667.69 22,361.52 21,709.87 84,906.8 1 202 1 660.50 725.55 3173.40 27,926.60 26,982.56 96,100.0 9 Source: Authors’ Construction 4. Results and Discussion The results and discussion are explained in details in this section in several subsections. 4.1. Trade Analysis of India This section calculates several aspects of India's global trade dynamism based on its exports of commodities and services, imports of goods, and the country's and the world's GDP. These terms and their descriptions are elaborated in subsequent subsections from the WB perspective (i.e., the currency used for the data is the current dollar), as the data are considered from the WB data repository. All transactions involving a transfer of ownership of general commodities, net exports of items under merchanting, non-monetary gold, and services from citizens of a country to the rest of the world are considered exports of goods and services. All movable goods that are engaged in a transfer of ownership from non- residents to residents are referred to as goods imports, including non- monetary gold. The gross value contributed by all resident producers in the economy, along with any applicable product taxes and any subsidies not reflected in the value of the goods themselves, is what is referred to as the GDP at the purchaser's prices. It is estimated without taking into account natural resource deterioration or the depreciation of manufactured assets. GDP data are translated to the dollar from local currencies using
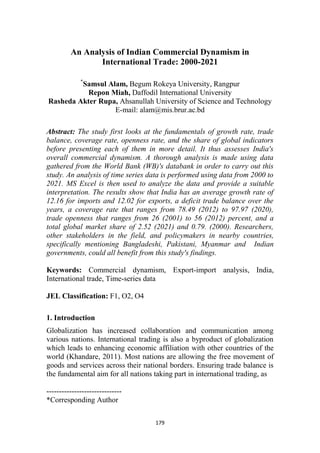
- 9. ISSN 2664-3413 (Print) 2664-3421 (Online) Daffodil International University Journal of Business and Entrepreneurship Vol. 16 No. 1 PP. 179-200 June 2023 187 official exchange rates for one year. There are a few nations where an alternate conversion factor is utilized since the official exchange rate does not accurately represent the rate that is actually applied to actual foreign exchange transactions. 4.1.1. Average Growth Rate The average growth rate shows the rate of increase India experienced during the research period. It is calculated in the following way: Equation 1. The formula for the growth rate on average of India Average growth rate of export/import = {(Latest Year Value/Past Year Value)(1/21) -1}×100 India's exports of products and services have grown at an average annual rate of 12.02% over the past 21 (2000-2021) years, showing that the country has increased its exports every year. The average rate of import growth during the course of the study was 12.16 percent, indicating good growth in imports as well. However, if we look at the growth rates of imports and exports, we can see that India has increased both in terms of imports and exports, meaning that its growth rate is positive. This leads us to believe that India has been showing a surplus in its current economy and that its dynamism is focused on the exporting side (See Figure 1). Figure 1: India's Average Growth Rate Source: Authors’ Construction 12.16 12.02 Import Export
- 10. An Analysis of Indian Commercial Dynamism in International.................... 188 4.1.2. Trade Balance The trade balance, which is the gap between India's exports and imports, was discovered throughout the course of the 21-year investigation. It is calculated in the following way: Equation 2. The formula for the trade balance of India Balance of Trade (BOT) = Value of Exports − Value of Imports The authors discover from Figure 2 that the trade balance of India has been negative for each of the financial years used for the analysis. Indicators show that India has had a long-standing trade deficit. Since India's economy had economic instability that insufficient GDP, the rising buyer purchasing power, and people's quality of life, a trade deficit occurs as the trade balance encounters a negative value. In 2003, there was the lowest trade deficit of U.S. dollar 4.23 billion. On the other hand, 2012 experienced the highest deficit of U.S. dollar 122.91 billion in international trade. Surprisingly, after a consecutive decline in the trade deficit from 2012, it rose from 2017 through 2018. Though 2020 enjoyed a lower deficit of U.S. dollar 10.33 billion, 2021 faced again higher one (U.S. dollar 65.05 billion). When India's deficit was reduced, the country's economy was stable enough to support growth in GDP, allowing it to export a sizeable sum that was significantly larger than in any of the prior years while also incurring fewer costs than in prior years. Figure 2: The Trade Balance of India Source: Authors’ Construction -150 -100 -50 0 2000 2001 2002 2003 2004 2005 2006 2007 2008 2009 2010 2011 2012 2013 2014 2015 2016 2017 2018 2019 2020 2021 Trade Balance (U.S. dollar in billion)
- 11. ISSN 2664-3413 (Print) 2664-3421 (Online) Daffodil International University Journal of Business and Entrepreneurship Vol. 16 No. 1 PP. 179-200 June 2023 189 4.1.3. Coverage Rate The capacity of exports to finance imports is known as the coverage rate. If the outcome is more than 100, it means that any country's exports may fully finance its imports while still having a trade surplus. It means that the higher, the better. On the contrary, it suffers a trade deficit. The coverage rate is calculated in the following way: Equation 3. The formula for the coverage rate of India Coverage rate = (Exports/Imports) × 100 Table 2: The Year-Wise Coverage Rate of India Year Coverage Rate Year Coverage Rate 2000 93.48 2011 78.95 2001 93.48 2012 78.49 2002 93.57 2013 89.50 2003 95.55 2014 88.49 2004 90.91 2015 89.61 2005 87.54 2016 91.56 2006 86.96 2017 85.61 2007 83.58 2018 84.29 2008 82.33 2019 87.87 2009 78.85 2020 97.97 2010 83.42 2021 91.03 Source: Authors’ Construction Table 2 displays the results of India's coverage rate over time. It is observed that not a single financial year of India could afford the imports completely. Since there was volatility, all imports showed a trade imbalance in the balance of payments. However, every year, there was
- 12. An Analysis of Indian Commercial Dynamism in International.................... 190 variation in the coverage rate, where the highest trade deficit was seen in FY 2012 (21.51). Besides, FY 2009 and 2011 have a coverage rate below 80. Conversely, the lowest trade deficit indicating the highest coverage rate was found in FY 2020 (2.03), which is nearly 100% of the coverage rate. Other FYs that have a coverage rate up 90 are 2000-2004, 2006, and 2021. The remaining FYs have a coverage rate between the highest and lowest figure. From Figure 3, it is depicted that India has a comparatively higher growth in coverage rate after FY 2012 the trade balance is becoming shortened. However, from 2000 to 2004, it was higher in comparison with FY 2009 to 2012. In many instances, India can serve as a model for nations attempting to achieve trade balance and surpluses, particularly for Asia's fast-growing nations. Figure 3: The Coverage Rate of India Source: Authors’ Construction 4.2. Tools for Measuring Trade Openness The following discussions pertain to tools for trade openness. 4.2.1. Export Propensity The export to GDP ratio is known as the export propensity. It differentiates the elements that affect whether or not subsidiaries export. It is calculated in the following way: 93.48 93.48 93.57 95.55 90.91 87.54 86.96 83.58 82.33 78.85 83.42 78.95 78.49 89.50 88.49 89.61 91.56 85.61 84.29 87.87 97.97 91.03 C OVE RA GE RA T E COVERAGE RATE 2000 2001 2002 2003 2004 2005 2006 2007 2008 2009 2010 2011 2012 2013 2014 2015 2016 2017 2018 2019 2020 2021
- 13. ISSN 2664-3413 (Print) 2664-3421 (Online) Daffodil International University Journal of Business and Entrepreneurship Vol. 16 No. 1 PP. 179-200 June 2023 191 Equation 4. The formula for the export propensity to India Export propensity = (Exports/GDP) × 100 For the study's FYs, the export tendency is shown in Table 3. According to the table, India had the highest export propensity in 2013 (25.43). 2001 is the year with the lowest export propensity (12.56). It is also discovered that the export tendency of previous years is variable. Although growth is constant, the inclination to export is slightly increasing in some FYs. In comparison to other developing nations, India has a respectable export inclination. It is also discovered that the export tendency of previous years is variable. In comparison to other developing nations, India's export inclination is not too awful. Table 3: India's Annual Propensity to Export Year Propensity to export Year Propensity to export 2000 13.00 2011 24.54 2001 12.56 2012 24.53 2002 14.26 2013 25.43 2003 14.95 2014 22.97 2004 17.86 2015 19.81 2005 19.61 2016 19.16 2006 21.27 2017 18.79 2007 20.80 2018 19.93 2008 24.10 2019 18.69 2009 20.40 2020 18.71 2010 22.40 2021 20.81 Source: Authors’ Construction 4.2.2. Trade Openness Rate The openness index gauges a nation's level of economic openness. It refers, in other words, to the extent to which a nation can sell its products and services to the rest of the world. The ratio of total imports to total
- 14. An Analysis of Indian Commercial Dynamism in International.................... 192 exports to GDP is used to measure the degree of trade openness. The greater the openness rate, the more dependent the country or economic zone is on foreign trade. When the outcome tends toward "0," the country being studied has little or no trade with other nations. When the outcome approaches toward "100," the majority of what is produced is exported, and no contribution of domestic goods is provided to satisfy the demands of domestic consumers. It is calculated in the following way: Equation 5. The formula for the trade openness rate of India Trade openness rate = (Exports+Imports)/GDP}×100 Figure 4: Rate of Trade Openness Source: Authors’ Construction Figure 4 illustrates the percentages of openness in India for different FYs. Over the past 21 years, India's overall trade has fluctuated, ranging from 26% (in 2001) to 56%. (2012). From FY 2001 through 2007, there was a growing rate of trade liberalization, where a sudden fall was observed in 2009 that rate again started rising in 2012. Afterward, it goes through ups and downs rate. The percentage of domestic products intended for the domestic market increased from 38% in 2020 to 44% in 2021 as a result of the growing demands of the Indian populace. As one of the largest nations in the world and a producer of a wide range of goods, the chart depicts that India's openness rate varies, and the conclusion that follows suggests that the nation is somewhat dependent on foreign trade. However, domestic 0 10 20 30 40 50 60 2000 2001 2002 2003 2004 2005 2006 2007 2008 2009 2010 2011 2012 2013 2014 2015 2016 2017 2018 2019 2020 2021 Openness Trade
- 15. ISSN 2664-3413 (Print) 2664-3421 (Online) Daffodil International University Journal of Business and Entrepreneurship Vol. 16 No. 1 PP. 179-200 June 2023 193 production falls short of entirely satisfying the needs of the entire population. India does not generate all the goods its residents require, just as no other nation does so adequately. 4.3. World Trade Participation Indicators Figure 5 shows that from 2000 to 2008, India's exports and imports both increased quickly over that period. However, due to the unstable economy in 2009, both indexes abruptly decreased. Once more, after that time, they began to rise, and this trend persisted up until 2012. Imports abruptly decreased and exports steadily increased after 2012, pointing to a strong economic climate where the trade imbalance is at a minimum. After FY 2015 and 2016, both the exports and imports started rising; imports got more growth. The growth stopped in FY 2018 after when the indicators again fell down. In 2020, the decline in exports and imports. Nevertheless, they reached the peak of the figure in both indicators. In other words, India has gained prominence in global commerce (competitiveness) while contributing a sizable amount to it. Figure 5: India's Imports and Exports Source: Authors’ Construction The following metrics assess the flexibility and adaptation of India's dynamic economic growth and global trade, as indicated in Table 4. 2000 2001 2002 2003 2004 2005 2006 2007 2008 2009 2010 2011 2012 2013 2014 2015 2016 2017 2018 2019 2020 2021 Exports of India Imports of India
- 16. An Analysis of Indian Commercial Dynamism in International.................... 194 According to the table, India has a considerable share in both the indicators of exports and imports comparing other developing countries in the world. Table 4: Comparison of India's Export and Import Data by Year Year % World Export % World Import % World Trade 2000 0.758 0.81 0.79 2001 0.783 0.84 0.81 2002 0.899 0.97 0.93 2003 0.960 1.01 0.99 2004 1.102 1.23 1.16 2005 1.231 1.43 1.33 2006 1.328 1.56 1.44 2007 1.445 1.77 1.61 2008 1.444 1.79 1.62 2009 1.698 2.20 1.95 2010 1.951 2.41 2.18 2011 1.972 2.57 2.27 2012 1.949 2.56 2.25 2013 2.001 2.31 2.15 2014 1.955 2.27 2.11 2015 1.956 2.24 2.10 2016 2.104 2.36 2.23 2017 2.166 2.60 2.38 2018 2.139 2.59 2.36 2019 2.140 2.48 2.31 2020 2.232 2.35 2.29 2021 2.365 2.69 2.52 Source: Authors’ Construction
- 17. ISSN 2664-3413 (Print) 2664-3421 (Online) Daffodil International University Journal of Business and Entrepreneurship Vol. 16 No. 1 PP. 179-200 June 2023 195 4.3.1. Share of World Exports Indian exports are currently concentrated in the United States of America (USA), China, the United Arab Emirates (UAE), Hong Kong, Germany, and other nations, according to the OEC country profile. The exporting goods of India involve a number of products, including refined petroleum, packaged medicaments, diamonds, rice, and Jewelry (Figure 6). This indicator's objective is to display India's share of global exports as a percentage. It is calculated in the following way: Equation 6. The formula for India’s share of world exports Share of India’s exports to world exports = (Exports of India/Exports of World)×100 The percentage of India's exports of goods and services to the global market is shown in Table 4. According to the data, the lowest share (0.76%) was discovered in 2000, while the largest participation (2.37%) was discovered in 2021. 4.3.2. Share of World Imports Based on data from the OEC country profile, the sourcing countries for imports of Indians are mainly China, the United States of America (USA), the United Arab Emirates (UAE), Saudi Arabia, Iraq, and other countries. The importing goods include a variety of products, likely crude petroleum, gold, coal briquettes, diamonds, and petroleum gas (Figure 6). The goal of the share of world imports is to determine what proportion of global imports are made by India. It is calculated in the following way: Equation 7. The formula for India’s share of world imports Share of India’s imports to world imports = (Imports of India/Imports of World)×100 According to Table 4, the percentages in various years demonstrate that involvement ranges from 0.79 in 2000 to 2.52 in 2021.
- 18. An Analysis of Indian Commercial Dynamism in International.................... 196 4.3.3. Share of World Total Trade This indicator compares India's imports and exports of goods and services to those of the rest of the world. India's top exports in terms of global trade include mineral fuels and oils, natural or cultured pearls, automobiles, nuclear reactors, organic chemicals, pharmaceuticals, cereals, electrical machinery, cotton, iron and steel, clothing and clothing accessories, plastic, fish and crustaceans, aircraft, meat, textile products, ships, and various other items. Contrarily, the primary imports into India include petroleum, gold, silver, electronics, pearls, and precious stones (Figure 6). The share of the world’s total trade is calculated in the following way: Equation 8. The formula for India’s share of total trade Share of India’s total trade to world’s total trade = {(Exports of India+Imports of India)/Exports of World+Imports of World)}×100 However, the exporting side of the study country's global share of total trade in figure 6 is important since it demonstrates that M>X over the course of 21 years. It is also seen that all three indications, including share of the world exports, imports, and total trade, are in growing condition meaning the positiveness in India’s participation in international trade. India's overall market share was at its best in 2021 (2.52) and at its lowest in 2000 (0.79). Figure 6: India's Involvement in Global Trade Source: Authors’ Construction 0.760.780.900.961.101.231.331.451.441.701.951.971.952.001.951.962.102.172.142.142.232.37 0.810.840.971.011.231.431.561.771.79 2.20 2.412.572.562.312.272.242.362.602.592.482.35 2.69 0.790.81 0.930.99 1.16 1.33 1.44 1.611.62 1.95 2.182.272.252.152.112.10 2.23 2.382.362.312.29 2.52 0.00 1.00 2.00 3.00 4.00 5.00 6.00 7.00 8.00 Share of World Exports Share of World Imports Share of World Total Trade
- 19. ISSN 2664-3413 (Print) 2664-3421 (Online) Daffodil International University Journal of Business and Entrepreneurship Vol. 16 No. 1 PP. 179-200 June 2023 197 5. Recommendations and Conclusion In a nutshell, this study shows what the commercial dynamism of India looks like and gives a standpoint to be conscious of for further growth. All the indicators mentioned here, including trade analysis, trade openness, and participation in the world market, are good measures of the dynamic nature of international trade for a country. As a result, policymakers get a clear snapshot of what to do for further improvement at a particular indicator. Though the study does not seek any innovation, the findings are helpful for stakeholders to think and rethink rebuilding the nature of commercial dynamism where barriers exist. At the same time, the respective personnel must keep up the good job. Some barriers work as the bottleneck to higher growth in international trade for India. For the purpose of corrective action, structural bottlenecks (such as slow project approval, poorly targeted subsidies, a lack of manufacturing capacity and agricultural productivity, difficulty acquiring land, a deficient transportation infrastructure, inadequate power supplies, and stringent labor laws and skill gaps) should be kept in mind. Governmental organizations must invest in infrastructure and education, simplify the business environment by reducing overregulation, and improve trade and investment regime predictability in order to address these bottlenecks. 6. Limitation and Future Research Direction The main limitation of this study is not to consider all the time series data available in the database though data prior to the year 2000 is not much feasible to include in this study. Other limitations include scarcity of related studies published in reputed journals, not considering the expert opinion, and not being compared with countries having almost similar economic profiles. It is the scope for future researchers to do studies on a comprehensive data analysis considering the limitations prevailing in this current study. When doing so, other important factors that also affect commercial dynamism for India should be taken into consideration, like sectoral patterns, geographical patterns, etc. Other researchers may consider other countries taking this study as a replication to show that country’s commercial dynamism nature. In this case, a similar study can be conducted on developing countries like Bangladesh, China, Brazil, Mexico, Myanmar, Pakistan, Bhutan, Nepal, et cetera. Furthermore, a study on a critical
- 20. An Analysis of Indian Commercial Dynamism in International.................... 198 analysis comparing two or more emerging countries’ commercial dynamism ought to be conducted. For example, a comparative analysis of commercial dynamism between China and India, Bangladesh and Pakistan, Bangladesh and Myanmar, and more similar group of country economies. References 1. Agresti, S., Calvino, F., Criscuolo, C., Manaresi, F. & Verlhac, R. (2022). Tracking business dynamism during the COVID-19 pandemic: New cross-country evidence and visualisation tool. VoxEU. 2. Akgüngör, S., Barbaros, F. & Kumral, N. (2002). Competitiveness of the Turkish fruit and vegetable processing industry in the EU market. Russian and East European Finance and Trade, 38(3), 34- 53. 3. Anoopkumar, M. (2014). Intra-year price instability of commercial crops in India: Exploring the underlying dynamism. International Journal of Food and Agricultural Economics, 2(1), 145-156. 4. Assadzadeh, A., Behbudi, D., Miyarkolaie, N. F. & Moghadam, H. M. (2013). A study of the revealed comparative advantage in the textile and clothing industries between Iran and Turkey. International Journal of Economics and Finance Studies, 5(2), 95-107. 5. Carrasco, C. A. & Tovar-García, E. D. (2021). Trade and growth in developing countries: The role of export composition, import composition and export diversification. Economic Change and Restructuring, 54(4), 919-941. 6. Chakrabarty, R. & Chakravarty, S. L. (2012). An econometric study of Indian export and import of black gold (oil). Procedia-Social and Behavioral Sciences, 37, 182-196. 7. Decker, R. A., Haltiwanger, J., Jarmin, R. S. & Miranda, J. (2016). Declining business dynamism: implications for productivity. Brookings Institution, Hutchins Center Working Paper.
- 21. ISSN 2664-3413 (Print) 2664-3421 (Online) Daffodil International University Journal of Business and Entrepreneurship Vol. 16 No. 1 PP. 179-200 June 2023 199 8. Decker, R., Haltiwanger, J., Jarmin, R. & Miranda, J. (2014). The role of entrepreneurship in US job creation and economic dynamism. Journal of Economic Perspectives, 28(3), 3-24. 9. Hausmann, R. & Klinger, B. (2007). The structure of the product space and the evolution of comparative advantage. CID Working Paper Series. 10.Hayakawa, K. & Mukunoki, H. (2021). Impacts of lockdown policies on international trade. Asian Economic Papers, 20(2), 123- 141. 11.Khandare, V. B. (2011). Impact of globalization on international trade (with special reference to India). International Journal of Trade and Services, 3(1), 1-14. 12.Loungani, P., Mishra, S., Papageorgiou, C. & Wang, K. (2017). World trade in services: Evidence from a new dataset (WP/17/77), International Monetary Fund, Washington, D.C. 13.Phelps, E. S. (2008). Dynamism and inclusion: What? Why? How?. UBA, 1-10. 14.Poon, J. & Rigby, D. L. (2017). International trade: The basics. Routledge. 15.Raghuramapatruni, R. (2014). A study on the trade patterns between India & China: With special focus on services trade. Indian Ocean Digest, 33(1), 56-81. 16.Sutter, K. M. (2002). Business dynamism across the Taiwan Strait: The implications for Cross-Strait relations. Asian Survey, 42(3), 522-540. 17.Taylor, I. & Smith, K. (2007). United Nations Conference on trade and development (UNCTAD). Routledge. 18.Uddin, J. (2009). Time series behavior of imports and exports of Bangladesh: Evidence from Cointegration Analysis and Error Correction Model. International Journal of Economics and Finance, 1(2), 156-162.
- 22. An Analysis of Indian Commercial Dynamism in International.................... 200 19.Upender, M. (2007). Long run equilibrium between Indias's exports and imports during 1949-50-2004-05. Applied Econometrics and International Development, 7(1), 1-10. 20.Utkulu, U. & Seymen, D. (2004). Revealed comparative advantage and competitiveness: Evidence for Turkey vis-à-vis the EU/15. In European trade study group 6th annual conference, ETSG (pp. 1- 26). 21.World Bank. (2018). India—systematic country diagnostic: Realizing the promise of prosperity. 22.World Bank. (2022). The World Bank Data Bank. 23.WTO. (2020). Trade policy review: India (WT/TPR/S/403). World Trade Organization.