Paper on image processing
•Download as DOC, PDF•
2 likes•79 views

Tracking of object using the various image processing techniques

Recommended
Recommended
More Related Content
What's hot
What's hot (20)
Similar to Paper on image processing
Similar to Paper on image processing (20)
Recently uploaded
Recently uploaded (20)
Paper on image processing
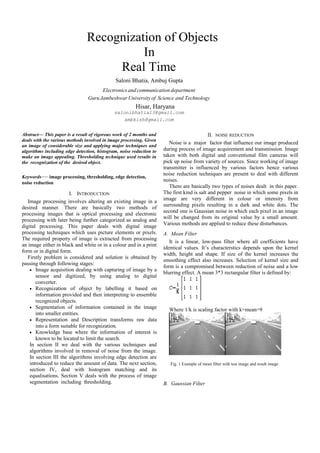
- 1. Recognization of Objects In Real Time Saloni Bhatia, Ambuj Gupta Electronics andcommunication department Guru Jambeshwar University of Science and Technology Hisar, Haryana salonibhatia13@gmail.com ambkish@gmail.com Abstract— This paper is a result of rigorous work of 2 months and deals with the various methods involved in image processing. Given an image of considerable size and applying major techniques and algorithms including edge detection, histogram, noise reduction to make an image appealing. Thresholding technique used results in the recognization of the desired object. Keywords— image processing, thresholding, edge detection, noise reduction I. INTRODUCTION Image processing involves altering an existing image in a desired manner. There are basically two methods of processing images that is optical processing and electronic processing with later being further categorized as analog and digital processing. This paper deals with digital image processing techniques which uses picture elements or pixels. The required property of image is extracted from processing an image either in black and white or in a colour and in a print form or in digital form. Firstly problem is considered and solution is obtained by passing through following stages: • Image acquisition dealing with capturing of image by a sensor and digitized, by using analog to digital converter. • Recognization of object by labelling it based on information provided and then interpreting to ensemble recognized objects. • Segmentation of information contained in the image into smaller entities. • Representation and Description transforms raw data into a form suitable for recognization. • Knowledge base where the information of interest is known to be located to limit the search. In section II we deal with the various techniques and algorithms involved in removal of noise from the image. In section III the algorithms involving edge detection are introduced to reduce the amount of data. The next section, section IV, deal with histogram matching and its equalisations. Section V deals with the process of image segmentation including thresholding. II. NOISE REDUCTION Noise is a major factor that influence our image produced during process of image acquirement and transmission. Image taken with both digital and conventional film cameras will pick up noise from variety of sources. Since working of image transmitter is influenced by various factors hence various noise reduction techniques are present to deal with different noises. There are basically two types of noises dealt in this paper. The first kind is salt and pepper noise in which some pixels in image are very different in colour or intensity from surrounding pixels resulting in a dark and white dots. The second one is Gaussian noise in which each pixel in an image will be changed from its original value by a small amount. Various methods are applied to reduce these disturbances. A. Mean Filter It is a linear, low-pass filter where all coefficients have identical values. It’s characterstics depends upon the kernel width, height and shape. If size of the kernel increases the smoothing effect also increases. Selection of kernel size and form is a compromised between reduction of noise and a low blurring effect. A mean 3*3 rectangular filter is defined by: Where 1/k is scaling factor with k=mean=9 Fig. 1 Example of mean filter with test image and result image B. Gaussian Filter
- 2. It is a linear filter used to remove Gaussian noise by convolving the original image with a mask that represents a Gaussian function. Convolution brings the value of each pixel closer with the values of its neighbours. A matrix 3*3 rectangular Gaussian filter is given by ; k = 9 Where k= sum of the elements of matrix Fig. 2 Example of Gaussian filter with test image and result image Note: smoothing filters tends to blur an image because pixel intensity values that are higher or lower than surrounding neighbourhood would smear across the area. Hence, non-linear filters are mostly used. C. Median Filter It is a non-linear filter which is an excellent choice for the removal of shot noise and horizontal scanning artefacts. To perform this filter a data window is move over an entire image. If a centre value of data window differs more than the certain value it will be exchanged by median value. The threshold value depends upon the local standard deviation within data window. If standard deviation is increased the threshold value also increases. Fig.3 Example of median filter with test image and result image III. EDGE DETECTION This operation on images drastically reduces the amount of data to be processed and preserves structural information about object boundaries. It basically uses laplacian and gradient methods. While Gradient method uses first derivative to detect edges, the Laplacian uses second derivative to search zero crossing. The egde detection operator basically determines the variations in pixel values. A threshold value is set and if the pixel value in an image is above it than that area is classified as an edge. The major methods include A. Sobel edge detection It is used to perform a 2-D gradient measurement. It determines the gradient for columns and rows separately using 3*3 convolution masks which is given by Thus gradient The mask is made to move over the entire area of a image and changes the pixel’s value and then shifts one pixel to right and continues till the entire pixels are manipulated. Fig.4 Example of Sobel edge detection with test and result image B. Laplacian edge detection This operator uses only one mask for both horizontal and vertical directions. It is used as an approximation for second order derivative, due to which this mask becomes very sensitive to noise and also produces double edges. Thus it is used to determine whether pixel value lies within dark or light side of an edge. Laplacian operator is not used in its original form. Fig.5 Example of Laplacian edge detection with test and result images
- 3. IV. HISTOGRAM EQUILIZATION Histogram shows the total tonal distribution in the image. It is a kind of a barchart of the count of pixels of every tone of gray that occurs in the image. It is basically used for image enhancement and various image processing applications of image compression and segmentation. For the histogram of an image equal sized classes are taken where vertical axis represents frequency and horizontal axis represents no. of pixels. It is the colour adjustment of two images whereas histogram equilization is a method of contrast adjustment using the image’s histogram. Fig.6 Example of histogram equalization with test and result image In above given images components of the Histogram of dark image are concentrated on lower side of intensity scale. Similarly components of histogram of light image are concentrated toward the high intensity side. An image with low contrast has a narrow histogram located toward middle of the scale. Finally, in high contrast image components of histogram cover a wide range of intensity scale. Thus the image whose pixels occupy the entire range of possible intensity level tend to distribute uniformly have an appearance of high contrast images and exhibit a large variety of gray levels. Thus the histogram equalization provides us with high contrast images since it spread pixels over the entire range of intensity. ACKNOWLEDGMENT The heading of the Acknowledgment section and the References section must not be numbered. Causal Productions wishes to acknowledge Michael Shell and other contributors for developing and maintaining the IEEE LaTeX style files which have been used in the preparation of this template. To see the list of contributors, please refer to the top of file IEEETran.cls in the IEEE LaTeX distribution. REFERENCES [1] S. M. Metev and V. P. Veiko, Laser Assisted Microtechnology, 2nd ed., R. M. Osgood, Jr., Ed. Berlin, Germany: Springer-Verlag, 1998. [2] J. Breckling, Ed., The Analysis of Directional Time Series: Applications to Wind Speed and Direction, ser. Lecture Notes in Statistics. Berlin, Germany: Springer, 1989, vol. 61. [3] S. Zhang, C. Zhu, J. K. O. Sin, and P. K. T. Mok, “A novel ultrathin elevated channel low-temperature poly-Si TFT,” IEEE Electron Device Lett., vol. 20, pp. 569–571, Nov. 1999. [4] M. Wegmuller, J. P. von der Weid, P. Oberson, and N. Gisin, “High resolution fiber distributed measurements with coherent OFDR,” in Proc. ECOC’00, 2000, paper 11.3.4, p. 109. [5] R. E. Sorace, V. S. Reinhardt, and S. A. Vaughn, “High-speed digital- to-RF converter,” U.S. Patent 5 668 842, Sept. 16, 1997. [6] (2002) The IEEE website. [Online]. Available: http://www.ieee.org/ [7] M. Shell. (2002) IEEEtran homepage on CTAN. [Online]. Available: http://www.ctan.org/tex- archive/macros/latex/contrib/supported/IEEEtran/ [8] FLEXChip Signal Processor (MC68175/D), Motorola, 1996. [9] “PDCA12-70 data sheet,” Opto Speed SA, Mezzovico, Switzerland. [10] A. Karnik, “Performance of TCP congestion control with rate feedback: TCP/ABR and rate adaptive TCP/IP,” M. Eng. thesis, Indian Institute of Science, Bangalore, India, Jan. 1999. [11] J. Padhye, V. Firoiu, and D. Towsley, “A stochastic model of TCP Reno congestion avoidance and control,” Univ. of Massachusetts, Amherst, MA, CMPSCI Tech. Rep. 99-02, 1999. [12] Wireless LAN Medium Access Control (MAC) and Physical Layer (PHY) Specification, IEEE Std. 802.11, 1997.