1. Accommodation and Supply
Sequence stratigraphy is all about accommodation (Fig.5.1). Accommodation is defined as “the space available for sedimentation”.
explained the concept this way: In order for sediments to accumulate, there must be space available below base level (the level above which erosion will occur).
On the continental margin, base level is controlled by sea level and, at first approximation, is equivalent to sea level....This space made available for potential sediment accumulations referred to as accommodation.
In marine basins this is equivalent to the space between sea level and the sea floor.
In non marine basins, a river’s graded profile functions as sedimentary base level .
Sequences are a record of the balance between accommodation change and sediment supply.
As accommodation is filled by sediment, the remaining space is measured by the depth of water from the sea surface to the sediment-water interface at the bottom of the sea.
Total accommodation increases when the basin floor subsides or sea level rises faster than the supply of sediment to fill the available space.
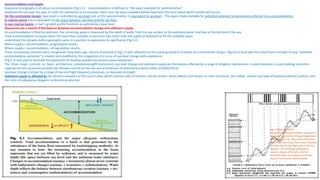
understood this decades before geologists were in a position to appreciate its significance (Fig.5.2).
Where supply > accommodation, progradation results.
Where supply < accommodation, retrogradation results.
These contrasting scenarios were recognized many years ago, and are illustrated in Fig.5.3 with reference to the stacking patterns of deltas on a continental margin. Figure5.4 illustrates the initial Exxon concept of how “sediment
accommodation potential ”is created and modified by the integration of a curve of sea-level change with subsidence.
(Fig.5.5) and used to illustrate the deposition of shoaling-upward successions (para sequences).
The three major controls on basin architecture, subsidence/uplift (tectonism), sea-level change and sediment supply are themselves affected by a range of allogenic mechanisms. Crustal extension, crustal loading, and other
regional tectonic processes provide the ultimate control on the size and architecture of sedimentary basins (Allen andAllen2013).
Sea level change is driven by a range of low-and high-frequency processes, as discussed at length .
Sediment supply is affected by the tectonic elevation of the source area, which controls rates of erosion, and by climate, which affects such factors as rates of erosion, the caliber, volume and type of erosional detrital product, and
the rates of subaqueous biogenic carbonate production.
Fig. 5.2Barrell’s(1917)
explanation of how oscillatory variations in
base level control the timing of deposition.
Sedimentation can only occur when base
level is actively rising. These short intervals
are indicated by the black bars in the top
diagram. The resulting stratigraphic
column, shown at the left, is full of
disconformities, but appears to be the
result of continuous sedimentation
2. Sequence Stratigraphy
Elements of the Model A practical, working geologist faces two successive questions:
firstly, is his/her stratigraphy sub divisible into stratigraphic sequences? And, secondly, what generated these sequences: regional tectonism, global eustasy, orbital forcing, or some other cause?
-the methods for analyzing the sequence record. These include the following:
•The mapping of unconformities as a first step in identifying unconformity-bounded sequences.
•The mapping of on lap, off lap and other stratigraphic terminations in order to provide information about the internal architectural development of each sequence.
•Clarifying the relationship between regional structural geology and the large-scale configuration of sequences.
•The mapping of cyclic vertical facies changes in outcrop or well records in order to subdivide a stratigraphic succession into its component sequences and depositional-systems tracts, and as an indicator of changes in
accommodation, including changes in relative sea-level.
The first three steps may be based on seismic-reflection data, well records or outcrops ; the last step cannot be accomplished using seismic data alone. This fourth step depends on the use of facies-cycle and other data.
Sequence stratigraphy is based on the recognition of unconformity-bounded units, which may be formally defined and named using the methods of allostratigraphy,
Formal definitions and procedures for the employment of allostratigraphy are provided by the North American Commission on Stratigraphic Nomenclature(2005) defined a depositional sequence as “a stratigraphic unit
composed of a relatively conformable succession of genetically related strata and bounded at its top and base by unconformities or their correlative conformities. ”An unconformity may be traced laterally into the deposits of
deep marine environments, where it may be represented by a correlative conformity. How-ever, recognizing the bounding contacts in a conformable succession might, in practice, be difficult. Documentation of the two- and
three-dimensional architecture of sequences was one of the most important breakthroughs of the seismic method, Sequences reflect the sedimentary response to base-level cycles—the rise and fall in sea level relative to the
shore line, and changes in the sediment supply.
Change in sea-level relative to the shoreline may result from eustasy (absolute changes in sea-level elevation relative to the center of Earth)or from vertical movements of the basin floor as a result of tectonism.
Because of the difficulty in distinguishing between these two different processes, the term relative sea-level changes normally used in order to encompass the uncertainty.
These basic controls are explained below.
In non marine settings, upstream controls (tectonism and climate change) are the major determinant of sequence architecture .
The cycle of rise and fall of base level generates predictable responses in a sedimentary system, such as the transgressions that occur during rising relative sea level, and the widespread subaerial erosion and delivery of clastic
detritus to the continental shelf, slope, and deep basin during a fall in relative sea level.
The depositional systems that result, and their vertical and lateral relationships, provide the basis for subdividing sequences into systems tracts.
The unconformities that are the key to sequence recognition are those that develop as a result of subaerial exposure.
Unconformities may develop below sea level as are sult of submarine erosion, but are not used as the basis for sequence definition.
Where subaerial unconformities are pre-sent, as in non marine and coastal settings, sequence definition is relatively straightforward.
Carrying a correlation into the offshore, including recognition of a correlative conformity, is not necessarily simple; in fact this has been the cause of before geologists were in a position to appreciate its significance .
Where supply > accommodation, progradation results. Where supply < accommodation, retrogradation results.
These contrasting scenarios were recognized many years ago, and are illustrated in Fig.5.3 with reference to the stacking patterns of deltas on a continental margin.
Figure 5.4 illustrates the initial Exxon concept of how “sediment accommodation potential ”is created and modified by the integration of a curve of sea-level change with subsidence.
A diagram very similar to that of Barrell’s was provided by Van Wagoner et al. ( Fig.5.5) used to illustrate the deposition of shoaling-upward successions (Para sequences).
The three major controls on basin architecture, subsidence/uplift (tectonism), sea-level change and sediment supply are themselves affected by a range of allogenic mechanisms.
Crustal extension, crustal loading, and other regional tectonic processes provide the ultimate control on the size and architecture of sedimentary basins (Allen andAllen2013).
Sea level change is driven by a range of low-and high-frequency processes,.
Sediment supply is affected by the tectonic elevation of the source area, which controls rates of erosion, and by climate, which affects such factors as rates of erosion, the caliber, volume and type of erosional detrital product,
and the rates of subaqueous biogenic carbonate production.
3. Fig. 5.3 Relationship between rate of deposition (Rd) and rate of subsidence (Rs) in a delta
complex.
a Progradational, b aggradational, c retrogradational. Maps at right show successive positions of
delta fronts (Curtis Curtis1970
4. Various architectural, or geometric, characteristics record the lateral shift in depositional environments in response to sea-level change and subsidence
(Figs.5.6 and 5.7).
Onlap typically takes place at the base of the succession, recording the beginning of a cycle of sedimentation.
Offlap develops when the rate of sedimentation exceeds the rate of accommodation generation.
An offlap architecture may predominate in settings of high sediment supply.
Toplap represents the abrupt pinch-out of offlapping units at the shelf-slope break.
This develops when there is a major difference in sedimentary accumulation between the shelf and slope, for example when wave, tide, or storm
processes inhibit or prevent accumulation on the shelf.
Sediment transported across the shelf is eventually delivered to the slope, a process termed sediment bypass.
Toplap may represent abrupt thinning rather than truncation, with a thick slope unit
passing laterally into a condensed section on the shelf.
Discrimination between truncation and condensation may then depend on seismic resolution.
Downlap surfaces may develop as a result of progradation across a basin floor, and they also develop during a transition from onlap to offlap.
They typically develop above flooding surfaces, as basin-margin depositional systems begin to prograde sea-ward following the time of maximum
flooding.
The dipping, prograding units are called clinoforms and they lap out downward onto the downlap surface as lateral progradation takes place.
The word lapout is used as a general term for all these types of stratigraphic termination
5. Fig. 5.8 Typical seismic reflection patterns,
illustrating the concept of seismic facies,
Many seismic sequences show Fig. 5.4 complex offlapping stratigraphy, of which the complex sigmoid-oblique clinoform pattern in Fig.5.8 is a simple example.
This diagram illustrates periods of sea-level still-stand, with the development of truncated top sets (toplap) alternating with periods of sea-level rise (or more
rapidbasin subsidence), which allowed the lip of the progradingsequence to build upward as well as outward.
Mitchum et al.(1977a) described the hummocky clinoform pattern as consisting of “irregular discontinuous subparallel reflection segments forming a practically
random hummocky pattern marked by nonsystematic reflection terminations and splits.
Relief on the hummocks typically is low, approaching the limits of seismic resolution. The reflection pattern is generally interpreted as strata forming small,
interfingering clinoform lobes building into shallow water, ”such as the up building or offlapping lobes of a delta undergoing distributary switching.
Submarine fans may show the same hummocky reflections.
Shingled clinoform patterns typically reflect offlapping sediment bodies on a continental shelf.
Chaotic reflections may reflect slumped or contorted sediment masses or those with abundant channels or cut-and-fill structures, such as submarine fan systems.
Many carbonate reefs also yield chaotic reflections. Disrupted reflections are usually caused by faults. Lenticular patterns are likely to be most common in sections
oriented perpendicular to depositional dip. They represent the depositional lobes of deltas or submarine fans
A marine flooding surface is a surface that separates older from younger strata, across which there is evidence of an abrupt increase in water depth.
These surfaces are typically prominent and readily recognizable and mappable in the stratigraphic record.
Each of the heavy, arrowed lines within the lower, retrogradational part of the sequence shown in Fig.5.7are marine flooding surfaces, as are the heavy lines in
Fig.5.9b. The maximum flooding surface records the maximum extent of marine drowning, and separates transgressive units below from regressive units
above(the dashed line extending obliquely across the center of the cross-section in Fig.5.7is a maximum flooding surface). It commonly is a surface of considerable
regional stratigraphic prominence and significance. It may be marked by a wide-spread shale, or by a condensed section, indicating slow sedimentation at a time
of sediment starvation on the continental shelf and may correspond to a downlap surface, as noted above. The prominence of the resurfaces led Galloway (1989)
to propose that sequences be defined by the maximum flooding surface rather than the subaerial erosion surface. We discuss this, and other alter-native
concepts, in Sect.7.7
6. Sequences may consist of stacked facies successions, each of which shows a gradual upward change in facies character, indicating a progressive
shift in local depositional environments.
The small packages of strata contained between the heavy lines in Fig.5.9a are examples of these component packages of strata.
The tempera sequence to encompass “a relatively conformable succession of genetically related beds or bed sets bounded by marine flooding
surfaces and their correlative surfaces...Para sequences are progradational and therefore the beds within para sequences shoal upward.
“para sequences and facies successions...are essentially the same thing, except that the concept of facies succession is broader. ”However,
other types of facies succession occur within sequences (e.g., channel-fillfining-upward successions), and the term parasequence is therefore
unnecessarily restrictive.
Many such successions are generated by autogenic processes, such as delta-lobes witching, and channel migration, that have nothing to do with
sequence controls, and to include them in a term that has the word “sequence” within it may be misleading. Walker(1992) recommended that
the term para sequence not be used.
pointed out numerous problems with the concept of the para sequence, including the imprecise meaning of the term “flooding surface ”(which
it is now recognized, may have several different meanings) and the potential confusion with surfaces generated by autogenic processes. He
recommended using the term only in the context of progradational units in coastal settings
7. Systems tracts are named with reference to their assumed position within the sea-level cycle, and these names incorporate ideas about the expected response of a basin to the changing balance between the major sedimentary
controls (accommodation and sediment supply) during a base-level cycle. There are four standard systems tracts.
These are the highstand, falling-stage, lowstand, and transgressive systems tracts.
Each is illustrated here by a block diagram model with summary remarks outlining the major sedimentary controls and depositional patterns prevailing at that stage of sequence development (Fig.5.10)
A depositional system is defined as (The three-dimensional array of sediments or Litho facies that fills a basin.
Depositional systems vary according to the types of sediments available for deposition as well as the depositional processes and environments in which they are deposited.
The dominant depositional systems are alluvial, fluvial, deltaic, marine, lacustrine and eolian systems).
A systems tract is defined as A linkage of contemporaneous depositional systems...Each is defined objectively by stratal geometries at bounding surfaces, position within the sequence, and internal para sequence stacking patterns.
Each is interpreted to be associated with a specific segment of the eustatic curve (i.e., eustatic lowstand-lowstand wedge; eustatic rise-transgressive; rapid eustatic fall-lowstandfan, and so on), although not defined on the basis of
this association
There are four standard systems tracts. These are the highstand, falling-stage, lowstand, and transgressive systems tracts. Each is illustrated here by a block diagram model with summary remarks outlining the major sedimentary
controls and depositional patterns prevailing at that stage of sequence development (Fig.5.10). Other terms have been used by different workers, but these four systems tracts and their bounding surfaces provide a useful, easy-to-
understand model from which to build interpretive concepts.
8. The falling base level causes basin ward retreat of the shoreline, a process termed forced regression
The occurrence of forced regression, as distinct from normal regression, may be detected by careful
mapping of coastal shoreline sandstone complexes.
Fall of sea level causes water depths over the shelf to decrease, increasing the erosive power of waves
and tides.
This typically leads to the development of a surface called the regressive surface of marine erosion
(RSME), which truncates shelf and distal coastal (e.g., deltaic) deposits that had been formed during
the preceding high stand phase(Fig.5.12b).
The first such surface to form, at the commencement of a phase of sea-level fall, is termed the basal
surface of forced regression. Given an adequate sediment supply, especially if there are pauses during
the fall of sea level (Fig.5.12c),shore face sand accumulates above the RSME, forming what have come
to be informally termed sharp-based sandstone bodies (Plint1988).
These are internally identical to other coastal, regressive sandstone bodies, except that they rest on an
erosion surface instead of grading up from the fine-grained shelf sediments, as in the initial coastal
sands shown in Fig.5.12a (which are the product of normal regression).
Repeated pulses of sea-level fall punctuated by still stand may develop several offlapping surfaces of
marine erosion.
Shelf-margin deltas may form where the mouths of major river systems regress to the shelf-slope break
during forced regression
Fig. 5.13 Sediment supply and depositional processes on a continental margin,
in relationship to a cycle of sea-level change (Arnott2010)
10. Fig. 5.18 Sequence model for fluvial deposits.
A Wright and Marriott (1993),b Shanley and McCabe (1994)
11.
12.
13.
14.
15.
16.
17.
18.
19. A An antecedent topographic high beneath an isolated
carbonate buildup.
Significant localized thickening within an isolated
carbonate buildup.
Onlap of overburden onto the margins of an isolated carbonate buildup (left),
contrasted with a situation where depositional relief on the margins of the isolated
carbonate buildup was lower because of contemporaneous infill of the adjacent basin
(right). In this case, carbonate material from the platform top was transported away
from the platform margin to produce depositional wings that interfinger with the
basin-fill strata.
Platform margin trajectories with phases of
progradation, aggradation, and retrogradation, which
can be indicative of an isolated carbonate buildup.
The thin-thick-thin pattern commonly developed on isolated carbonate
buildups that are shedding material from the platform top through a bypass
zone to be redeposited in deeper water adjacent to the platform. TCtop
carbonate; BC base carbonate.
20. Figure6.34 is one of the first illustrations of a horizontal seismic
section through a fluvial system to be published. It shows a
meandering system in the shallow subsurface of the Gulf of Thailand.
False color imagery is used to highlight the amplitude differences
between the meandering channels and the overbank areas.
For example, access to potential reservoir beneath environmentally sensitive lands, or underwater, may be accessed by directional drilling, and
the technology now allows multiple holes to be drilled in every direction from a single well pad, which reduces the surface impact of the
operation. Geologically, the advantage of directional drilling is that it creates the possibility to access specific subsurface targets by the use of
real-time down hole steering. In the 1980s the development of the technology permitted wells to be completed with horizontal segments that
could be steered to penetrate a reservoir along its length, generating substantially greater exposure of a hydrocarbon-bearing unit to the
producing well. Horizontal segments of up to 3 km are now possible. Drilling motors are mounted at the end of the drill pipe, driven by the
drilling mud, and subsurface navigation is achieved by the use of gyroscopes, with steering achieved on the basis of navigational information
sent electronically from the drill head in real time. Horizontal drilling has become widely used since the 1990s in the production of shale gas
and tight oil, and is also an integral part of the technique of in situ production of oil from the Alberta Oil Sands.
21.
22. Types of Stratigraphic Unit
Rocks may be described in terms of any of their physical, chemical, organic, or other properties, including lithology, fossil content,
geochemistry, petrology, mineralogy, electrical resistivity, seismic velocity, density (gravity), magnetic polarity, or age.
Theoretically, any of these properties maybe used for description and correlation, and most are so used for various purposes. In
practice lithology is the most important criterion; fossil content is also crucial for rocks of Phanerozoic age
The most important types of stratigraphic units are :
Lithostratigraphic units: these are strictly empirical, based on observable lithologic features including composition and grain-size
and possibly also including certain basic sedimentological information, such as types of sedimentary structures and cyclic
successions.
Biostratigraphic units: these are based on fossil content. Lifeforms evolve with time, permitting subdivision intobiozoneson the
basis of changes in the fauna or flora.
The first and last appearance of particular species or variants may also serve as useful time markers.
Unconformity-bounded units: these are units bounded above and below by unconformities. They may consist of any kinds of rocks,
igneous, metamorphic or sedimentary.
Unconformity-bounded sedimentary successions may be formalized using the empirical, descriptive classification procedures of
allostratigraphy (see NACSN2005), but increasingly geologists now employ the interpretive procedures and models of sequence
stratigraphyas the main basis for subdivision and mapping of the basin fill.
Chronostratigraphic units: these comprise an interpretive stratigraphy, in contrast to lithostratigraphic and biostratigraphic units,
which are strictly descriptive.
Chronostratigraphy concerns itself with correlation and the age of the strata, which may be determined by a variety of means, of
which the most important are fossil content, radio metricdating, magnetic polarity (for the post Middle Jurassic) and the oxygen
isotope record (for the Cenozoic).
23.
24. Lithostratigraphy
Until the 1980s it was standard practice to describe and map stratigraphic successions on the basis of lithostratigraphic principles (Fig.7.3). In the field, particularly in arid regions where the rocks are well exposed, it is still
the historically established formations that are the basis for field location and identification. Such is the case, for example, in the Grand Canyon and Canyonlands areas of the United States, and the Front Ranges of the
Rocky Mountains in Alberta. Itis necessary, therefore, to be able to read older publications and maps and understand what type of information they convey. Amongst the problems with lithostratigraphy as a method of
description is that the defined units carry no meaning regarding the origins or age of the units. Formations are commonly diachronous, and many stratigraphic names were established many decades ago, long before the
advent of modern facies and sequence analysis. Older literature may therefore be replete with the names of local, poorly defined units, with a given body of rocks defined and named differently in different parts of a basin.
Procedures are available(e.g., see NACSN2005) for the revision and redefinition of units as new information becomes available from surface mapping or subsurface exploration.
25. Fig. 7.4 An example of a lithostratigraphic subdivision
of a rock succession. Stratigraphic units exposed in
the mountains of northern Ellesmere Island, Arctic
Canada (photo A.F. Embry)
Types of Lithostratigraphic Units and Their Definition A hierarchy of units has been developed based on the formation, which is the primary
lithostratigraphic unit (NACSN2005).
Group Formation Member Tongue or lentil Bed. The formation.
An important convention has long since been established that all sedimentary rocks
should be subdivided (when sufficient data have been collected) in to formations.
No other types of lithostratigraphic subdivision need be used, although convenience of
description may require them.
What is a formation? There are no fixed definitions that deal with the scale or variability
of what should constitute a formation, although the procedures for establishing
limits(contacts) and names are well established (e.g., see NACSN2005).
Figure 7.4 provides a good example of the way in which stratigraphic successions are
subdivided on the basis of lithology.
The lithologies, colors and weathering characteristics of the rocks suggest a fourfold
subdivision of the exposure.
Comparisons with other exposures nearby and the presence of distinctive fossils permits
three of the subdivisions to be assigned to previously existing formations, while the
fourth (oldest) unit is different from the local succession, and has yet to be given a name.
This outcrop is large enough that the angular unconformity between two of the units
(the Nansen and the Barrow formations) can clearly be seen.
The degree of lithologic variability required to distinguish a separate formation tends to
reflect the level of information available to the stratigrapher.
Formations may be only a few meters or several thousands of meters in thickness; they
maybe traceable for only a few kilometers or for thousands of kilometers.
Formations in frontier basins usually are completely different in physical magnitude from
those in populated, well-explored basins, such as much of western Europe and the
United States.
In exploration in frontier basins proceeds, some of the larger formations first defined on
a reconnaissance basis may have subsequently been subdivided into smaller units and
the ranking of the names changed. NACSN (2005) provides the procedures for making
these kinds of revisions.
26. This is the major source of onshore seismic data for the UK, including that of the Wessex Coast area, suc as Devon, Dorset, Hampshire and the Isle of Wight.
"With over 75,000km of available seismic survey data as acquired by the onshore exploration industry, the Library strives to locate all available data items pertaining to each seismic profile, with the aim of providing a fully
reconciled archive of original pre-stack field records de-multiplexed to SEG-Y."
Shown here is a north-south seismic section across the Weymouth Anticline, modified and with some notes added
27.
28.
29.
30.
31.
32. Fig. 6. (a) Clast-supported breccia of angular chert blocks and rock fragments of shale and sandstone cemented by a fine-grained, brick-red
matrix of Mn and Fe oxides that is heavily silicified. The breccia's are referred to as ‘wad’.
(b) An erosion cap of ‘wad’ on the hill top 300 m SE of Coopers cave (Fig. 1). The ‘wad’ overlies a paleo-erosion surface
that marks the African erosion surface of Partridge and Maud (1987), which in the area of the photo occurs at a height of 1500 .
(c) Chert breccia in a sandstone matrix near the base of a fracture that formed during deposition of the Rooihoogte formation 50 m east of
Malapa pit. The breccia is clast supported with angular breccia clasts that consist almost exclusively of chert derived from surrounding
dolomite units embedded in a sandstone matrix, subsequently cemented with chert.
(d) The chert breccia-filled fractures of the Rooihoogte formation form conspicuous, wall-like landscape features where they weather out
differentially from surrounding chert. The wall in this photograph occurs 300 m NNW from Malapa and reaches a height of 6.8 m.
(e) Layer-parallel shear zone in a shale band near the base of the Monte Christo formation. Caves
commonly form along shear zones like this.
(f) Layer-parallel shear zone in dolomite near the top of the Lyttleton formation. The deformational nature of this horizon can be
deduced from intense folding and dismemberment of chert horizons
(a) Clast-supported breccia of angular chert blocks and
rock fragments of shale and sandstone cemented by a
fine-grained, brick-red matrix of Mn and Fe oxides that
is heavily silicified. The breccia's are referred to as
‘wad’.
(b) An erosion cap of ‘wad’ on the hill top 300 m SE
of Coopers cave (Fig. 1). The ‘wad’ overlies a paleo-
erosion surface
that marks the African erosion surface of Partridge
and Maud (1987), which in the area of the photo
occurs at a height of 1500 m.
(c) Chert breccia in a sandstone matrix near the base
of a fracture that formed during deposition of the
Rooihoogte formation 50 m east of Malapa pit. The
breccia is clast supported with angular breccia clasts
that consist almost exclusively of chert derived from
surrounding dolomite units embedded in a sandstone
matrix, subsequently cemented with chert.
(d) The chert breccia-filled fractures of the
Rooihoogte formation form conspicuous, wall-like
landscape features where they weather out
differentially from surrounding chert. The wall in
this photograph occurs 300 m NNW from Malapa
and reaches a height of 6.8 m.
(e) Layer-parallel shear zone in a shale band near the
base of the Monte Christo formation. Caves
commonly form along shear zones like this.
(f) Layer-parallel shear zone in dolomite near the
top of the Lyttleton formation. The deformational
nature of this horizon can be
deduced from intense folding and dismemberment
of chert horizons
33. Fig. 7. Cartoon section of a breccia–sandstone-filled fracture system along the base of the Rooihoogte formation. The character of the fracture and
its fill changes as a function of stratigraphic level.
The chert-breccia-in-sandstone sheets are wedge-shaped and widen upward. Towards the stratigraphic top of the Rooihoogte formation, lenses of
chert conglomerate occur (a).
At lower levels, within the top of the fracture systems fracture fill may consist of sandstone with few angular to rounded chert clasts preserving
horizontal layering and graded bedding (b).
At lower levels in the fracture, breccia is clast supported, and angular clasts consist almost exclusively of chert derived from
surrounding dolomite (c).
Near the base of the sediment-filled fractures, hydrothermal breccia zones in dolomite are locally preserved (d).
These breccia zones merge with 0.001–3 m wide, near-vertical, sheet-like, chert vein, stock work systems that developed along normal faults below
the base of the sediment filled fractures (e).
Caves developed preferentially along these fracture systems
Conclusion
Our understanding of hominin evolution is critically dependent on understanding the sites where fossils are found in relation to the landscape in which
the fossil sites occur.
In this context no question is more important than whether fossil sites merely represent convenient trapping sites with superior taphonomic charac-
teristics, or whether the fossil sites are a reflection of habitation and land-use patterns by animals that occasionally got trapped within them.
With a detailed description of the evolving landscape in the CoH, focusing on the catchment of the Grootvleispruit, we have at-tempted to show that this
landscape has changed considerably in the past 4 Ma.
These changes were largely driven by erosional processes that resulted from broad uplift of the landscape.
Erosion patterns did not involve active faulting along major fault lines, but instead resulted from the subtle rearrangement of the land-scape through the
interactions of multiple fractures in an evolving, extensional, far-field stress. Erosion exposed caves in the CoH, some of which attracted large numbers of
different animals for long periods of time.
The preferential attraction of certain caves over others, as displayed in the analysis of cave distribution pat-terns, probably reflects the presence of a
stable water source either inside a cave or nearby.
Therefore, it appears that the landscape of the CoH, with its caves and stable water sources, and incised valleys with variable vegetation patterns at
localized scales, did pro-
vide a preferred environment that attracted not only hominins, but also many other creatures, i.e. it is not just taphonomic coincidence that the fossils
ended up in the caves
34. Jurassic Rock Strata
law of superposition
the strata rock of the Fossil Bay, as
seen from the sea of Maria Island
Ferry, Triabun
35. Lateral Layers of Geologic Strata
We’ve all noticed the many layers of rock strata as we drive along a road cut. It seems as though we are driving through a huge
“layer cake,” cut open to expose the inside. Grand Canyon looks this way. Most of the exposed layered rocks are sedimentary
rocks. It appears one layer was deposited directly upon another.
The “stack” of layers might have been tilted, folded, or faulted subsequent to deposition, but the layers were flat-lying when first
deposited. Thus, the ground surface usually represents the top of the final layer in any particular region.
For decades the discipline of geology was dominated by this “layer cake” thinking, and even today it is a convenient theory for
geologists. But scientists have discovered that geologic layers are not always laid down one after another. Sometimes, a sequence
of layers is laid down simultaneously from left to right, not from top to bottom.
All geologists recognize that major geologic events accomplished much of the deposition of the rocks we see. Tsunamis,
underwater mudflows, gravity slides, turbidity currents, etc., are all capable of laying down sediment rapidly. Only energetic flow
can carry along and eventually deposit large particles. As such a flow slows, finer grains drop out. These events mirror our
understanding of the dynamic Flood of Noah’s day.
Consider a continual supply of sediment being propelled underwater. The large sand grains drop out at the leading edge of the
flow as the velocity slows and water curls back, but the finest grains remain mobile. More sediment-laden water follows, with the
larger grains resting just beyond the prior deposit, and the finer grains come to rest on top of the coarser grains. This continues
and ultimately results in two or more blanket-like layers, all of which were simultaneously deposited laterally, rather than in a
consecutive and vertical manner. This concept is clarified in the accompanying diagram,1 which specifically explains the coarse-to-
fine-grained Sauk Megasequence in Grand Canyon. The sequence consists of the coarse-grained Tapeats Sandstone, the fine-
grained Bright Angel Shale, and the even finer-grained Muav Limestone, each of which has enormous horizontal extent and a
comparatively minor thickness.2 The concept applies, in general, to all such megasequences and in many locations. Many of the
Flood rocks were deposited this way.
36. “Lithic” means “rock.” Lithic clasts are rock fragments, as opposed to mineral fragments.
37.
38. Most coal forms in fluvial or delta environments where vegetation growth is vigorous and where decaying plant matter
accumulates in long-lasting swamps with low oxygen levels.
To avoid oxidation and breakdown, the organic matter must remain submerged for centuries or millennia, until it is covered
with another layer of either muddy or sandy sediments.
It is important to note that in some textbooks coal is described as an “organic sedimentary rock.”
In this book, coal is classified with the clastic rocks for two reasons:
-first, because it is made up of fragments of organic matter; and
-second, because coal seams (sedimentary layers) are almost always interbedded with layers of clastic rocks, such as mud
rock or sandstone.
In other words, coal accumulates in environments where other clastic rocks accumulate.
The term arenite applies to a so-called clean sandstone, meaning one with less than 15% silt and clay.
Considering the sand-sized grains only, arenites with 90% or more quartz are called quartz arenites.
If they have more than 10% feldspar and more feldspar than rock fragments, they are called feldspathic arenites or arkosic
arenites(or just arkose).
If they have more than 10% rock fragments, and more rock fragments than feldspar, they are lithic4arenites. A sandstone
with more than 15% silt or clay is called a wacke(pronounced wackie).
The terms quartz wacke, lithic wacke, and feldspathic wackeare used. Another name for a lithic wacke is greywacke.
39. Veins are common features in rocks and extremely useful structures to determine stress, strain, pressure, temperature, fluid composition and fluid origin during their formation. Here we provide an overview of the origin and terminology of veins. Contrary to the classical tripartite
division of veins into syntaxial (inward growth), antitaxial (outward growth) and stretching veins (no consistent growth direction), we emphasize a continuum between syntaxial and stretching veins that form from the crack-seal process, as opposed to antitaxial veins that grow
without the presence of an open fracture during growth. Through an overview of geochemical methods that can be applied to veins we also address the potential, but so far little-investigated link between microstructure and geochemistry. There are basically four mechanisms with
increasing transport rates and concomitant decreasing fluid–rock interaction: (1) diffusion of dissolved matter through stagnant pore fluid; (2) flow of fluid with dissolved matter through pores; (3) flow of fluid with dissolved matter through fractures and (4) movement of fractures
together with the contained fluid and dissolved matter (mobile hydro fractures). A vein system is rarely the product of a single transport and mineral precipitation mechanism, as these vary strongly both in space and time within a single system.
40. Veins generally cut sharply across the host rock
fabric (Fig.4a), although some veins have been
emplaced parallel to the foliation and bedding. The
vein swarms have a general southerly to south
easterly trend, but swarms with a wide range of
trends occur.
The veins are almost entirely quartz, with minor
albite, and are dominated by masses of impinging
quartz prisms(Fig.4b).
vein centers commonly have open cavities into
which prismatic crystal terminations project, and
many of these crystals are coated with chlorite
(Fig.4b).
Vein edge sand terminations have host rock
breccia fragments, variably pyritised, on the
millimeter to centimeter scale (Fig.4c)
A quartz vein in the massive basalt rock.
41. The structural geology and tectonics research group addresses topical problems in structural geology, regional geology and
tectonics, and how rocks deform--at the atomic to the plate tectonic scale. The goals of our research are to contribute to our basic
knowledge of deformation at the lithospheric scale, how deformation at depth is coupled to that at the surface, and to better
understand the driving forces for this deformation. We utilize a variety of approaches, both traditional and innovative. Timing and
the rates of deformational events based on geo chronologic and thermos chronologic data sets are key to our research.
Geochronology Facility
We comprehensively examine the evolution of the Earth's crust using highly integrated geochronologic
approaches conducted in a wide spectrum of analytical facilities that are all housed within the School of Earth,
Energy & Environmental Sciences. Our highly collaborative research provides fundamental data to many
disciplines throughout the geosciences, including tectonics, geodynamics, petrology, geochemistry,
geomorphology, sedimentology, stratigraphy, paleontology, and paleoclimatology
The interplay between temperature, pressure, and deformation in the Earth’s crust produces
a wide variety of structural fabrics and metamorphic textures in rocks. The ability to
accurately describe, analyze and interpret these fabrics and textures in the field, hand
specimen and thin section is essential to anyone interested in the structural and thermal
history of metamorphic rocks and the thermo-mechanical behavior of the lithosphere.
This course brings together elements of macro- and microstructural analysis, metamorphic
petrology, and geochronology and thermos chronology as applied to mostly crustal
metasedimentary and metaigneous rocks. It should be useful to anyone carrying out
structural studies (including electron backscatter diffraction or EBSD), metamorphic petrology
and geochronology in deformed and metamorphosed terranes.
Topics will include geotherms and their variation, the rheology of the crust and mantle; how
and why strain is partitioned and localized in the lithosphere; the meaning and nature of
brittle–ductile transition zones; the development of deformation-related fabrics in
sedimentary rocks with increasing T’s and P’s; metamorphic mineral growth; preferred
crystallographic orientations; fault and shear zone geometry; the application of electron
backscatter diffraction (EBSD) to microstructure analysis; and how best to integrate
structural, metamorphic and geo chronologic /thermos chronologic datasets in holistic
fashion.
Practical experience will be obtained by the study of several suites of metamorphic rocks that
illustrate commonly observed structural and metamorphic progressions in nature. These
include examples of increasing strain toward fault zones, variations in deformation and
resultant fabrics with increasing temperature, the contrasts between fabrics and textures
developed during burial versus exhumation and the analysis and interpretation of
superimposed structural and metamorphic events. Your final accomplishment/exam will
involve a description and interpretation of a suite of rocks and thin sections from your
thesis/study area (we have a few on hand if you don’t have any). Special sessions will be
scheduled for these presentations and their critique.
44. Structural geology
Structural geology deals with the geometric relationships of rocks and geologic features in general. The scope of structural geology is vast, ranging in size from
submicroscopic lattice defects in crystals to mountain belts and plate boundaries.
Structures may be divided into two broad classes:
the primary structures that were acquired in the genesis of a rock mass and the secondary structures that result from later deformation of the primary structures.
Most layered rocks (sedimentary rocks, some lava flows, and pyroclastic deposits) were deposited initially as nearly horizontal layers. Rocks that were initially
horizontal may be deformed later by folding and may be displaced along fractures. If displacement has occurred and the rocks on the two sides of the fracture
have moved in opposite directions from each other, the fracture is termed a fault; if displacement has not occurred, the fracture is called a joint. It is clear that
faults and joints are secondary structures; i.e., their relative age is younger than the rocks that they intersect, but their age may be only slightly younger. Many
joints in igneous rocks, for example, were produced by contraction when the rocks cooled. On the other hand, some fractures in rocks, including igneous rocks, are
related to weathering processes and expansion associated with removal of overlying load. These will have been produced long after the rocks were formed.
The faults and joints referred to above are brittle structures that form as discrete fractures within otherwise un deformed rocks in cool upper levels of the crust. In
contrast, ductile structures result from permanent changes throughout a wide body of deformed rock at higher temperatures and pressures in deeper crustal
levels. Such structures include folds and cleavage in slate belts, foliation in gneisses, and mineral lineation in metamorphic rocks.
The methods of structural geology are diverse.
At the smallest scale, lattice defects and dislocations in crystals can be studied in images enlarged several thousand times with transmission electron microscopes.
Many structures can be examined microscopically, using the same general techniques employed in petrology, in which sections of rock mounted on glass slides are
ground very thin and are then examined by transmitted light with polarizing microscopes. Of course, some structures can be studied in hand specimens, which
were preferably oriented when collected in the field.
On a large scale, the techniques of field geology are employed. These include the preparation of geologic maps that show the areal distribution of geologic units
selected for representation on the map. They also include the plotting of the orientation of such structural features as faults, joints, cleavage, small folds, and the
attitude of beds with respect to three-dimensional space.
• A common objective is to interpret the structure at some depth below the surface. It is possible to infer with some degree of accuracy the structure beneath
the surface by using information available at the surface. If geologic information from drill holes or mine openings is available, however, the configuration of
rocks in the subsurface commonly may be interpreted with much greater assurance as compared with interpretations involving projection to depth based
largely on information obtained at the surface.
• Vertical graphic sections are widely used to show the configuration of rocks beneath the surface. Balancing cross sections is an important technique in thrust
belts. The lengths of individual thrust slices are added up and the total restored length is compared with the present length of the section and thus the
percentage of shortening across the thrust belt can be calculated. In addition, contour maps that portray the elevation of particular layers with respect to sea
level or some other datum are widely used, as are contour maps that represent thickness variations.
• Strain analysis is another important technique of structural geology. Strain is change in shape; for example, by measuring the elliptical shape of deformed
ooliths or concretions that must originally have been circular, it is possible to make a quantitative analysis of the strain patterns in deformed sediments. Other
useful kinds of strain markers are deformed fossils, conglomerate pebbles, and vesicles. A long-term aim of such analysis is to determine the strain variations
across entire segments of mountain belts. This information is expected to help geologists understand the mechanisms involved in the formation of such belts.
A combination of structural and geophysical methods are generally used to conduct field studies of the large-scale tectonic features mentioned below. Field work
enables the mapping of the structures at the surface, and geophysical methods involving the study of seismic activity, magnetism, and gravity make possible the
determination of the subsurface structures.
The processes that affect geologic structures rarely can be observed directly.
• The nature of the deforming forces and the manner in which the Earth’s materials deform under stress can be studied experimentally and theoretically,
however, thus providing insight into the forces of nature. One form of laboratory experimentation involves the deformation of small, cylindrical specimens of
rocks under very high pressures. Other experimental methods include the use of scale models of folds and faults consisting of soft, layered materials, in which
the objective is to simulate the behavior of real strata that have undergone deformation on a larger scale over much longer time.
• Some experiments measure the main physical variables that control rock deformation—namely, temperature, pressure, deformation rate, and the presence of
fluids such as water. These variables are responsible for changing the rheology of rocks from rigid and brittle at or near the Earth’s surface to weak and ductile
at great depths. Thus, experimental studies aim to define the conditions under which deformation occurs throughout the Earth’s crust
types of faulting in tectonic earthquakes
In normal and reverse faulting, rock masses slip vertically past each
other.
In strike-slip faulting, the rocks slip past each other horizontally.
45. Tectonics
The subject of tectonics is concerned with the Earth’s large-scale structural features. It forms a multidisciplinary framework for interrelating many other geologic disciplines, and thus it provides an integrated understanding of large-scale processes that have
shaped the development of our planet.
These structural features include mid-oceanic rifts; transform faults in the oceans; intracontinental rifts, as in the East African Rift System and on the Tibetan Highlands; wrench faults (e.g., the San Andreas Fault in California) that may extend hundreds of
kilometer's; sedimentary basins (oil potential); thrusts, such as the Main Central thrust in the Himalayas, that measure more than 2,000 kilometer's long; ophiolite complexes; passive continental margins, as around the Atlantic Ocean; active continental
margins, as around the Pacific Ocean; trench systems at the mouth of subduction zones; granitic batholiths (e.g., those in Sierra Nevada and Peru) that may be as long as 1,000 kilometers; sutures between collided continental blocks; and complete sections
of mountain belts, such as the Andes, the Rockies, the Alps, the Himalayas, the Urals, and the Appalachians-Caledonians. Viewed as a whole, the study of these large-scale features encompasses the geology of plate tectonics and of mountain building at the
margins of or within continents.
crustal generation and destruction
Three-dimensional diagram showing crustal
generation and destruction according to the theory of
plate tectonics; included are the three kinds of plate
boundaries—divergent, convergent (or collision), and
strike-slip (or transform
46. Earth history
Historical geology and stratigraphy
One of the major objectives of geology is to establish the history of the Earth from its inception to the present. The most
important evidence from which geologic history can be inferred is provided by the geometric relationships of rocks with
respect to each other, particularly layered rocks, or strata, the relative ages of which may be determined by applying
simple principles. One of the major principles of stratigraphy is that within a sequence of layers of sedimentary rock, the
oldest layer is at the base and that the layers are progressively younger with ascending order in the sequence. This is
termed the law of superposition and is one of the great general principles of geology. Ordinarily, beds of sedimentary rocks
are deposited more or less horizontally. In some regions sedimentary strata have remained more or less horizontal long
after they were deposited. Some of these sedimentary rocks were deposited in shallow seas that once extended over large
areas of the present continents. In many places sedimentary rocks lie much above sea level, reflecting vertical shift of the
crust relative to sea level. In regions where the rocks have been strongly deformed through folding or faulting, the original
attitudes of strata may be greatly altered, and sequences of strata that were once essentially horizontal may now be
steeply inclined or overturned.
Prior to the development of radiometric methods of dating rocks, the ages of rocks and other geologic features could not
be expressed quantitatively, or as numbers of years, but instead were expressed solely in terms of relative ages, in which
the age of a particular geologic feature could be expressed as relatively younger or older than other geologic features. The
ages of different sequences of strata, for example, can be compared with each other in this manner, and their relative ages
with respect to faults, igneous intrusions, and other features that exhibit crosscutting relationships can be established.
Given such a network of relative ages, a chronology of events has been gradually established in which the relative time of
origin of various geologic features is known. This is the main thread of historical geology—an ordered sequence of geologic
events whose occurrence and relative ages have been inferred from evidence preserved in the rocks. In turn, the
development of radiometric dating methods has permitted numerical estimates of age to be incorporated in the scale of
geologic time.
The development of the mass spectrometer has provided researchers with a means of calculating quantitative ages for
rocks throughout the whole of the geologic record. With the aid of various radiometric methods involving mass
spectrometric analysis, researchers have found it possible to determine how long ago a particular sediment was deposited,
when an igneous rock crystallized or when a metamorphic rock recrystallized, and even the time at which rocks in a
mountain belt cooled or underwent uplift. Radiometric dating also helped geochronologists discover the vast span of
geologic time. The radiometric dating of meteorites revealed that the Earth, like other bodies of the solar system, is about
4,600,000,000 years old, the oldest minerals (detrital zircons of Western Australia) are 4,400,000,000 to 4,100,000,000
years old, and the oldest rocks discovered so far (the faux amphibolites located on the eastern shore of Hudson Bay in
Canada) formed roughly 4,280,000,000 years ago. It has been established that the Precambrian time occupies seven-
eighths of geologic time, but the era is still poorly understood in comparison with the Phanerozoic Eon—the span of time
extending from about the beginning of the Cambrian Period to the Holocene Epoch during which complex life forms are
known to have existed. The success of dating Phanerozoic time with some degree of precision has depended on the
interlinking of radiometric ages with biostratigraphy, which is the correlation of strata with fossils.