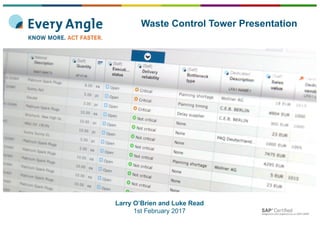
4. Every Angle fills the GAP
Executive Management
Business Suite
Any DB
Operational management
Control lists,
Action lists
Exception lists
Process
Performance
Indicators
Operational Execution
Business IT Systems
Corporate Business
Intelligence system
Key
Performance
Indicators
SE 16 SQVI ABAP
1/1
Maintainable?
Expert dependent?
Scalable?
Reliable?
Secure?
(Hidden) costs?
RISK
5. We’re Not Just Another BI Tool…
Executive Management
Business Suite
Any DB
Corporate BI and
Reporting systems
Key
Performance
Indicators
Operational management
Control lists,
Action lists
Exception lists
Process
Performance
Indicators
Operational Execution
Business IT Systems
7. KNOW MORE.
We empower businesses to know more and act faster.
Built-in intelligence
Additional status,
root cause and
calculated fields
ACT FASTER.
Plug-and-play
install
100’s of ready-to-use-
templates
Removal of
data complexity
Natural business
language
Enhance understanding of issues by… Empower immediate action through…
Real self-service
reporting & analysis
Actionable insight
9. 2
Who are we?
Waste Control Tower Demo
Introduction to Control Towers
1
3
4 Q&A
10. UNDERSTAND
ISSUES & ACT
Our built-in intelligence and insight
empowers business users to understand
the root cause of issues and their impact.
11. Most BI tools =
analysis of planes that have
landed
It’s hindsight;
lag measures
12. Understanding complex supply chains requires more than reports
SO
SO
SO
SO
SO
SO
PO
Another plant
PO
Shipment
WO
WOWO
WO
WO
WO
WO
WOWO
WO
WO
WO
WO
Landed Planes = Closed + Paid Orders = History
Planes to land / depart = Open + Planned Orders = Current + Future
Hindsight
Insight you can act on
13. Why 1?
Main reason for delays and
waiting is missing parts
Every Angle Understands:
Identifies the root causes, rather than just reporting on the
symptoms
Issue:
Waiting times in assembly lines must reduce
Why 2?
Warehouse seems unable to
deliver the parts on time
Why 3?
Parts are recieved into the
warehouse late
Why 4?
Delayed parts all seem to be
in-house produced components
Why 5?
Subassembly production has
backlog
14. More than just reporting:
The difference between Data and Actionable Insight
Issue: Waiting times in production must reduce.
DATA
• We have 100
production
items in backlog
INSIGHT
• The cause of the backlog of
50 items is due to late
delivery of the parts by
suppliers
• The cause for 30 items is the
fact that the lead times in
SAP are not correct.
• 20 of the items are all made
on the same work center
which responsible for delays.
INFORMATION
• The main
reason for delay
is failure to
arrive on line
with the
production
schedule
‘ACTIONABLE INSIGHT’
• Work with suppliers to
improve delivery
performance of the
purchased parts.
• Correct the lead times on
the materials master and
vendor info records
• Start improvement team on
this work center.
Why? Production backlog causes waiting times in assembly lines.
Question: How can we reduce and control the backlog in production?
15. Do we have
enough
resource
coverage?
How much
money have we
lost due to
misallocated
discounts?
Are we buying
things we don’t
need? Can we
delay any
purchases?
What is
causing
backorders?
Understand
Issuesand
Act
What is the
likely service
level of open
orders?
Do we have any
bottlenecks affecting
our ability to supply
current & future
demand?
Do we have
enough
incoming
supply?
What purchase
orders will affect
customer service
if they are late?
Will our assets
be operational
when we need
them?
How much
cash is tied
up in excess
inventory?
Are we
retaining our
best people?
How accurate is
our master and
transactional
data?
Are we exposed
to any
Segregation of
Duty risks?
Plant
Maintenance
Supply ChainProcurement Finance Human
Resources
Risk &
Compliance
ITOrder to
Cash
We provide understanding - for all personas and all processes