2024: The FAR, Federal Acquisition Regulations - Part 29
Cartography short timeline
1. Tracing its roots to October 1941, CIA’s Cartography Center has a long, proud
history of service to the Intelligence Community (IC) and continues to respond to a
variety of finished intelligence map requirements. The mission of the Cartography
Center is to provide a full range of maps, geographic analysis, and research in
support of the Agency, the White House, senior policymakers, and the IC at large.
Its chief objectives are to analyze geospatial information, extract intelligence-related
geodata, and present the information visually in creative and effective ways for
maximum understanding by intelligence consumers.
On 11 July 1941, President Franklin D. Roosevelt established the United
States’ first peacetime, nondepartmental intelligence organization, the Office
of the Coordinator of Information (COI), and authorized it to collect and
analyze all information and data relevant to national security. COI, headed
by William J. Donovan, reported directly to the President. Donovan recruited
the best and the brightest from universities, businesses, and law firms
focused on foreign affairs or with experience abroad. One of those recruited
as a map consultant was 26-year-old Arthur H. Robinson, a graduate student
who had recently begun working on his Ph.D. in geography. He started in
the Geographic Division of the COI’s Research and Analysis Branch on
16 October 1941 and shortly thereafter produced its first map and was
asked to start the Cartography Section. This marked the inception of CIA’s
present-day Cartography Center.
After the Pearl Harbor attack on 7 December 1941, COI expanded rapidly
and its maps began to circulate widely. Robinson was joined by geographer
Robert Voskuil, and the two focused on recruiting staff, procuring equipment, and
developing training procedures. By 1 February 1942, the Cartography Section was
fully operational, with Robinson serving as its chief. The Map Information Section
was added to procure commercial maps, for use by cartographers and
to reproduce for policymakers.
With wartime needs requiring its expansion, COI grew from an office
into America’s first intelligence agency and was replaced by the Office of
Strategic Services (OSS) on 13 June 1942. To satisfy a dramatic increase in
the demand for customized thematic maps for the President, Joint Chiefs of
Staff (JCS), Joint Army Navy Intelligence Studies (JANIS), Board of Economic
Warfare, and COI, the Cartography Section added 28 geographers by the
end of 1942. At that time, there were no cartographers as we know them
today—so Robinson recruited geographers with an interest in mapping,
and they learned on the job. Robinson developed a unique system of map
production to operate in the field of intelligence, and it evolved rapidly to
improve map quality and production efficiency.
In March 1943, the Topographic Models Section was added, and the three
sections—Cartography, Map Information, and Topographic Models—formed the
new Map Division. Geographers and cartographers amassed what would be the
largest collection of maps in the world and produced strategic maps and 3D plaster
terrain models in support of strategic studies and military operational plans for the
JCS, the Office of Naval Intelligence, OSS, and the War Department. The Map
Division was intimately involved in the planning strategy of the Allied invasion of
North Africa and Italy. It also assessed the economic and topographic conditions
in other areas vital to the conduct of the war, including in the Asia-Pacific theater.
The JCS called upon cartographers for much of their secret security work concerning
operations and valued cartographers for their support at the Allied conferences.
Serving as the premier source for strategic thematic maps and map
resources, the Cartography and Map Information Sections survived the
abolishment of OSS on 1 October 1945 and were transferred to the
Division of Geography and Cartography in the Department of State (DOS).
The Cartography Section would remain at DOS until 1 July 1947, when
it was transferred to the Central Intelligence Group (CIG), which President
Truman formed in January 1946. Shortly thereafter, CIG gained the status of
a full agency and became the Central Intelligence Agency on 18 September
1947. Serving a unique need with world-class products, Cartography
Center has withstood many reorganizations and name changes in the past
75 years and continues to provide timely and effective map services in
support of a variety of national security topics.
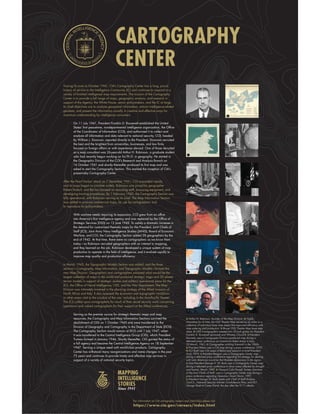
CARTOGRAPHY
CENTER
A
D
G
J
B
E
H
K
C
F
I
L
A) Arthur H. Robinson, founder of the Map Division. B) Highly
innovative for its time, the OSS Theater Map served as an index to a
collection of individual base map sheets that improved efficiency with
map ordering and production. C) Brunei OSS Theater Map base map
sheet. D) OSS Cartographers created twin 50-inch globes for President
Franklin D. Roosevelt (pictured) and Winston Churchill. E) President
Kennedy uses a Cartography Division–produced map during a
televised press conference on Communist Rebel Areas in Laos,
22 March, 1961. F) Cartographer scribing linework in the 1960s.
G) President Nixon uses a CIA map during a press conference, 1970.
H) DCI Bush uses CIA maps of Beirut and Lebanon to brief President
Ford, 1976. I) President Reagan uses a Cartography Center map
during a televised press conference regarding his strategy for dealing
with Latin American countries that threaten democracy in the region.
J) Vice President George H. W. Bush uses a Cartography Center map
during a televised press conference to show areas affected by drought
and famine, March 1985. K) General Colin Powell, former chairman
of the Joint Chiefs of Staff, uses a Cartography Center map during a
press conference regarding Operation Desert Storm, 1991.
L) President George W. Bush meets with Chief of Staff Andrew
Card Jr., National Security Adviser Condoleezza Rice, and DCI
George Tenet at Camp David, the day after the 9/11 attacks.
For information on CIA cartography careers and internships please visit
https://www.cia.gov/careers/index.html
2. In the early 1940s, map layers were drafted by hand using pen and ink on translucent acetate sheets mounted on large
Strathmore boards. They were drafted at larger sizes than needed for the final (typically at a 4:1 ratio) and printed at a reduced
size using photomechanical methods. Standard symbols and labels preprinted on adhesive-backed cellophane sheets called
“stick-up” were applied to maps for uniformity. During this decade, in support of the military’s efforts in World War II (WWII),
cartographers pioneered many map production and thematic design techniques, including the construction of 3D map models.
Cartographic support was key to the US war-planning strategy. In addition to the major events of WWII, during the 1940s,
cartographic production was primarily driven by postwar reconstruction, turmoil in the Middle East, and communist expansion.
1940s
3. The 1950s witnessed improved efficiency in map compilation and construction processes. Map layers were drafted in pen and ink
on vinyl sheets for photomechanical reproduction, and type was handset using precast lead letters. Cartographers then learned
scribing techniques to produce high-quality linework for maps and adapted shaded relief techniques to better depict the nature of
the terrain on maps. As production capabilities improved to turnaround times of less than one day, a small group of cartographers
and graphic designers from the Cartography Division was placed in the Cartographic Support Section to work specifically
on current intelligence—daily analysis prepared for the President and other selected senior US officials. During the 1950s,
cartographic production was primarily driven by the Cold War, the Korean war, the French defeat in Vietnam, the Suez crisis, and
the rise of the Castro regime in Cuba.
1950s
4. In 1965, the Director of Central Intelligence actively encouraged analysts to use visual arts to help explain complex problems.
The Vietnam war also generated an increase in demand for maps. In 1966, a large working group, using a borrowed digitizer,
compiled and digitized coastlines and international boundaries for the entire world—in a single weekend. This digital geographic
database, World Data Bank I (WDBI), contained more than 100,000 vertices that could be projected using the Cartographic
Automatic Mapping (CAM) program. This eliminated the need for hand scribing graticules and coastlines, drastically expediting
map production. During the 1960s, cartographic production was primarily driven by the continuation of the Bay of Pigs invasion,
the Cold War, the Cuban Missile Crisis, the Six-Day War, the Soviet expansion, US involvement in Vietnam, and the advent of
numerous African countries gaining independence.
1960s
5. 1970s
Automation efforts flourished in the 1970s. The development of World Data Bank II (WDBII) was heavily emphasized, and
more detailed data—including those for rivers, roads, railroads, administrative divisions, populated places, and attributes—
were added to the growing database. Electronic typesetting capability was added, and equipment was upgraded to allow
production of separation plates, vugraphs, and slides for publications and briefings. Improved efficiency led to an increase in
research projects, particularly in atlases and street guides. During the 1970s, cartographic production was primarily driven
by the Vietnam war, President Nixon’s visit to China, the Arab oil embargo, the Camp David accords, the Soviet invasion of
Afghanistan, and the Islamic Revolution and the seizure of US Embassy officers in Tehran in November of 1979.
6. 1980s
In the 1980s, CIA’s analytical corps expanded quickly, and the demand for maps used in briefing materials and publications
increased dramatically, with more complex requests and shortened time frames. During this decade, cartography made a
technological transition—from a time-intensive manual system to a computer-automated system that allowed quicker turnaround
times and more innovative ways of presenting intelligence. Cartographers received Intergraph interactive color workstations to
design and construct digital 2D maps and 3D terrain models. A high-speed, photoscribing plotting process was added, and
a modest research program was reinstated. During the 1980s, cartographic production was primarily driven by the Falklands
War, the Iran-Iraq war, the Israeli invasion of Lebanon in 1982, major acts of terror against US Marines and citizens, and US
troop action in Grenada and Panama.
7. 1990s
In the 1990s, the Cartography Center—with the help of advancing computer technology—provided increasingly complex
products, such as 3D terrain perspectives and animation, to support finished intelligence requirements. Dependence on film
decreased as digital files could be printed directly, and as maps were disseminated more widely, customer demand grew
rapidly. Improved computer graphics capabilities spurred greater sophistication and effectiveness in the use of color, symbology,
and design to convey intelligence stories, while the rise of geodata sources and Geographic Information Systems technology led
to advancements in data classification, manipulation, and rendering. During the 1990s, cartographic production was primarily
driven by major humanitarian crises in Africa and Central America, the proliferation of WMDs, the rise of narcotics trafficking,
the Middle East Peace Process, the Persian Gulf war, the breakup of the Communist Bloc, and US peacekeeping operations in
Bosnia and Herzegovina.
8. 2000-10s
With the new millennium, Cartography Center found itself at the center of a digital revolution, and modernized its workflow and
technology toward electronic dissemination, including on web and mobile platforms. For the most part, it has transitioned to the
use of commercially available, off-the-shelf software and to scientific workstations, which handle software and large amounts of
data more efficiently. As Agency products continued to exploit technological breakthroughs, cartographers constantly adapted
workflow to make the best use of available software and new technologies for creating and disseminating products. During these
decades, cartographic production was primarily driven by natural disasters and pandemics resulting in humanitarian crises;
turmoil in Africa, the Middle East, and the former Yugoslavia; nuclear developments in Iran and North Korea; and the continued
spread of terrorism (especially the 9/11 attacks, and the US operations that followed) and the self-proclaimed Islamic State of
Iraq and the Levant.
11
465465
344344
4,7974,797
1,2011,201
44
8585 454454
7,0547,054
3,2543,254
27,19827,198
105,629105,629
21,09321,093
1,0831,083
2828
1,6191,619
20,37920,379
20,52620,526
128,991128,991
23,10123,101
3535
51,14151,141
628628
9696
1,1321,132
1,8541,854
39,17039,170
38,17738,177
4,7544,754
964964
124124
6464
66
11
11
1010
88
99
1414
3737 2626
1616
2020
44
8181
1212
107107
26426455
224224
34342929
1818
5151
8585
2020
42422929
2727
55 77
3131
88
ANGOLA
KENYA
ETHIOPIA
SOMALIA
UG.DEM. REP.
OF THE
CONGO
SUDAN
SOUTH SUDAN
CHADNIGER
EGYPT
MALI
MOROCCO
WESTERN
SAHARA
ALGERIA
LIBYA
MAURITANIA
MOZAMBIQUE MADAGASCAR
NAMIBIA
ZAMBIA
BOTSWANA
CEN.
AFR. REP.
RW.
BURU.
DJIBOUTI
COMOROS
LESO.
SWAZILAND
SIERRA
LEONE
LIBERIA
BENIN
TOGO
GUINEA-
BISSAU
THE
GAMBIA
ZIMBABWE
GHANA
GUINEA
GABON
REP. OF
THE
CONGO
EQUA.
GUI.
ERITREA
MAL.
CAMER.
CÔTE
D’IVOIRE
BURK.
TANZANIA
SOUTH
AFRICA
SENEGAL
NIGERIA
0
0 500 1000 Miles
500 1000 Kilometers
1,6191,619
3737
Elephant population estimatea
(as of 2013)
Elephant range
(as of 2012)
2011 CITES PIKE indexb
(cause of mortality)
Natural death
Natural death/poaching
Poaching
Number of carcasses
(U)
Sulu
Sea
Sulu
Sea
South China
Sea
South China
Sea
Balabac StraitBalabac Strait
Vietnam
Philippines
AMY
DOUGLAS
BANK
ARDASIER
REEFS
Fiery Cross
Reef
Gaven
Reefs
INVESTIGATOR
SHOAL
Itu Aba
Island
JACKSON
ATOLL
Johnson Reef
LOAITA
BANK
LONDON
REEFS
Mischief
Reef
NARES
BANK
NORTH
DANGER
REEF
NORTH
DANGER
REEF REED
TABLEMOUNT
RIFLEMAN
BANK
S P R A T L Y
I S L A N D S
SOUTHAMPTON
REEFS
SOUTHERN
REEFS
Subi
Reef
THITU REEFS
TIZARD BANK
Kennan
Reef
Palawan
ÎLES CATWICK
UNION
REEFS
Philip
pin
e
(K
ala
yaan)
cla
im
B
run
1979
Malay
sian
-claim
ed
co
ntinen
talsh
elflim
it
19
79
M
alay
sian
-claim
ed
co
ntinen
ta
lsh
elflim
it
19
79
M
ala
ysi
an-c
la
im
ed
co
ntinenta
l sh
elf
lim
it
Chineseclaim
Chinese
claim
ms the Paracel and Spratly Islands. How
ever, the
extentoftheirclaim
hasnotbeendelimited.
4,000
meters
200
meters
1,000
meters
2,000
meters
Water Depth
China
Malaysia
Philippines
Taiwan
Vietnam
Spratly Islands Occupation Status
0 25 50 75 100 Kilometers
0 25 50 75 100 Nautical Miles
South
China
Philippine
Sea
Sulu
Sea
Celebes
Sea
Gulf of
Thailand
Gulf of
Thailand
East China
Sea
Malaysia
Malaysia
Vietnam
China Taiwan
Hainan
Dao
I n d o n e s i a
Philippines
BruneiBrunei
Hong Kong
S.A.R.
Hong Kong
S.A.R.Macau
S.A.R.
Laos
Thailand
Cambodia
Thai.
SingaporeSingapore
Area of main map
0 200 400 Kilometers
0 200 400 Nautical Miles
Male
Hulhule
Island
Ibrahim Nasir
International
Airport
MALDIVES
Male
0 50 100 Kilometers
0 50 100 Miles
INDIAN
OCEAN
Equator
Area
of map
(crude/oil products)
(heavy crude)
(oil products)
storage
only
Mediterranean
Sea
Dead
Sea
Buhayrat
al Asad
Tigris
JordanRiver
Ataturk
Barajı
Tigris
Euphrates
Orontes
Euphrates
Euphrates
QaratshukQaratshuk
Lelac
SuwaydiyahSuwaydiyah
‘Ammalah
SufayyahSufayyah
Iraq-Syria-Lebanon pipeline
Ash Shaer
Dayla’
WahhabWahhab
NabajNabaj
Tall
Asfar
Tall
Asfar
TuwaynanTuwaynan
Ghouna
Hasw
Tishrin
Ash Shaykh Mansur
KhirbahKhirbah
Na‘ur
RumaylanRumaylan
Tall GharabTall Gharab
HamzahHamzah
Dayrik (Derik)Dayrik (Derik)
Wuday
‘Ulayyan‘Ulayyan
Turab
Dbissane
Ghawr
Abu
Zhour
Al AkramAl Akram
DerroWadi
‘Ubayd
Al
Kadir
Fahdah
Al
Hawl
Salihiyah
Al JubaysahAl Jubaysah Gbeibe
Baradah
Qutba
KahtaniyahKahtaniyah
Shaykh Sa‘id-
Zurabah-
Babasi
Shaykh Sa‘id-
Zurabah-
Babasi
Marqadah
Cherrife
(Sharifah)
SukhnahSukhnah
Arak
Najib
Al HailAl Hail
Doubayat
(Zubayyat)
Doubayat
(Zubayyat)
Ar
Rasm
Bilas
Ash Shaykh Sulayman Juraybah
Matlutah
Arab Gas
Pipeline
J o r d a n
Lebanon
Israel
West
Banka
I r a q
T u r k e y
Saudi
Arabia
IraqGolan
Heights
Golan
Heights
(Israeli
occupied)
(Israeli
occupied)
Area of
inset map
Beirut
DamascusDamascus
AmmanAmman
¸Himş
Tadmur
Dar‘āDar‘ā
Ţarţūs
Latakia
¸Hamāh¸Hamāh
Aleppo
Kilis
Ar Raqqah
Batman
Mosul
Kīsīk Kūprī
Filfayl
Al Qāmishlī
Al ¸Hasakah
Tall
‘Adas
Tall
‘Adas
Tripoli
‘Adrā
Jandar
Bāniyās
Mu¸hradahMu¸hradah
Hadithah
Al Ma¸haţţ
ath Thānīyah
Al Ma¸haţţ
ath Thānīyah
a
Israeli occupied with current status subject
to the Israeli-Palestinian Interim
Agreement; permanent
status to be determined
through further negotiation.
Boundary representation is
not necessarily authoritative.
0 100 Miles
0
50
50 100 Kilometers
Oilfield
Oil pipeline
Planned oil pipeline
Gasfield
Gas pipeline
Under construction
Planned gas pipeline
Refinery (operational)
Refinery (under construction)
Gas-processing plant
Tanker terminal
Dayr
az
Zawr
Dayr
az
Zawr
Abu
Kamal
Abu
KamalAl Ma¸haţţ
ath Thānīyah
Al Ma¸haţţ
ath Thānīyah
Al MayadinAl Mayadin
HajinHajin
Iraq
Euph
rates
Akash
Ratqah
Al Ward
Barghuth
Al
Ashara
Al
Ashara
TanakTanak
Ahmar
Yunus
Jido
Galban
Hamar
Abu
Hardan
Al
Kishmah
Shdeha
An
Nishan
An
Nishan
Al
Kharratah
Ash
Shula
Al
Mahash
Al
Mahash
Al
Mazraa
Al
Mazraa
Thayyim
At
Tabiyah
Jafrah Yimken
Al Isba
‘Umar‘Umar
Maqta’
ShahilShahil
Jarnof
At Tallah
Ghawari
Al
‘Ayya
RasinJazziyah
Sijan South
TayyaniTayyani
Azraq
MalihQaharQahar
‘Umar North‘Umar North
SabanSaban
Sijan
0 10 20 Miles
0 10 20 Kilometers
(G00335)
794830AI (G00046) 6-11
NORWAYNORWAY
BULGARIABULGARIA
ICELANDICELAND
FINLANDFINLAND
LATVIALATVIA
CRO.CRO.
IRELANDIRELAND
SWEDENSWEDEN
ESTONIAESTONIA
ITALYITALY
POLANDPOLAND
LITHUANIALITHUANIA
CYPRUS
CZECH REP.CZECH REP.
SPAIN
ANDORRA MONACOMONACO
SAN MARINOSAN MARINO
VATICAN CITYVATICAN CITY
TURKEY
ROMANIA
BEL.BEL.
UNITED
KINGDOM
UNITED
KINGDOM
AUSTRIAAUSTRIA
NETH.NETH.
SWITZ.SWITZ.
LIECH.
LUX.
ALB.
FRANCE
DENMARKDENMARK
SLO.SLO.
GERMANY
SLOV.SLOV.
PORTUGALPORTUGAL
G R E E C EG R E E C E
HUNGARY
EU member state in euro zone
EU member state not in euro zone
External Schengen area bordera
NATO Ally
(U)
0 500 Kilometers
0 500 Miles
n
Sea
A r c t i c
Lake Lake
Lake
Gulf of
Great Bear
East
S
Bering
Sea
Okhotsk
O c e a n
Baffin
Kam
a
Peace
a
Great Slave
Volga
Yukon
Sea
extent of sea ice
Denmark Strait
Davis Strait
y
Lake
e
Amur
Vi
lyuy
r
Chukchi
Sea
Sea
i
Ko
lym
a
R
v
Lake
a
Strait
Onega
Aldan
Sukh
ona
Le
na
Barents Sea
e
average minimum
Riv
er
Greenland
Ob'
Sea
Siberian
Don
Beaufort
Kara
Ob
'
Irtysh
Dvina
Bay
N o r t h A t l a n t i c O c e a n
River
Sea
Pechora
Len
a
r
Alaska
Mackenzie
e
Athabasca
Bay
Norwegian
v
Ladoga
Hudson
Yenisey
Vy
ch
eg
da
Labrador
Sea
Laptev
(DENMARK)
Jan Mayen
(NORWAY)
ICELAND
Faroe
Svalbard
SWEDEN
CHI
C A N A D A
Greenland
FINLAND
EST.
LATVIA
NORWAY
Islands
(NORWAY)
UNITED STATES
(NORWAY)
(DENMARK)
R U S S I A
KA
10°C (50°F) isotherm,
July
Saratov
(Søndre Strømfjord)
Anadyr'
Qaanaaq
(Rankin Inlet)
Kangerlussuaq
Verkhoyansk
Riga
Tórshavn
Bay
Khabarovsk
Bay
Noril'sk
Tromsø
Provideniya
Kangiqcliniq
Tasiilaq
River
StockholmOslo
Nome
Magadan
Cambridge
(Scoresbysund)
Repulse Bay
Anchorage
Tallinn
Barrow
Nord
Perm'
Hay
Helsinki
(Godthåb)
Echo Bay
St. Petersburg
(Resolute)
Itseqqortoormiit
Pevek
Juneau
Oymyakon
Inuvik
Moscow
Murmansk
Alert
Kazan'
Watson
Yakutsk
Nuuk
Yellowknife
Arkhangel'sk
Kaujuitoq
(Frederikshåb)
Valdez
Bethel
Okhotsk
Dawson
Tiksi
Longyearbyen
Fairbanks
Novgorod
Iqaluit
Lake
Reykjavík
Samara
Whitehorse Cherskiy
(Thule)
Narsarsuaq
Kodiak
(Ammassalik)
Bjørnøya
Volgogra
Paamiut
Prudhoe
Nizhniy
(Frobisher Bay)
Dikson
FRANZ
Island
NOVAYA
Island
NEW
Island
JOSEF
ISLANDS
ZEMLYA
SIBERIAN
SHETLAND
LAND
QUEEN
ISLANDS
Island
ISLANDS
SEVERNAYA
ELIZABETH
Island
Ellesmere
Wrangel
Baffin
ZEMLYA
Banks
Victoria
Arctic
60
Circle
50
70
60
80
120
90 W
Arctic
80
North
Circle
60
60
70
90 E
120
Pole
Scale 1:39,000,000
-
A i th l E l A P j ti
11
465465
344344
4,7974,797
1,2011,201
44
8585 454454
7,0547,054
3,2543,254
27,19827,198
105,629105,629
21,09321,093
1,0831,083
2828
1,6191,619
20,37920,379
20,52620,526
128,991128,991
23,10123,101
3535
51,14151,141
628628
9696
1,1321,132
1,8541,854
39,17039,170
38,17738,177
4,7544,754
964964
124124
6464
66
11
11
1010
88
99
1414
3737 2626
1616
2020
44
8181
1212
107107
26426455
224224
34342929
1818
5151
8585
2020
42422929
2727
55 77
3131
88
ANGOLA
KENYA
ETHIOPIA
SOMALIA
UG.DEM. REP.
OF THE
CONGO
SUDAN
SOUTH SUDAN
CHADNIGER
EGYPT
MALI
MOROCCO
WESTERN
SAHARA
ALGERIA
LIBYA
MAURITANIA
MOZAMBIQUE MADAGASCAR
NAMIBIA
ZAMBIA
BOTSWANA
CEN.
AFR. REP.
RW.
BURU.
DJIBOUTI
COMOROS
LESO.
SWAZILAND
SIERRA
LEONE
LIBERIA
BENIN
TOGO
GUINEA-
BISSAU
THE
GAMBIA
ZIMBABWE
GHANA
GUINEA
GABON
REP. OF
THE
CONGO
EQUA.
GUI.
ERITREA
MAL.
CAMER.
CÔTE
D’IVOIRE
BURK.
TANZANIA
SOUTH
AFRICA
SENEGAL
NIGERIA
0
0 500 1000 Miles
500 1000 Kilometers
)
1,6191,619
3737
Elephant population estimatea
(as of 2013)
Elephant range
(as of 2012)
2011 CITES PIKE indexb
(cause of mortality)
Natural death
Natural death/poaching
Poaching
Number of carcasses
(U)