Recommended

Recommended
More Related Content
What's hot
What's hot (18)
Similar to Automation of analytical instruments
Similar to Automation of analytical instruments (20)
Recently uploaded
Recently uploaded (20)
Automation of analytical instruments
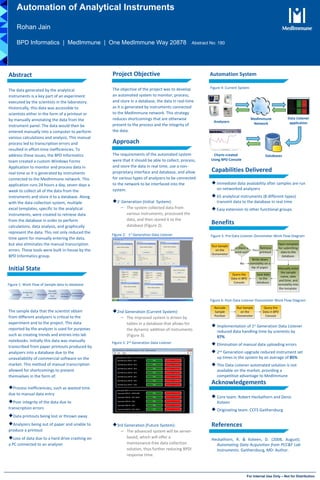
- 1. For Internal Use Only – Not for Distribution Benefits Implementation of 1st Generation Data Listener reduced data handling time by scientists by 97% Elimination of manual data uploading errors 2nd Generation upgrade reduced instrument set up times in the system by an average of 85% This Data Listener automated solution is not available on the market, providing a competitive advantage to MedImmune Automation System Capabilities Delivered Immediate data availability after samples are run on networked analyzers 65 analytical instruments (8 different types) transmit data to the database in real time Easy extension to other functional groups Automation of Analytical Instruments Rohan Jain BPD Informatics | MedImmune | One MedImmune Way 20878 Abstract No: 180 Abstract The data generated by the analytical instruments is a key part of an experiment executed by the scientists in the laboratory. Historically, this data was accessible to scientists either in the form of a printout or by manually annotating the data from the instrument panel. The data would then be entered manually into a computer to perform various calculations and analysis. This manual process led to transcription errors and resulted in effort-time inefficiencies. To address these issues, the BPD Informatics team created a custom Windows Forms Application to monitor and process data in real-time as it is generated by instruments connected to the MedImmune network. This application runs 24 hours a day, seven days a week to collect all of the data from the instruments and store it to a database. Along with the data collection system, multiple excel templates, specific to the analytical instruments, were created to retrieve data from the database in order to perform calculations, data analysis, and graphically represent the data. This not only reduced the time spent for manually entering the data, but also eliminates the manual transcription errors. These tools were built in-house by the BPD Informatics group. Initial State The sample data that the scientist obtain from different analyzers is critical to the experiment and to the project. This data reported by the analyzer is used for purposes such as creating trends and entries into lab notebooks. Initially this data was manually transcribed from paper printouts produced by analyzers into a database due to the unavailability of commercial software on the market. This method of manual transcription allowed for shortcomings to present themselves in the form of: Process inefficiencies, such as wasted time due to manual data entry Poor integrity of the data due to transcription errors Data printouts being lost or thrown away Analyzers being out of paper and unable to produce a printout Loss of data due to a hard drive crashing on a PC connected to an analyzer Project Objective The objective of the project was to develop an automated system to monitor, process, and store in a database, the data in real-time as it is generated by instruments connected to the MedImmune network. This strategy reduces shortcomings that are otherwise present to the process and the integrity of the data. Approach The requirements of the automated system were that it should be able to collect, process, and store the data in real time, use a non- proprietary interface and database, and allow for various types of analyzers to be connected to the network to be interfaced into the system. 1st Generation (Initial System): ‒ The system collected data from various instruments, processed the data, and then stored it to the database (Figure 2). 2nd Generation (Current System): ‒ The improved system is driven by tables in a database that allows for the dynamic addition of instruments (Figure 3). 3rd Generation (Future System): ‒ The advanced system will be server- based, which will offer a maintenance-free data collection solution, thus further reducing BPDI response time. Figure 4: Current System Acknowledgements Core team: Robert Heckathorn and Deniz Koteen Originating team: CCFS Gaithersburg References Heckathorn, R. & Koteen, D. (2008, August). Automating Data Acquisition from PCC&F Lab Instruments. Gaithersburg, MD: Author. Figure 2: 1st Generation Data Listener Figure 1: Work Flow of Sample data to database Samples Sample Run on Instruments Print Outs Check For Mistakes Manually enter data from printouts Upload Data to Database Figure 5: Pre-Data Listener Osmometer Work Flow Diagram Figure 6: Post-Data Listener Osmometer Work Flow Diagram Analyzers Databases MedImmune Network Figure 3: 2nd Generation Data Listener Charts created Using BPD Console Data Listener application