FISH Spot Counting Study Compares Manual vs. Semi-Automatic Methods
1. Introduction
Fluorescent in situ hybridization (FISH) is a cytogenetic technique that
uses fluorescently labeled probes to detect chromosomal
abnormalities. In situ hybridization was first used in the 1960s, and the
use of fluorescent probes quickly followed (Rudkin and Stollar, 1977).
A fluorescently labeled probe is designed to attach to a particular area
of a chromosome. Its presence then signifies the presence of the gene
located in that area, appearing as colored dots among the also
fluorescently stained cell background (Carothers, 1994). Trained
technologists can detect chromosomal abnormalities like
translocations, inversions, duplications and deletions. Unlike
conventional cytogenetic analysis, results can be obtained quickly,
leading to less parental anxiety in the case of prenatal samples and
speeding up diagnosis and treatment. With the widespread adoption
and popularization of the FISH, products have emerged to aide this
technique. Namely, automated spot counting software has been
developed by a number of manufacturers in an effort to assist
technologists and increase efficiency (Vrolijk, 1996; Zhou, 2007). Much
of the literature searched related to FISH spot counting systems were
published in the early to mid-2000s during the peak of its flourish (van
der Logt, 2015). The automated BioView Duet counting system was
compared to typical manual scoring using a BCR/ABL dual-fusion
probe on chronic myeloid leukemia (CML) specimens to evaluate for
minimal residual disease. It has been concluded that the Duet system
appears to be more sensitive and cost-effective than manual scoring
for CML FISH specimens (Knudson, 2007). The aim of this study is to
determine whether a semi-automatic FISH spot-counting system will
be more time-efficient than manual spot-counting. The hypothesis for
this study is that manual spot-counting will prove more time-efficient.
Efficiency and turnaround times are important metrics for laboratory,
as faster diagnosis could lead to faster treatment or a wider array of
decisions. Moreover, financially determining efficiency could lead to
allocation of resources in different areas. Fully automatic spot-
counting systems are a significant monetary investment, but semi-
automatic systems may be a viable, cost-saving alternative to fully
automatic systems if they prove more efficient than manual
technologist scoring.
Discussion
The study was designed into three major parts with three trials for the
first two parts and two trials for the last part. The first section, semi-
automated FISH counting, relied solely on the system for signal analysis
with minor interactive correction as needed. The second section was
conducted solely using manual counting (Ravkin, 1999). The last part of
the study combined both methods (conjugated method) to evaluate the
possibility of obtaining an optimal result. A total of 314 nuclei were
scanned and analyzed for the first two parts of the experiment, and
another 200 nuclei were scored for the last section. The hypotheses of
the study was that the semi-automated FISH counting technique is more
efficient and the conventional FISH counting technique is superior in
terms of accuracy.
As seen in Tables 1, there was a significant deviation in the semi-
automated counts. Using manual counts as the benchmark, 73.2% of the
signal patterns were 2R0G. Semi-automated counts for 2R0G for the
same slide were 61.3%, a difference of 11.9%. This is 6.9% above the
standard cutoff of 5%, and thus a statistically significant error. This error
is attributed to a technical limitation of the system when reading
Spectrum Orange signals; CCD camera sensitivity and uncorrected
autofluorescence are known culprits. Another likely source for errors is
poor probe quality, a result of non-ideal hybridization efficiency (De
Solórzano, 1998). This causes high background noise or weak signals.
Misclassification of artefactual organic residues - often called debris –
can be misinterpreted as FISH signals as well (Netten, 1997). Systematic
deviations such as overlapping signals, signals with irregular size and
shape (due to different condensation states), or out-of-focus images
contribute to error as well. All of these may occur if they were not
completely removed in the earlier exclusion step. Less than 5%
disagreement between semi-automated and manual scoring was
achieved for the rest of signal patterns.
The manual FISH counts determine the benchmark for accuracy,
presuming that the error due to the technician is minimized. Running
manual counts in triplicate and with different technicians minimizes this
error. Manual counts were obtained more quickly than with the semi-
automated system (26 min vs. 72 min) (Table 1). However, this result may
be misleading since 45 minutes were required for the technician to
become familiarized with the system. Adjusting for this difference makes
the times about the same, but this can change depending on the system
and the technician. Further experiment is needed in order to verify the
efficiency of the semi-automated counting result. When combining both
methods, the accuracy of the quantitated signals was significantly
increased, resulting in only a 0.1% difference for the 2R0G signal pattern
– down from the initial disagreement of 11.9%.
Carothers, A. D. (1994). Counting, measuring, and mapping in fish‐labelled cells: Sample size
considerations and implications for automation. Cytometry, 16(4), 298-304.
De Solórzano, C. O., Santos, A., Vallcorba, I., Garcia-Sagredo, J. M., & del Pozo, F. (1998).
Automated FISH spot counting in interphase nuclei: Statistical validation and data correction.
Cytometry, 31(2), 93-99.
Knudson, R., Shearer, B., & Ketterling, R. (2007). Automated Duet spot counting system and manual
technologist scoring using dual-fusion fluorescence in situ hybridization (D-FISH) strategy:
Comparison and application to FISH minimal residual disease testing in patients with chronic myeloid
leukemia. Cancer Genetics and Cytogenetics, 175(1), 8-18.
Netten, H., Young, I. T., van Vliet, L. J., Tanke, H. J., Vroljik, H., & Sloos, W. C. (1997). FISH and
chips: automation of fluorescent dot counting in interphase cell nuclei. Cytometry, 28(1), 110.
Prins, M. J. D., Ruurda, J. P., van Diest, P. J., van Hillegersberg, R., & ten Kate, F. J. W. (2013).
Evaluation of the HER2 amplification status in oesophageal adenocarcinoma by conventional and
automated FISH: a tissue microarray study. Journal of clinical pathology, jclinpath-2013.
Ravkin, I., & Temov, V. (1999, June). Automatic counting of FISH spots in interphase cells for
prenatal characterization of aneuploidies. In BiOS'99 International Biomedical Optics Symposium (pp.
208-217). International Society for Optics and Photonics.
Rudkin, G. T. and Stollar, B. D. (1977). High resolution detection of DNA RNA hybrids in situ by
indirect immunofluorescence. Nature 265,472 -473.
van der Logt, E. M., Kuperus, D. A., van Setten, J. W., van den Heuvel, M. C., Boers, J. E., Schuuring,
E., & Kibbelaar, R. E. (2015). Fully Automated Fluorescent in situ Hybridization (FISH) Staining and
Digital Analysis of HER2 in Breast Cancer: A Validation Study. PloS one, 10(4), e0123201.
Vrolijk, H., Sloos, W. C., van de Rijke, F. M., Mesker, W. E., Netten, H., Young, I. T., ... & Tanke, H.
J. (1996). Automation of spot counting in interphase cytogenetics using brightfield microscopy.
Cytometry, 24 (2), 1996, p. 158-166.
Zhou, Z., Pons, M. N., Raskin, L., & Zilles, J. L. (2007). Automated image analysis for quantitative
fluorescence in situ hybridization with environmental samples. Applied and environmental
microbiology, 73(9), 2956-2962.
Materials and Methods
The system used for FISH counting consists of: a fluorescence
microscope (Olympus BX51), conductive image capturing system,
processing and analysis software. The major components of the
microscope used in the experiment included a scanning stage, a five
position objective rotor and a five position filter rotor. The automated
FISH counting and analysis was performed using supervised
automated scoring with the CytoVision Version 7.4 digital platform
(Leica Microsystems Inc., Buffalo Grove, IL). The CEPXY-ENG assay
(numerical probe) was used for this study to determine signal patterns,
which were defined as 1R1G, 1R0G, 2R0G, 2R1G, 3R0G before the
image capturing and analysis process (Table 1). The FISH signals were
scored and analyzed through a triple-band filter - DAPI, Spectrum
Orange for the chromosome X probe and Spectrum Green for
chromosome Y probe. The probe separation was set as 1.2 um
(default). The primary objective slides were scanned at 10x
magnification in the DAPI channel of the fluorescence microscope to
check the overall cell distribution on the specimen. Then, a region of
interest (ROI) was selected at 60X magnification and all fluorescent
signals were measured for signal intensity. The red and green spots
were segmented automatically. Background correction was performed
for all the signals obtained from these channels. Captured images
from different focus planes were combined into a composite image.
Based on the density appearance under 60X magnification (average of
20 cells/image), ten images with combined focus planes were captured
in order to obtain and count 314 nuclei in total for automated counting
and analysis. The signals with low intensities in the TRITC and FITC
channel due to nonspecific backgrounds were defined as zero; nuclei
that did not emit any red and green chromatic signals, or the nuclei
with single green signal, along with auto-fluorescing cells were
excluded from the system; overlapping signals or signals with
irregular size and shape due to a different condensation state of the
chromatin or due to the sample preparation were excluded from
selection, so as the cells without clearly defined borders. The time
needed for scanning each region of interest was recorded and the total
time period used for the entire process was recorded post experiment.
Results References
The same signal patterns were applied to all trials: 1R1G, 2R0G, 1R0G,
2R1G, and 3R0G. In trial 1, a total of 132 nuclei were scored, with a
result of 28% 1R1G, 61.4% 2R0G, and 10.6% 1R0G signal patterns. An
amount of 103 cells were selected for trial 2, and 18.4% 1R1G, 63.1%
2R0G, 18.4% 1R0G were obtained. With a total of 79 cells chosen,
31.6% showed 1R1G, 59.5% showed 2R0G, and 8.9% showed 1R0G.
The average percentages of different signal patterns for three trials
calculated were: 26% 1R1G, 61.3% 2R0G, and 12.6% 1R0G. The time
used for each trial were recorded to be 45 minutes, 20 minutes and 7
minutes respectively, and the total time spent on semi-automated
FISH counting was 72 minutes (Table 1). The same 314 nuclei were
used for manual scoring. The percentages for signal patterns of 1R1G,
2R0G, and 1R0G in trial 1 were 29.5%, 68.9%, and 1.5% respectively,
21.4%, 78.6%, 0 in trial 2, and 26.6%, 72.2%, 1.3% in trial 3. An average
of 25.8%, 73.2%, and 0.93% for signal patterns of 1R1G, 2R0G and
1R0G were generated respectively. The time used for the three trials
were 12 minutes, 9 minutes, and 5 minutes, totaling 26 minutes for the
manual FISH counting process.
The accuracy of semi-automated FISH counting was determined by
measuring the difference observed from trials that had been verified
manually. Semi-automated FISH scoring produced the following
ratios: 26% 1R1G, 61.3% 2R0G. Manual FISH scoring showed: 12.6%
1R0G, and 25.8% 1R1G, 73.2% 2R0G, 0.93% 1R0G. The disagreement
between semi-automated and manual counting systems for 1R1G,
2R0G, and 1R0G were 0.2%, 11.9%, and 11.67% respectively.
ISSUES RELEVANT TO FISH SEMI-AUTOMATED SPOT COUNTING SYSTEM
Ken Sterns, Angela Teng, Jiaqi Chen, Cristina Garcia, Maria Valencia, Roberto Guajardo, Dominique Cline, Crystal Lee, Victoria
Nettles, Sylvia Wong, Ming Zhao, and Jun Gu
University of Texas MD Anderson, School of Health Professions
Trials Manual Count: 314 cells (104 cells/trial)
(Internal Control)
Semi-Automated Count: 314 cells
(104cells/trial)
Semi-Automated + Manual: 200 cells
(66 cells/trial)
Signal
Patterns
1R1G 2R0G 1R0G Time
(min)
1R1G 2R0G 1R0G Time
(min)
1R1G 2R0G 1R0G Time
(min)
Trial 1 39(29.5%) 91(68.9%) 2(1.5%) 12 37(28%) 81(61.4%) 14(10.6%) 45 22(31.4%) 47(67.1%) 1(1.4%) 22
Trial 2 22(21.4%) 81(78.6%) 0 9 19(18.4%) 65(63.1%) 19(18.4%) 20 13(20.6%) 49(77.7%) 1(1.6%) 19
Trial 3 21(26.6%) 57(72.2%) 1(1.3%) 5 25(31.6%) 47(59.5%) 7(8.9%) 7 16(23.9%) 50(74.6%) 1(1.5%) 15
Total 82(26.1%) 229(72.9%) 3(0.96%) 26 81(25.8%) 193(61.5%) 40(12.7%) 72 51(25.5%) 146(73%) 3(1.5%) 56
Ave. 27(25.8%) 76(73.2%) 1(0.93%) 8.7 27(26%) 64(61.3%) 13(12.6%) 24 17(25.3%) 48(73.1%) 1(1.5%) 18.6
%diff.
from
Manual
0.2% 11.9% 11.67% 46 min
longer
0.5% 0.1% 0.57% 30 min
longer
Ave. diff. from Manual: 7.9% Ave. diff. from Manual: 0.39%
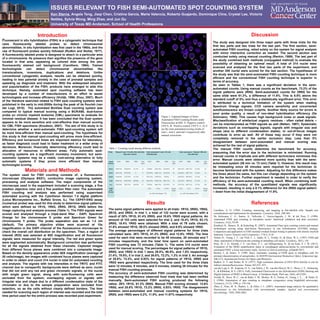
Figure 1. Captured Images of Semi-
Automated FISH Counting Results under
Fluorescence at 60X. A. Negative control:
CEP X; B. Positive control: CEP Y; C, D, E
are the semi-automated scoring results of
trial 1, trial 2, and trial 3 respectively after
manual corrections.
Table 1. Counting result among different methods.