
Recommended
More Related Content
Viewers also liked
Viewers also liked (14)
Similar to Bio 3A POSTER- The effect of ethanol on CO₂ production in mice Mus musculus
Similar to Bio 3A POSTER- The effect of ethanol on CO₂ production in mice Mus musculus (20)
Bio 3A POSTER- The effect of ethanol on CO₂ production in mice Mus musculus
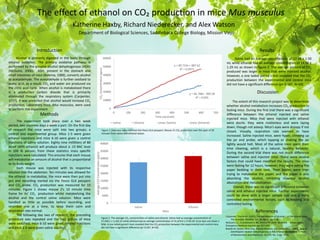
- 1. The effect of ethanol on CO₂ production in mice Mus musculus Katherine Haxby, Richard Niederecker, and Alex Watson Department of Biological Sciences, Saddleback College Biology, Mission Viejo Introduction Methods Results Discussion Figure 1. Data was collected from the Pasco GLX passport, Mouse 2’s CO2 production over the span of 10 minutes from saline and ethanol values. 0 5000 10000 15000 20000 25000 30000 35000 40000 Saline Ethanol AverageCO2Concentration(ppm) Mice y = 46.768x - 969.58 R² = 0.995 y = 80.724x + 887.62 R² = 0.9971 0 10000 20000 30000 40000 50000 60000 0 100 200 300 400 500 600 700 CO2Concentration(ppm) Time (seconds) Saline Ethanol Linear (Saline) Linear (Ethanol) Alcohol is primarily digested in the body through ethanol oxidation. The primary oxidative pathway is performed by the enzyme alcohol dehydrogenase (ADH) (McGuire, 2006). ADH, present in the stomach and small intestines of mice (Bolema, 1989), converts alcohol to acetaldehyde. The acetaldehyde is further oxidized to acetic acid, as a result, CO2 and water are produced via the citric acid cycle. When alcohol is metabolized there is a production carbon dioxide that is primarily eliminated through the respiratory system (Carpenter, 1937). It was predicted that alcohol would increase CO2 production. Laboratory mice, Mus musculus, were used to perform this experiment. Figure 2. The average CO2 concentration of saline and ethanol. Saline had an average concentration of 27,439.1 ± 3,165.25 while ethanol had an average concentration of 31,674.4 ± 2734.30. Error bars are mean ± SEM. A one tailed paired t-test revealed that the CO2 production between the experimental and control mice did not have a significant difference (p= 0.187, N=10). The experiment took place over a two week period, two separate days a week a part. On the first day of research the mice were split into two groups; a control and experimental group. Mice 1-5 were given ethanol injections and mice 6-10 were given a control injections of saline solution. Eighty nine milliliters of 80 proof (40% ethanol) will produce about a .15 BAC level in 100 lb person; from these statistics mass specific injections were calculated. This ensures that each mouse will metabolize an amount of alcohol that is proportional to its body weight. Each mouse was injected with its respective solution into the abdomen. Ten minutes was allowed for the ethanol to metabolize, the mice were then put into jars and recording started via the Pasco GLX passport and CO2 probe. CO2 production was measured for 10 minutes. Figure 1 shows mouse 2’s 10 minute time frame for its’ CO2 production whilst metabolizing the alcohol and the control saline solution. Mice were handled as little as possible before recording, and recorded one at a time, to keep them calm and respiration rate normal. The following day two of research, the preceding procedure was repeated and the two groups of mice were switched; mice 6-10 were given ethanol injections and mice 1-5 were given saline solution. Saline had an average concentration of 12.98 ± 1.50 mL while ethanol had an average concentration of 14.98 ± 1.29 mL as shown in figure 2. The average amount of CO2 produced was larger in mice that were injected alcohol. However, a one tailed paired t-test revealed that the CO2 production between the experimental and control mice did not have a significant difference (p= 0.187, N=10). References The extent of this research project was to determine whether alcohol metabolism increases CO2 production in fasting mice. During the first trial there was a significant difference between the ethanol injected and saline injected mice. Mice that were injected with ethanol were docile, they were motionless and were laying down, though not asleep. Mice’s eyes were droopy if not closed. Visually, respiration rate seemed to have increased. Saline injected mice, were hyper, climbing up the jar and probe; which tapping or shaking the jar lightly would halt. Most of the saline mice spent their time cleaning, which is a natural, healthy behavior. During the second trial there was not much difference between saline and injected mice. There were several factors that could have modified the results. The mice were fasting for 12 hours, however, they were eating the paper bedding in their tank. Their bodies were then trying to metabolize the paper, and the paper is also absorbing the alcohol, inhibiting maximal alcohol absorption and metabolization. Overall, there was no significant difference between saline and ethanol injected mice. Further experiments could be done with a larger sample size and a more controlled environmental factors, such as housing and controlled fasting. Carpenter, Thorne M. (1937). The Metabolism of Alcohol in the Animal Body. The Scientific Monthly. Vol. 45, No 1, pp 5-18. McGuire L.C., Cruickshank A. M., Munro P.T. 2006. Alcoholic Ketoacidosis, Emergency Medicine Journal. pp. 417-420 Boleda M. Dolors, Pere Julia, Alberto Moreno, and Xavier Pares (1989). Role of Extrehepatic Alcohol Dehydrogenase in Rat Ethanol Metabolism. Achives of Biochemistry and Biophysics Vo.274, No. 1: pp. 74-81