1. Reed Carver
Phys 380
Dr. Enrique Gomez
12/16/16
Arduino Eclipse Data Logging Shield Project
Hypothesis:
It is believed that the ideal altitude to measure cosmic rays in the atmosphere changes
when the temperature of the atmosphere drops. Ideally the ideal altitude to measure cosmic rays
in the atmosphere would drop when the temperature in the atmosphere drops since the area of
gases decrease as the temperature drops and since the atmosphere is made entirely of gas the
atmosphere itself would shrink i.e. the circumference of the atmosphere gets smaller and therefor
the ideal altitude to measure cosmic rays would drop as well.
Problem Statement:
A weather balloon will be sent into the atmosphere to measure cosmic rays at multiple
altitudes during the solar eclipse next year to determine whether this hypothesis is true. To do
this we will want to redesign the equipment that has been used to measure cosmic rays in the
atmosphere in the past so that the equipment in the weather balloon can more accurately measure
cosmic rays along with accurately measuring temperature in the atmosphere. We also want the
equipment in the weather balloon to be able to capture video and picture data as well. We will
ideally want to make the equipment as small as possible to stay under a payload of 5lbs to adhere
to FCC regulations. We will also probably want to upgrade the microcontroller that will be used
2. to connect all the measurement equipment together so that it can store more data and so that it
will ideally have a smaller footprint than the final design of the past to measure cosmic rays. The
project must also stay under a total cost of approximately $500 dollars. Due to time constraints
on the project, designing the weather balloon equipment to capture video this semester will not
be possible unfortunately. Redesigning the equipment that measures and records the desired data
is what will be done this semester and is what will be explained within this paper. A new data
logging shield with an included GPS module along with multiple temp sensors that will measure
temperature independent of each other is what is being added to the measurement equipment this
semester. Adding these components to the current measurement equipment will provide more
relevant and accurate data.
Relevant Background Theory
To understand what this experiment is trying to accomplish one must first understand
cosmic rays. Cosmic rays are one of billions of different types of particles that constantly
bombard the earth from outer space. This phenomenon was first discovered in 1912 by Victor
Hess, who sent a balloon 5000m up into the atmosphere to measure the rate of the production of
ions, a charged atom or molecule, in the air. From this experiment, he found that the rate of
ionization increased by a factor of 3 at 5000m into the atmosphere. From this, he concluded that
the earth was being bombarded by radiation, which are high energy particles that cause
ionization. The type of radiation that Hess discovered was eventually named cosmic rays by the
1920’s. The types of particles that make up cosmic rays are predominantly the nuclei of common
elements found in space such as hydrogen and uranium, with energies ranging from ~1 GeV
(109 eV) to energies beyond 100 EeV. The particles that make up the nuclei of these common
3. elements include: the positron, the muon, and the charged pion. These particles that make up
cosmic rays are traveling almost at the speed of light and it’s so close the speed of light that if
one were to shoot a beam of light and a cosmic ray over the same distance and measure how long
it took it one to make it to the finish the cosmic ray would only lose the race by one-hundredth of
a diameter of a human hair. Cosmic rays have been observed coming from all parts of the sky
with equal intensities all at low energy levels. One issue with measuring cosmic rays however is
that they decay at a very rapid rate at higher energy levels. For instance, at cosmic ray above 100
Gev decays at a rate of approximately ~1 particle m-2s-1 while a cosmic ray at an energy around 3
Pev decays at approximately ~1 particle m-2year-1, which is a big difference. This makes it
particularly difficult to detect all types of cosmic rays with a Geiger counter. One can accurately
detect low energy cosmic rays with a Geiger counter however which still tells us a lot of
information about what is going on in the atmosphere of earth. From measuring the low energy
cosmic rays one can figure out a little bit of what is going on with the high energy cosmic rays.
In order to do this, one must understand how the high energy cosmic rays turn into low energy
cosmic rays.
As high energy cosmic rays from outer space bombard the earth and enter its atmosphere
they interact with the particles that make up the earth’s atmosphere. As the cosmic rays interact
with the particles in the earth’s atmosphere and produce secondary particles that will either
interact with more gas that makes up the earth’s atmosphere or decay away. The number of
cosmic ray particles and photons increases from these interactions with the photons, electrons,
and positrons of the gas that make up the earth’s atmosphere. This phenomenon causes a
“shower” or “cascade” effect where the initial interaction of the high energy cosmic ray with the
gas that makes up the earth’s atmosphere causes numerous low energy cosmic rays to be
4. produced in a “shower” like or “cascading” like manner where there is a very high concentration
of low energy cosmic rays shortly after the initial interaction between the gas in the atmosphere
and the high energy cosmic rays. These low energy particles that come out of this phenomenon
no longer have enough energy to interact with the gas in the atmosphere anymore and eventually
decay away. So since one can measure low energy particles simply with a Geiger counter one
can find the altitude at which there is a very high concentration of low energy cosmic ray
particle. The altitude at which the concentration of low energy cosmic ray particles reaches a
peak is called the foster maximum. (Watson & Watson, 2016)
These cosmic rays have intrigued some at the physics department at WCU. In previous
years, the physics department, Dr. Gomez, and some WCU students have sent weather balloons
into the atmosphere with equipment to measure cosmic rays. Initially Dr. Gomez and the WCU
students involved with the project sent the weather balloon up into the atmosphere to study
Terrestrial Gamma Ray Flashes, or TGFs, which are brief pulses of gamma radiation which are
caused by cosmic rays bombarding the earth and form lower in the atmosphere around the lower
troposphere. The troposphere is also where thunderstorms occur and other experiments that
measured TGFs seem to suggest a correlation between thunderstorms and TGFs. So, that is
exactly what Dr. Gomez and the WCU students set out to try and discover. They did this by
coming up with an Arduino board that had a Geiger counter, a barometric pressure and
temperature sensor, a camera, and a data logging shield to record all the information the recorded
by the sensors and then packaged the equipment in a water proof box that would also float and
sent their Arduino creation into the atmosphere to measure TGF’s. From this experiment a lot
was learned about cosmic rays such as the foster maximum altitude. However, some of the
equipment was damaged from this and some of the sensors quit working during the experiment
5. such as the camera or gave faulty measurements such as the barometric pressure sensor. Given
what happened to the equipment from this experiment it has been decided that that the equipment
needs to be redesigned to more accurately measure and record data during the solar eclipse next
year for this project. (Gomez, 2013)
Procedure
First, Dr. Gomez and I met up and discussed what information that we would need to
accurately understand what is going on in the atmosphere during the solar eclipse. After some
discussion, we settled on recording temperature readings, cosmic ray detections, and GPS
location with accurate time stamps. I then analyzed the old equipment that was used to measure
TGFs in years past to determine what could be reused. I concluded that the barometric pressure
and temperature sensor that was used to measure TGFs in years past could be scrapped since the
barometric pressure and temperature sensor had given faulty data. It was then decided that the
Arduino Uno board and the Geiger counter used in the previous experiment could be reused
since they both still seemed to function properly. Since the barometric pressure and temperature
sensor was soldered to the data logging shield used previously, it was decided that a new data
logging shield with a GPS and temperature sensors should be ordered and added to the Arduino
board and Geiger counter to replace the old data logging shield and barometric pressure and
temperature sensor.
Once what parts were going to be reused and what parts needed to be ordered, coding and
integrating the new parts onto the board began. Integrating the temperature sensors to the board
6. was what was done first. I started by first researching the particular temperature sensors that
were ordered by their make and model so I could understand how they worked. From this I
discovered their data sheets and actually stumbled upon a handy guide on hobbytronics.co.uk to
get the temperature sensors to work on the Arduino board. This guide can be found at
http://www.hobbytronics.co.uk/ds18b20-arduino . After reading and understanding the example
given in the guide I modified the code and the breadboard with the temp sensors on it so that I
could read independent temperature readings for each individual temperature sensor on one input
pin of the Arduino board. This was done by simply adding another temp sensor in series on the
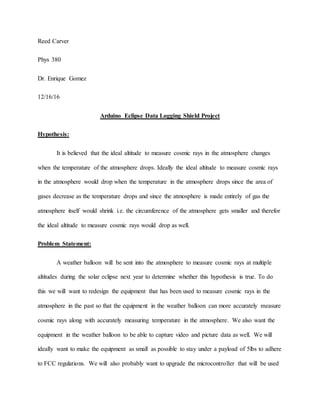
breadboard with another 4.7 kΩ pull up resistor, which can be seen in figure 1, where the red
wire is the data-in for the temp sensors, the orange wire is the GND for the temp sensors, and
purple is the 5v power line. The code was then modified by adding another line in the loop of the
Arduino code that prints the temp for the second temp sensor in series with the first along with
the temp for the first sensor on the serial monitor as well. This modification can be seen in the
Arduino code below.
-figure1
7. #include <OneWire.h>
#include <DallasTemperature.h>
// Data wire is plugged into pin 4 on the Arduino
#define ONE_WIRE_BUS 4
// Setup a oneWire instance to communicate with any OneWire devices
// (not just Maxim/Dallas temperature ICs)
OneWire oneWire(ONE_WIRE_BUS);
// Pass our oneWire reference to Dallas Temperature.
DallasTemperature sensors(&oneWire);
void setup(void)
{
// start serial port
Serial.begin(9600);
Serial.println("Dallas Temperature IC Control Library Demo");
// Start up the library
sensors.begin();
}
void loop(void)
{
// call sensors.requestTemperatures() to issue a global temperature
// request to all devices on the bus
Serial.print(" Requesting temperatures...");
sensors.requestTemperatures(); // Send the command to get temperatures
Serial.println("DONE");
Serial.print("Temperature for Device 1 is: ");
Serial.print(sensors.getTempCByIndex(0)); // Why "byIndex"?
// You can have more than one IC on the same bus.
// 0 refers to the first IC on the wire
Serial.print("Temperature for Device 2 is: ");
Serial.print(sensors.getTempCByIndex(1));
}
(Hobby Tronics)
Once the temperature sensors had been integrated into the board, I then moved onto
adding the GPS data logger shield. To start, I looked for the user’s manual for this particular
shield from ADAfruit. After reading trough the user’s manual, which can be found at https://cdn-
learn.adafruit.com/downloads/pdf/adafruit-ultimate-gps-logger-shield.pdf , and example code on
how to use the GPS module on the data logger that was included within the user’s manual from
ADAfruit, I managed integrate the parsing sketch example from ADAfruit into the temp sensor
code so that the Arduino would print both the GPS data and the temperature data to the serial
8. monitor. The parsing sketch example that I used can be seen starting on page 7.
(Lady ADA, 2016)
// Test code for Adafruit GPS modules using MTK3329/MTK3339 driver
//
// This code shows how to listen to the GPS module in an interrupt
// which allows the program to have more 'freedom' - just parse
// when a new NMEA sentence is available! Then access data when
// desired.
//
// Tested and works great with theAdafruit Ultimate GPS module
// using MTK33x9 chipset
// ------> http://www.adafruit.com/products/746
// Pick one up today at theAdafruit electronics shop
// and help support open sourcehardware & software! -ada
#include <Adafruit_GPS.h>
#include <SoftwareSerial.h>
// If you'reusing a GPS module:
// Connect theGPS Power pin to 5V
// Connect theGPS Ground pin to ground
// If using softwareserial (sketch example default):
// Connect theGPS TX (transmit) pin to Digital 3
// Connect theGPS RX (receive) pin to Digital 2
// If using hardware serial (e.g. Arduino Mega):
// Connect theGPS TX (transmit) pin to Arduino RX1, RX2 or RX3
9. // Connect theGPS RX (receive) pin to matching TX1, TX2 or TX3
// If you'reusing the Adafruit GPS shield, change
// SoftwareSerial mySerial(3, 2); -> SoftwareSerial mySerial(8, 7);
// and make sure the switch is set to SoftSerial
// If using softwareserial, keep this line enabled
// (you can change the pin numbers to match your wiring):
SoftwareSerial mySerial(8, 7);
// If using hardware serial (e.g. Arduino Mega), comment out the
// above SoftwareSerial line, and enable this line instead
// (you can change the Serial number to match your wiring):
//HardwareSerial mySerial = Serial1;
Adafruit_GPS GPS(&mySerial);
// Set GPSECHO to 'false' to turn off echoing theGPS data to theSerial console
// Set to 'true' if you want to debug and listen to the raw GPS sentences.
#define GPSECHO true
// this keeps track of whether we're using theinterrupt
// off by default!
boolean usingInterrupt = false;
void useInterrupt(boolean); // Func prototypekeeps Arduino 0023 happy
void setup()
{
// connect at 115200 so we can read theGPS fast enough and echo without droppingchars
// also spit it out
Serial.begin(115200);
10. Serial.println("Adafruit GPS library basic test!");
// 9600 NMEA is the default baud rate for Adafruit MTK GPS's- some use 4800
GPS.begin(9600);
// uncomment this line to turn on RMC (recommended minimum) and GGA (fix data) including altitude
GPS.sendCommand(PMTK_SET_NMEA_OUTPUT_RMCGGA);
// uncomment this line to turn on only the"minimum recommended" data
//GPS.sendCommand(PMTK_SET_NMEA_OUTPUT_RMCONLY);
// For parsing data, we don't suggest using anything but either RMC only or RMC+GGA since
// theparser doesn't care about other sentences at this time
// Set the updaterate
GPS.sendCommand(PMTK_SET_NMEA_UPDATE_1HZ); // 1 Hz updaterate
// For the parsing code to work nicely and have time to sort thru the data, and
// print it out we don't suggest using anything higher than 1 Hz
// Request updates on antenna status, comment out to keep quiet
GPS.sendCommand(PGCMD_ANTENNA);
// thenice thing about this code is you can have a timer0 interrupt go off
// every 1 millisecond, and read data from theGPS for you. that makes the
// loop code a heck of a lot easier!
useInterrupt(true);
delay(1000);
// Ask for firmware version
mySerial.println(PMTK_Q_RELEASE);
}
// Interrupt is called once a millisecond, looks for any new GPS data, and stores it
SIGNAL(TIMER0_COMPA_vect) {
char c = GPS.read();
// if you want to debug, this is a good time to do it!
11. #ifdef UDR0
if (GPSECHO)
if (c) UDR0 = c;
// writing direct to UDR0 is much much faster than Serial.print
// but only one character can be written at a time.
#endif
}
void useInterrupt(boolean v) {
if (v) {
// Timer0 is already used for millis() - we'll just interrupt somewhere
// in the middle and call the"Compare A" function above
OCR0A = 0xAF;
TIMSK0 |= _BV(OCIE0A);
usingInterrupt = true;
} else {
// do not call the interrupt function COMPA anymore
TIMSK0 &= ~_BV(OCIE0A);
usingInterrupt = false;
}
}
uint32_t timer = millis();
void loop() // run over and over again
{
// in case you are not using theinterrupt above, you'll
// need to 'hand query' theGPS, not suggested :(
if (! usingInterrupt) {
// read data from theGPS in the'main loop'
char c = GPS.read();
// if you want to debug, this is a good time to do it!
if (GPSECHO)
if (c) Serial.print(c);
}
12. // if a sentence is received, we can check the checksum, parseit...
if (GPS.newNMEAreceived()) {
// a tricky thing here is if we print theNMEA sentence, or data
// we end up not listening and catching other sentences!
// so be very wary if using OUTPUT_ALLDATAand trytngto print out data
//Serial.println(GPS.lastNMEA()); // this also sets the newNMEAreceived() flag to false
if (!GPS.parse(GPS.lastNMEA())) // this also sets the newNMEAreceived() flag to false
return; // we can fail to parsea sentence in which case we should just wait for another
}
// if millis() or timer wraps around, we'll just reset it
if (timer > millis()) timer = millis();
// approximately every 2 seconds or so, print out the current stats
if (millis() - timer > 2000) {
timer = millis(); // reset the timer
Serial.print("nTime: ");
Serial.print(GPS.hour, DEC); Serial.print(':');
Serial.print(GPS.minute, DEC); Serial.print(':');
Serial.print(GPS.seconds, DEC); Serial.print('.');
Serial.println(GPS.milliseconds);
Serial.print("Date: ");
Serial.print(GPS.day, DEC); Serial.print('/');
Serial.print(GPS.month, DEC); Serial.print("/20");
Serial.println(GPS.year, DEC);
Serial.print("Fix: "); Serial.print((int)GPS.fix);
Serial.print(" quality:"); Serial.println((int)GPS.fixquality);
if (GPS.fix) {
Serial.print("Location: ");
Serial.print(GPS.latitude, 4); Serial.print(GPS.lat);
Serial.print(", ");
Serial.print(GPS.longitude, 4); Serial.println(GPS.lon);
Serial.print("Location (in degrees, works with Google Maps):");
13. Serial.print(GPS.latitudeDegrees, 4);
Serial.print(", ");
Serial.println(GPS.longitudeDegrees, 4);
Serial.print("Speed (knots):"); Serial.println(GPS.speed);
Serial.print("Angle: "); Serial.println(GPS.angle);
Serial.print("Altitude: "); Serial.println(GPS.altitude);
Serial.print("Satellites: "); Serial.println((int)GPS.satellites);
}
}
}(Lady ADA, 2016)
Once I had integrated both the temp sensors and the GPS data logger to the board I was
ready to integrate the geiger counter. I started off again by researching the particular geiger
counter board that I had. I found another tutorial on how to use that geiger counter with an
Arduino at https://www.cooking-hacks.com/documentation/tutorials/geiger-counter-radiation-
sensor-board-arduino-raspberry-pi-tutorial/#schematic . I then took the code that was provided in
the tutorial and modified it by taking out the parts of the code that send data to LEDs and a liquid
crystal display since they will not be necessary for the purpose of this experiment. My modified
code from the tutorial can be seen below.(Libelium)
//This Sketch is a Geiger counter that will output it’s values to a serial
//monitor
// Conversion factor - CPM to uSV/h
#define CONV_FACTOR 0.00812
// Variables
int geiger_input = 2;
long count = 0;
long countPerMinute = 0;
long timePrevious = 0;
long timePreviousMeassure = 0;
long time = 0;
long countPrevious = 0;
float radiationValue = 0.0;
void setup(){
pinMode(geiger_input, INPUT);
15. Once I had gotten all of the components to work the way I wanted them to separately of
each other, I then combined all three codes together and added logging functionality to the code
so that the data that was read from each sensor could also be recorded on a microSD card along
with being displayed to the serial monitor. This code can be seen below.
// include the library code:
#include <SPI.h>
#include <Adafruit_GPS.h>
#include <SoftwareSerial.h>
#include <SD.h>
#include <avr/sleep.h>
#include <OneWire.h>
#include <DallasTemperature.h>
// Datawire is plugged into pin 4 on the Arduino
#define ONE_WIRE_BUS 4
#define chipSelect 10//Set chip select pin to pin10
int geiger_input = 2;//set the geiger counter data in pin to pin2
SoftwareSerial mySerial(8, 7);//Set the GPS connection pins to pins 7 and 8
// Set GPSECHO to 'false' to turn off echoing theGPS data to theSerial console
// Set to 'true' if you want to debug and listen to the raw GPS sentences
#define GPSECHO false
/* set to true to only log to SD when GPS has a fix, for debugging, keep it false */
#define LOG_FIXONLYtrue
// Conversion factor - CPM to uSV/h
#define CONV_FACTOR 0.00812
Adafruit_GPS GPS(&mySerial);
16. // Setup a oneWire instance to communicate with any OneWire devices
// (not just Maxim/Dallas temperatureICs)
OneWire oneWire(ONE_WIRE_BUS);
// Pass our oneWire reference to Dallas Temperature.
DallasTemperature sensors(&oneWire);
// Variables
long count = 0;
long countPerMinute= 0;
long timePrevious = 0;
long timePreviousMeassure = 0;
long time = 0;
long countPrevious = 0;
float radiationValue = 0.0;
boolean usingInterrupt = false;
void useInterrupt(boolean); // Func prototypekeeps Arduino 0023 happy
// read a Hex value and return thedecimal equivalent
uint8_t parseHex(char c) {
if (c < '0')
return 0;
if (c <= '9')
return c - '0';
if (c < 'A')
return 0;
if (c <= 'F')
return (c - 'A')+10;
}
17. File logfile;
void setup(){
pinMode(geiger_input, INPUT);
digitalWrite(geiger_input,HIGH);
Serial.begin(115200);
// connect at 115200 so we can read theGPS fast enough and echo without droppingchars
// also spit it out
sensors.begin();//Start up temp sensor library
Serial.println("rnUltimate GPSlogger Shield");
// make sure that thedefault chip select pin is set to
// output, even if you don't use it:
pinMode(10, OUTPUT);
/* char filename[15];
strcpy(filename, "GPSLOG00.TXT");
for (uint8_t i = 0; i < 100; i++) {
filename[6] = '0' + i/10;
filename[7] = '0' + i%10;
// create if does not exist, do not open existing, write, syncafter write
if (!SD.exists(filename)) {
break;
}
}*/
/* logfile = SD.open("Eclipse_Log.txt", FILE_WRITE);
18. if( ! logfile ) {
Serial.print("Couldnt create file");
return;
}*/
attachInterrupt(0,countPulse,FALLING);
// 9600 NMEA is the default baud rate for Adafruit MTK GPS's- some use 4800
GPS.begin(9600);
// uncomment this line to turn on RMC (recommended minimum) and GGA (fix data) including altitude
GPS.sendCommand(PMTK_SET_NMEA_OUTPUT_RMCGGA);
// uncomment this line to turn on only the"minimum recommended" data
//GPS.sendCommand(PMTK_SET_NMEA_OUTPUT_RMCONLY);
// For parsing data, we don't suggest using anything but either RMC only or RMC+GGA since
// theparser doesn't care about other sentences at this time
// Set the updaterate
GPS.sendCommand(PMTK_SET_NMEA_UPDATE_1HZ); // 1 Hz updaterate
// For the parsing code to work nicely and have time to sort thru the data, and
// print it out we don't suggest using anything higher than 1 Hz
// Request updates on antenna status, comment out to keep quiet
GPS.sendCommand(PGCMD_ANTENNA);
// thenice thing about this code is you can have a timer0 interrupt go off
// every 1 millisecond, and read data from theGPS for you. that makes the
// loop code a heck of a lot easier!
useInterrupt(true);
delay(1000);
// Ask for firmware version
mySerial.println(PMTK_Q_RELEASE);
19. // see if the card is present and can be initialized:
if (!SD.begin(chipSelect)) { // if you're using an UNO, you can use this line instead
Serial.println("Card failed, or not present");
// don't do anything more:
return;
}
Serial.println("card initialized.");
logfile = SD.open("LOGGER00.TXT", FILE_WRITE);
if( ! logfile ) {
Serial.print("Couldnt create file");
return;
}
Serial.println("Ready!");
}
// Interrupt is called once a millisecond, looks for any new GPS data, and stores it
SIGNAL(TIMER0_COMPA_vect) {
char c = GPS.read();
// if you want to debug, this is a good time to do it!
#ifdef UDR0
if (GPSECHO)
if (c) UDR0 = c;
// writing direct to UDR0 is much much faster than Serial.print
// but only one character can be written at a time.
20. #endif
}
void useInterrupt(boolean v) {
if (v) {
// Timer0 is already used for millis() - we'll just interrupt somewhere
// in the middle and call the"Compare A" function above
OCR0A = 0xAF;
TIMSK0 |= _BV(OCIE0A);
usingInterrupt = true;
} else {
// do not call the interrupt function COMPA anymore
TIMSK0 &= ~_BV(OCIE0A);
usingInterrupt = false;
}
}
uint32_t timer = millis();
void loop() {
// in case you are not using theinterrupt above, you'll
// need to 'hand query' theGPS, not suggested :(
if (! usingInterrupt) {
// read data from theGPS in the'main loop'
char c = GPS.read();
// if you want to debug, this is a good time to do it!
if (GPSECHO)
if (c) Serial.print(c);
}
21. // if a sentence is received, we can check the checksum, parseit...
if (GPS.newNMEAreceived()) {
// a tricky thing here is if we print theNMEA sentence, or data
// we end up not listening and catching other sentences!
// so be very wary if using OUTPUT_ALLDATAand trytngto print out data
//Serial.println(GPS.lastNMEA()); // this also sets the newNMEAreceived() flag to false
if (!GPS.parse(GPS.lastNMEA())) // this also sets the newNMEAreceived() flag to false
return; // we can fail to parsea sentence in which case we should just wait for another
}
if (timer > millis()) timer = millis();
// approximately every 10 seconds or so, print out the current stats
if (millis() - timer > 10000) {
timer = millis(); // reset the timer
File logfile = SD.open("LOGGER00.TXT", FILE_WRITE);
Serial.print("nTime: ");
Serial.print(GPS.hour, DEC); Serial.print(':');
Serial.print(GPS.minute, DEC); Serial.print(':');
Serial.println(GPS.seconds, DEC); //Serial.print('.');
// Serial.println(GPS.milliseconds);
Serial.print("Date: ");
Serial.print(GPS.month, DEC); Serial.print('/');
Serial.print(GPS.day, DEC); Serial.print("/20");
Serial.println(GPS.year, DEC);
Serial.print("Fix: "); Serial.print((int)GPS.fix);
Serial.print(" quality:"); Serial.println((int)GPS.fixquality);
logfile.println("");
logfile.print("nTime: ");
logfile.print(GPS.hour, DEC); logfile.print(':');
logfile.print(GPS.minute, DEC); logfile.print(':');
logfile.println(GPS.seconds, DEC); //logfile.print('.');
23. }
countPerMinute= 6*count;
radiationValue = countPerMinute* CONV_FACTOR;
Serial.print("cpm = ");
Serial.print(countPerMinute,DEC);
Serial.print(" - ");
Serial.print("uSv/h = ");
Serial.println(radiationValue,4);
logfile.print("cpm = ");
logfile.print(countPerMinute,DEC);
logfile.print(" - ");
logfile.print("uSc/h = ");
logfile.print(radiationValue,4);
count = 0;//reset the radiation count
// call sensors.requestTemperatures() to issuea global temperature
// request to all devices on thebus
// Serial.print(" Requesting temperatures...");
sensors.requestTemperatures();// Send the command to get temperatures
//Serial.println("DONE");
Serial.print("Temperature for Device 1 is: ");
Serial.println(sensors.getTempCByIndex(0)); // Why "byIndex"?
// You can have more than one IC on the same bus.
// 0 refers to the first IC on the wire
Serial.print("Temperature for Device 2 is: ");
Serial.println(sensors.getTempCByIndex(1));
logfile.print("Temperature for Device 1 is: ");
logfile.println(sensors.getTempCByIndex(0)); // Why "byIndex"?
// You can have more than one IC on the same bus.
// 0 refers to the first IC on the wire
24. logfile.print("Temperature for Device 2 is: ");
logfile.println(sensors.getTempCByIndex(1));
logfile.close();
}
}
//count the cumber of times radiation is detected
void countPulse(){
detachInterrupt(0);
count++;
while(digitalRead(2)==0){
}
attachInterrupt(0,countPulse,FALLING);
}
Once I had finished writing the code I then had to solder some stacking pins onto the data
logging shield and the Geiger counter so that all of the components could stack onto each other
and all of the sensors could communicate to the Arduino properly.
Results
The final product for the data logging equipment can be seen in figure 2 below.
25. -figure 2
I then tested the final design by first seeing if the equipment would accurately measure and
display the temperature of the room, the GPS location of the device and appropriated readings
for radiation in a room with no radioactive material. These results can be seen below.
Time: 4:45:22
Date: 12/16/2016
Fix: 1 quality: 1
Location: 3518.3015N, 8311.8173W
Location (in degrees, works with Google Maps):35.3050, -83.1970
Speed (knots): 0.29
Angle: 270.25
Altitude: 696.40
Satellites: 7
cpm = 18 - uSv/h = 0.1462
Temperaturefor Device 1 is: 23.44
Temperaturefor Device 2 is: 23.62
Time: 4:45:32
26. Date: 12/16/2016
Fix: 1 quality: 1
Location: 3518.3015N, 8311.8183W
Location (in degrees, works with Google Maps):35.3050, -83.1970
Speed (knots): 0.23
Angle: 266.08
Altitude: 697.10
Satellites: 8
cpm = 24 - uSv/h = 0.1949
Temperaturefor Device 1 is: 23.37
Temperaturefor Device 2 is: 23.50
Time: 4:45:42
Date: 12/16/2016
Fix: 1 quality: 1
Location: 3518.3017N, 8311.8203W
Location (in degrees, works with Google Maps):35.3050, -83.1970
Speed (knots): 0.34
Angle: 104.47
Altitude: 697.20
Satellites: 7
cpm = 24 - uSv/h = 0.1949
Temperaturefor Device 1 is: 23.31
Temperaturefor Device 2 is: 23.44
Time: 4:45:52
Date: 12/16/2016
Fix: 1 quality: 1
Location: 3518.3017N, 8311.8203W
Location (in degrees, works with Google Maps):35.3050, -83.1970
Speed (knots): 0.52
Angle: 18.34
Altitude: 697.40
Satellites: 7
cpm = 30 - uSv/h = 0.2436
27. Temperaturefor Device 1 is: 23.37
Temperaturefor Device 2 is: 23.50
Time: 4:46:2
Date: 12/16/2016
Fix: 1 quality: 1
Location: 3518.3020N, 8311.8212W
Location (in degrees, works with Google Maps):35.3050, -83.1970
Speed (knots): 0.40
Angle: 274.29
Altitude: 697.80
Satellites: 7
cpm = 18 - uSv/h = 0.1462
Temperaturefor Device 1 is: 23.37
Temperaturefor Device 2 is: 23.50
Time: 4:46:12
Date: 12/16/2016
Fix: 1 quality: 1
Location: 3518.3017N, 8311.8212W
Location (in degrees, works with Google Maps):35.3050, -83.1970
Speed (knots): 0.36
Angle: 333.49
Altitude: 697.90
Satellites: 6
cpm = 18 - uSv/h = 0.1462
Temperaturefor Device 1 is: 23.31
Temperaturefor Device 2 is: 23.44
Time: 4:46:22
Date: 12/16/2016
Fix: 1 quality: 1
Location: 3518.3007N, 8311.8203W
Location (in degrees, works with Google Maps):35.3050, -83.1970
Speed (knots): 0.46
28. Angle: 290.44
Altitude: 698.00
Satellites: 7
cpm = 12 - uSv/h = 0.0974
Temperaturefor Device 1 is: 23.31
Temperaturefor Device 2 is: 23.50
Time: 4:46:32
Date: 12/16/2016
Fix: 1 quality: 1
Location: 3518.3007N, 8311.8203W
Location (in degrees, works with Google Maps): 35.3050, -83.1970
Speed (knots): 0.23
Angle: 10.62
Altitude: 698.60
Satellites: 7
cpm = 30 - uSv/h = 0.2436
Temperaturefor Device 1 is: 23.31
Temperaturefor Device 2 is: 23.50
Time: 4:46:42
Date: 12/16/2016
Fix: 1 quality: 1
Location: 3518.2993N, 8311.8212W
Location (in degrees, works with Google Maps):35.3050, -83.1970
Speed (knots): 0.12
Angle: 52.09
Altitude: 700.70
Satellites: 7
cpm = 18 - uSv/h = 0.1462
Temperaturefor Device 1 is: 23.31
Temperaturefor Device 2 is: 23.37
Time: 4:46:52
29. Date: 12/16/2016
Fix: 1 quality: 1
Location: 3518.2985N, 8311.8203W
Location (in degrees, works with Google Maps):35.3050, -83.1970
Speed (knots): 0.86
Angle: 179.96
Altitude: 701.80
Satellites: 7
cpm = 6 - uSv/h = 0.0487
Temperaturefor Device 1 is: 23.31
Temperaturefor Device 2 is: 23.44
After analyzing these results and comparing them to my current known location, altitude ,
speed, and temp of the room one can see that the eclipse data logging equipment is accurately
measuring and recording data to the serial monitor since the current temp in deg C is accurate to
room temp and after doing a quick google map search of the coordinates given accurately show
my location and altitude. The only thing that is off by the data is the time, which is because the
GPS sensor does not know what time zone it is in. This can be changed in the code somehow,
but I was unable to figure this out. The number of radiation counts per minute is accurate
according to the manual provided for the geiger counter as well. The manual states that one
should get approximately 10 to 30 counts per minute in a room with no radiation stimulus. One
can also see from the data that the temp sensors are accurately reading data separately from one
another. I further tested this by putting my finger on each sensor and seeing if the temp sensor
that had my finger on it would read a warmer temp that the one that did not have my finger on it.
After doing this simple test I was able to validate that the temp sensors read temperatures
separately from each other.
30. Once I had verified that the measurement equipment accurately displayed the sensor data
to the serial monitor on the computer, I then tried to verify that the Arduino would also log what
was being displayed on the serial monitor to the SD card. I did this by placing the SD card into
the eclipse data logger and letting the eclipse data record data. The weird thing that happened
was the eclipse data logger would seem to only record the first three bits of data and then data
logger would quit measuring data completely, but if the name of the file to send the data to was
changed, this problem either got worse or better. This is very odd considering that should be an
arbitrary thing.
Conclusion
In conclusion of the project, the majority of the scope of the project was accomplished.
The one thing that was set to be accomplished that wasn’t was recording the sensor data to the
SD card. One reason that I believe caused the eclipse data logger to not correctly log data to the
SD card but display sensor readings correctly to the serial monitor when the SD card was
removed is the fact that the code that I wrote took up %90 of the Arduino’s memory which could
cause stability problems as stated by the Arduino compiler. This could possibly be fixed by
stringing all of the data into one string and then writing that one string of data to the SD card
instead of trying to write to the SD card 5-10 time in one loop cycle.
31. References
-Gomez, Enrique, ed. "Cat Manual." (2013): 1-51. Web. 26 Sept. 2016.
-Hobby Tronics. "Arduino - One Wire Digital Temperature Sensor - DS18B20." Arduino - One
Wire Digital Temperature Sensor - DS18B20. Hobby Tronics, n.d. Web. 16 Nov. 2016.
-Lady ADA. Adafruit Ultimate GPS Logger Shield. N.p.: Adafruit Industries, 2016. PDF.
-Libelium. "Geiger Counter - Radiation Sensor Board for Arduino and Raspberry Pi." Cooking
Hacks. Libelium, n.d. Web. 13 Dec. 16. <https://www.cooking-
hacks.com/documentation/tutorials/geiger-counter-radiation-sensor-board-arduino-
raspberry-pi-tutorial/#schematic>.
-Watson, Alan, and Lulu Watson. "High Energy Cosmic Rays." Scholarpedia.
Scholarpedia, 30 June 2016. Web. 9 Nov. 2016.
<http://www.scholarpedia.org/article/High_energy_cosmic_rays>.