Download as PDF, PPTX

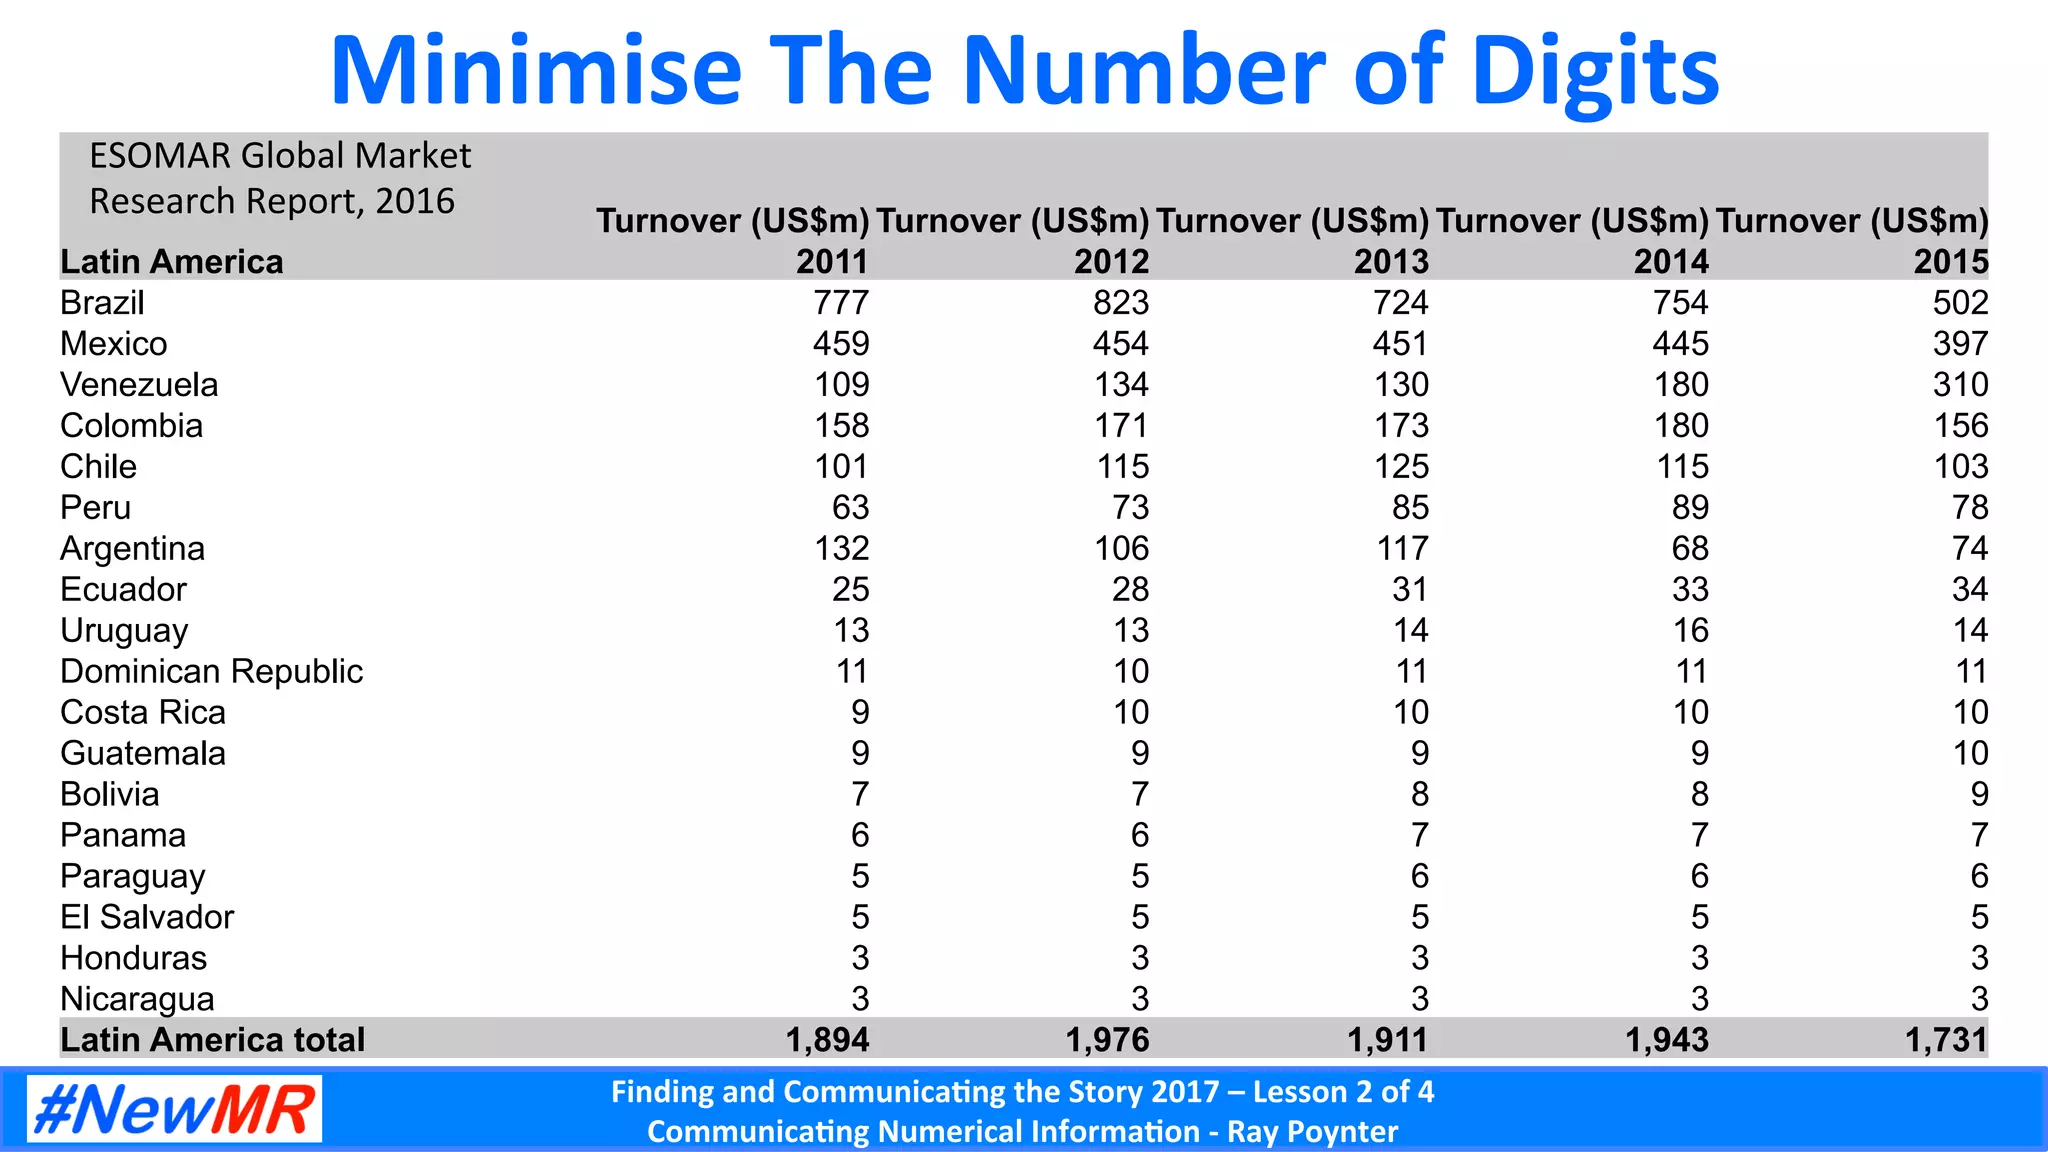
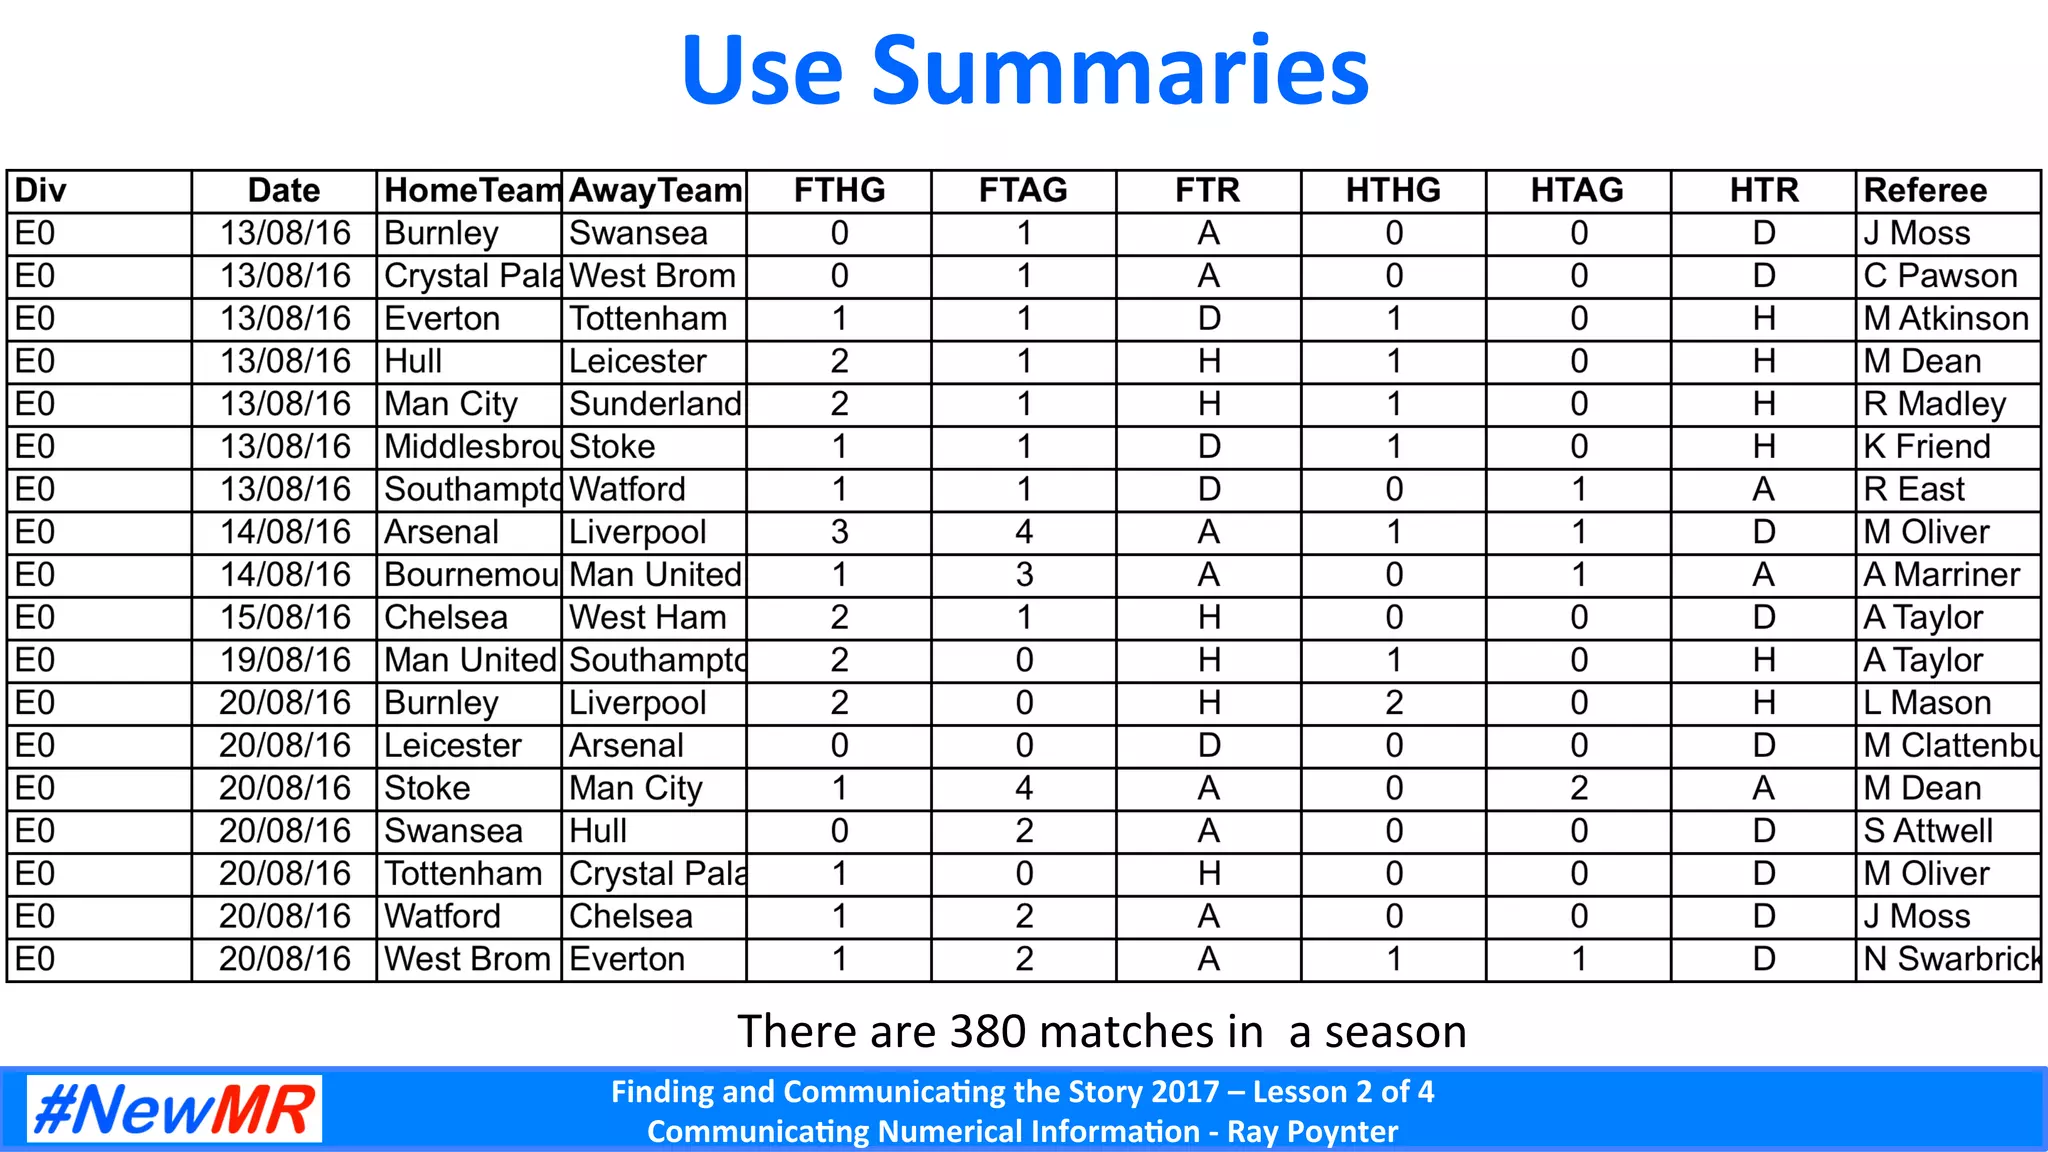


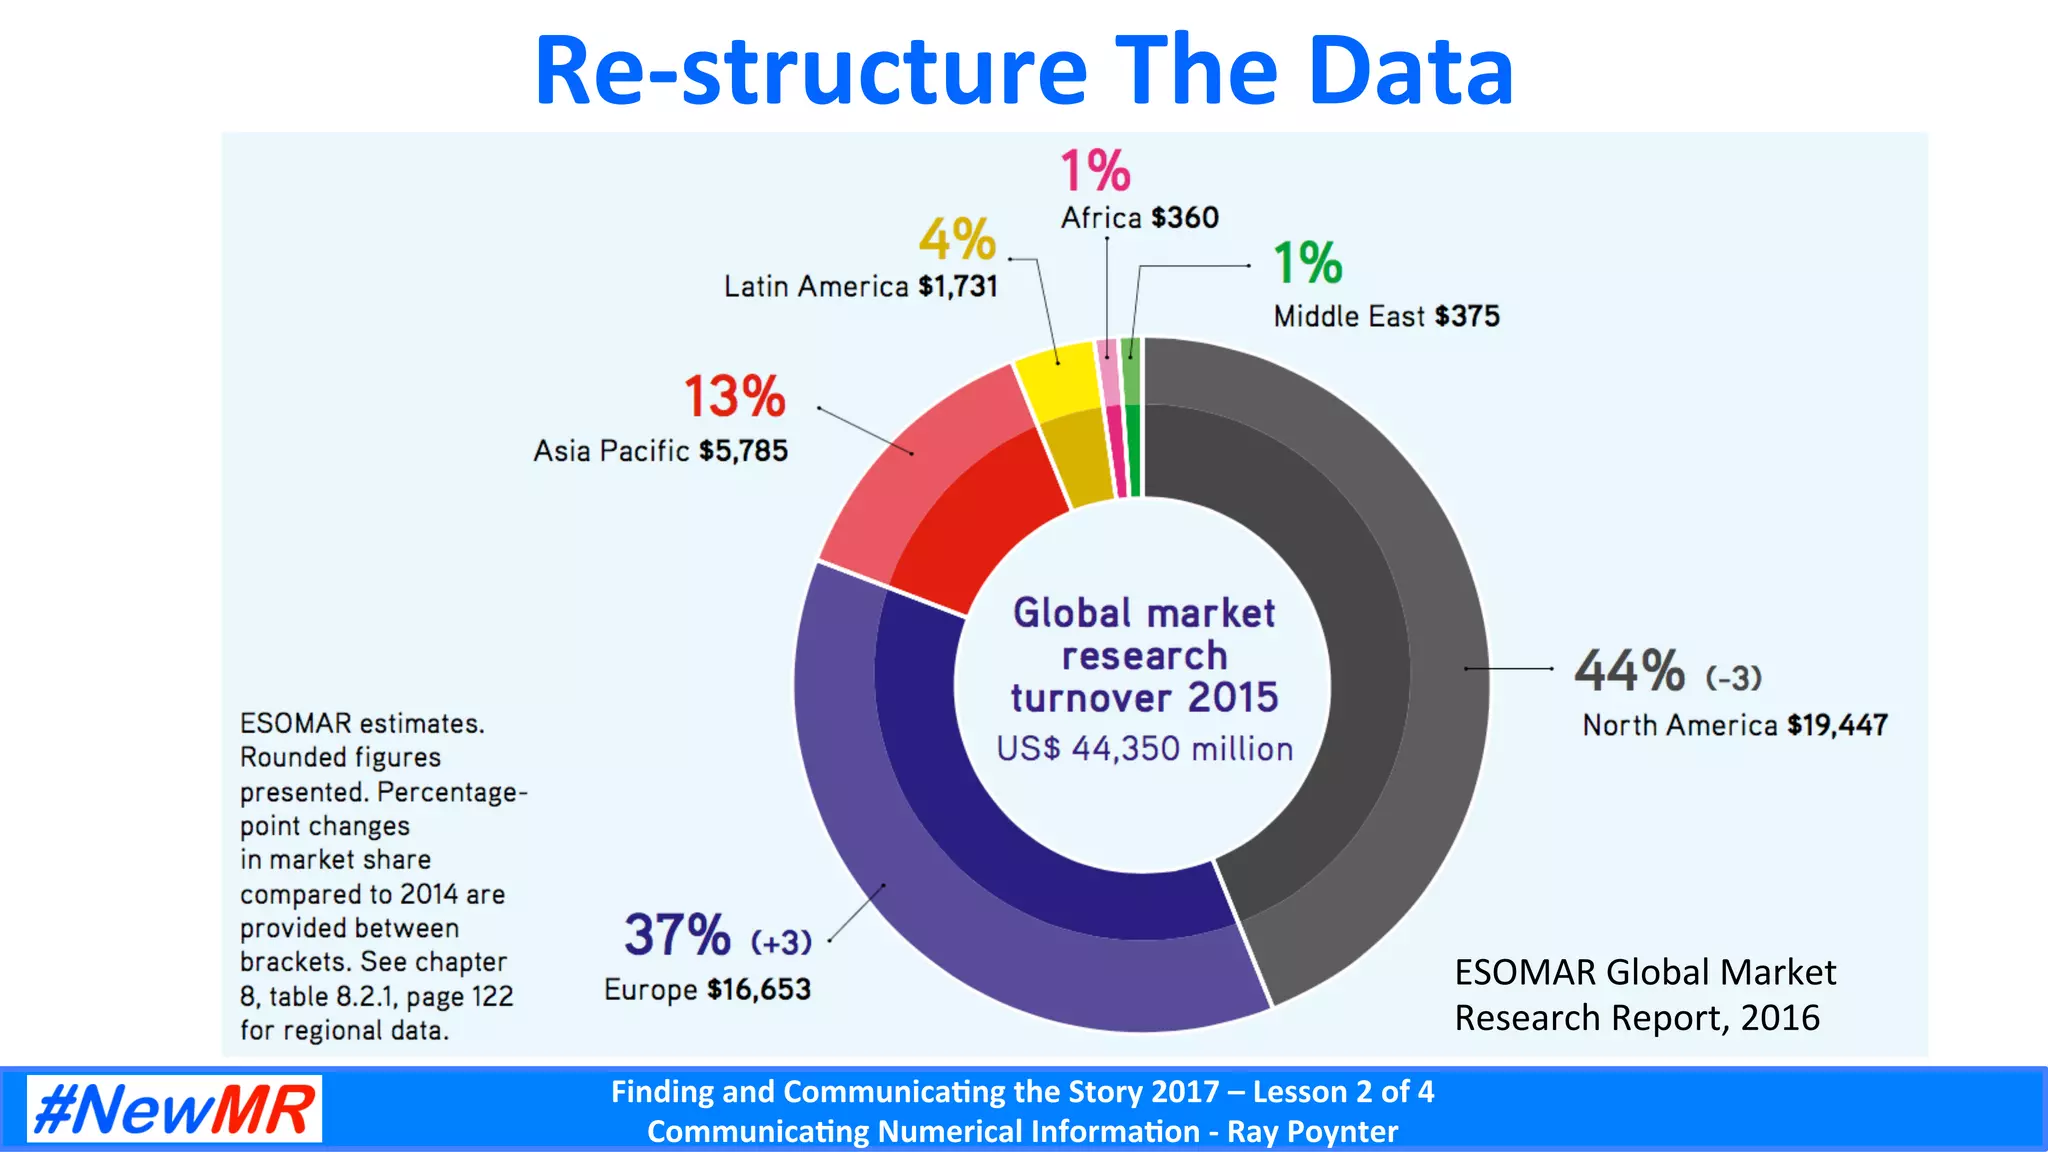
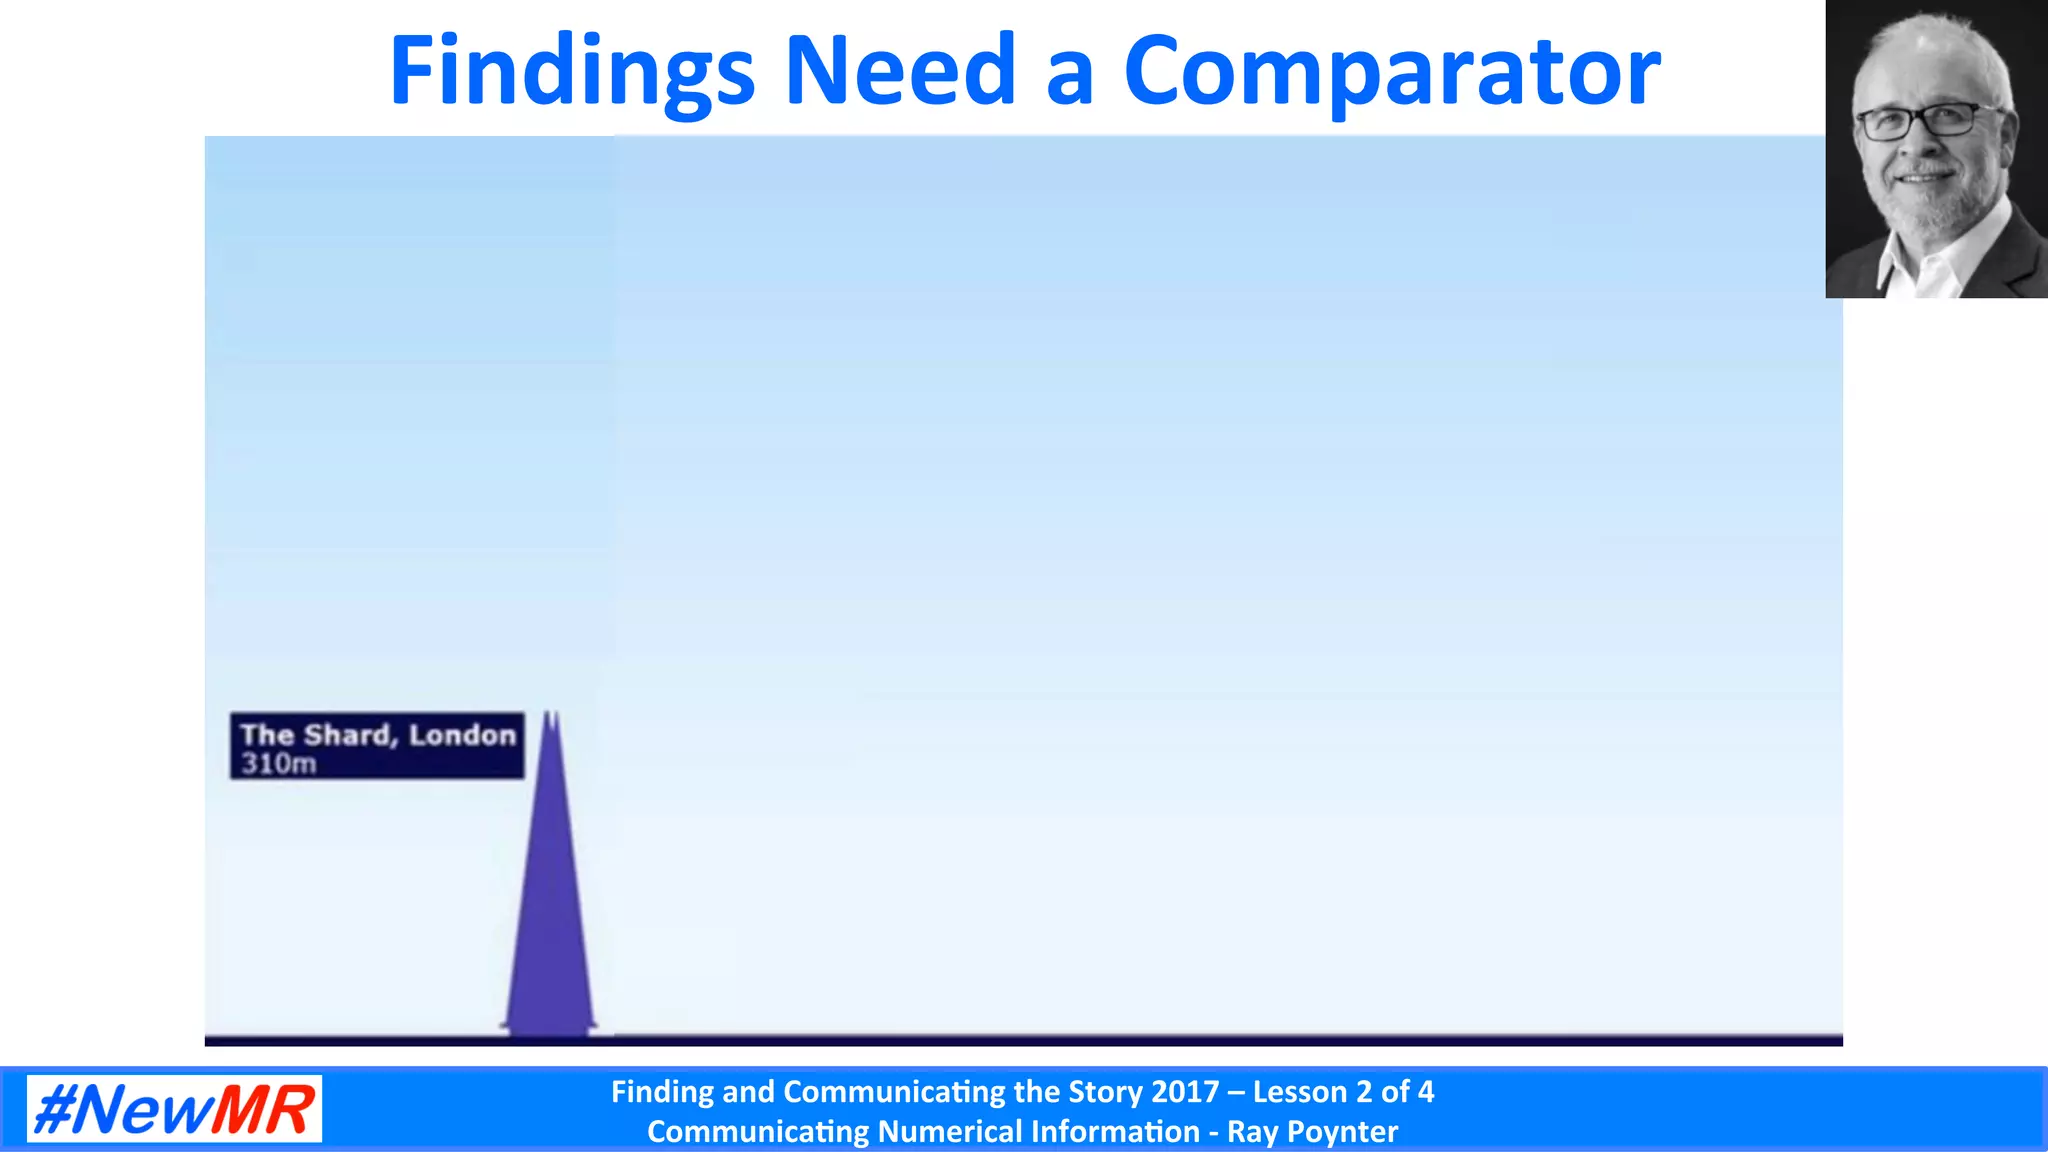

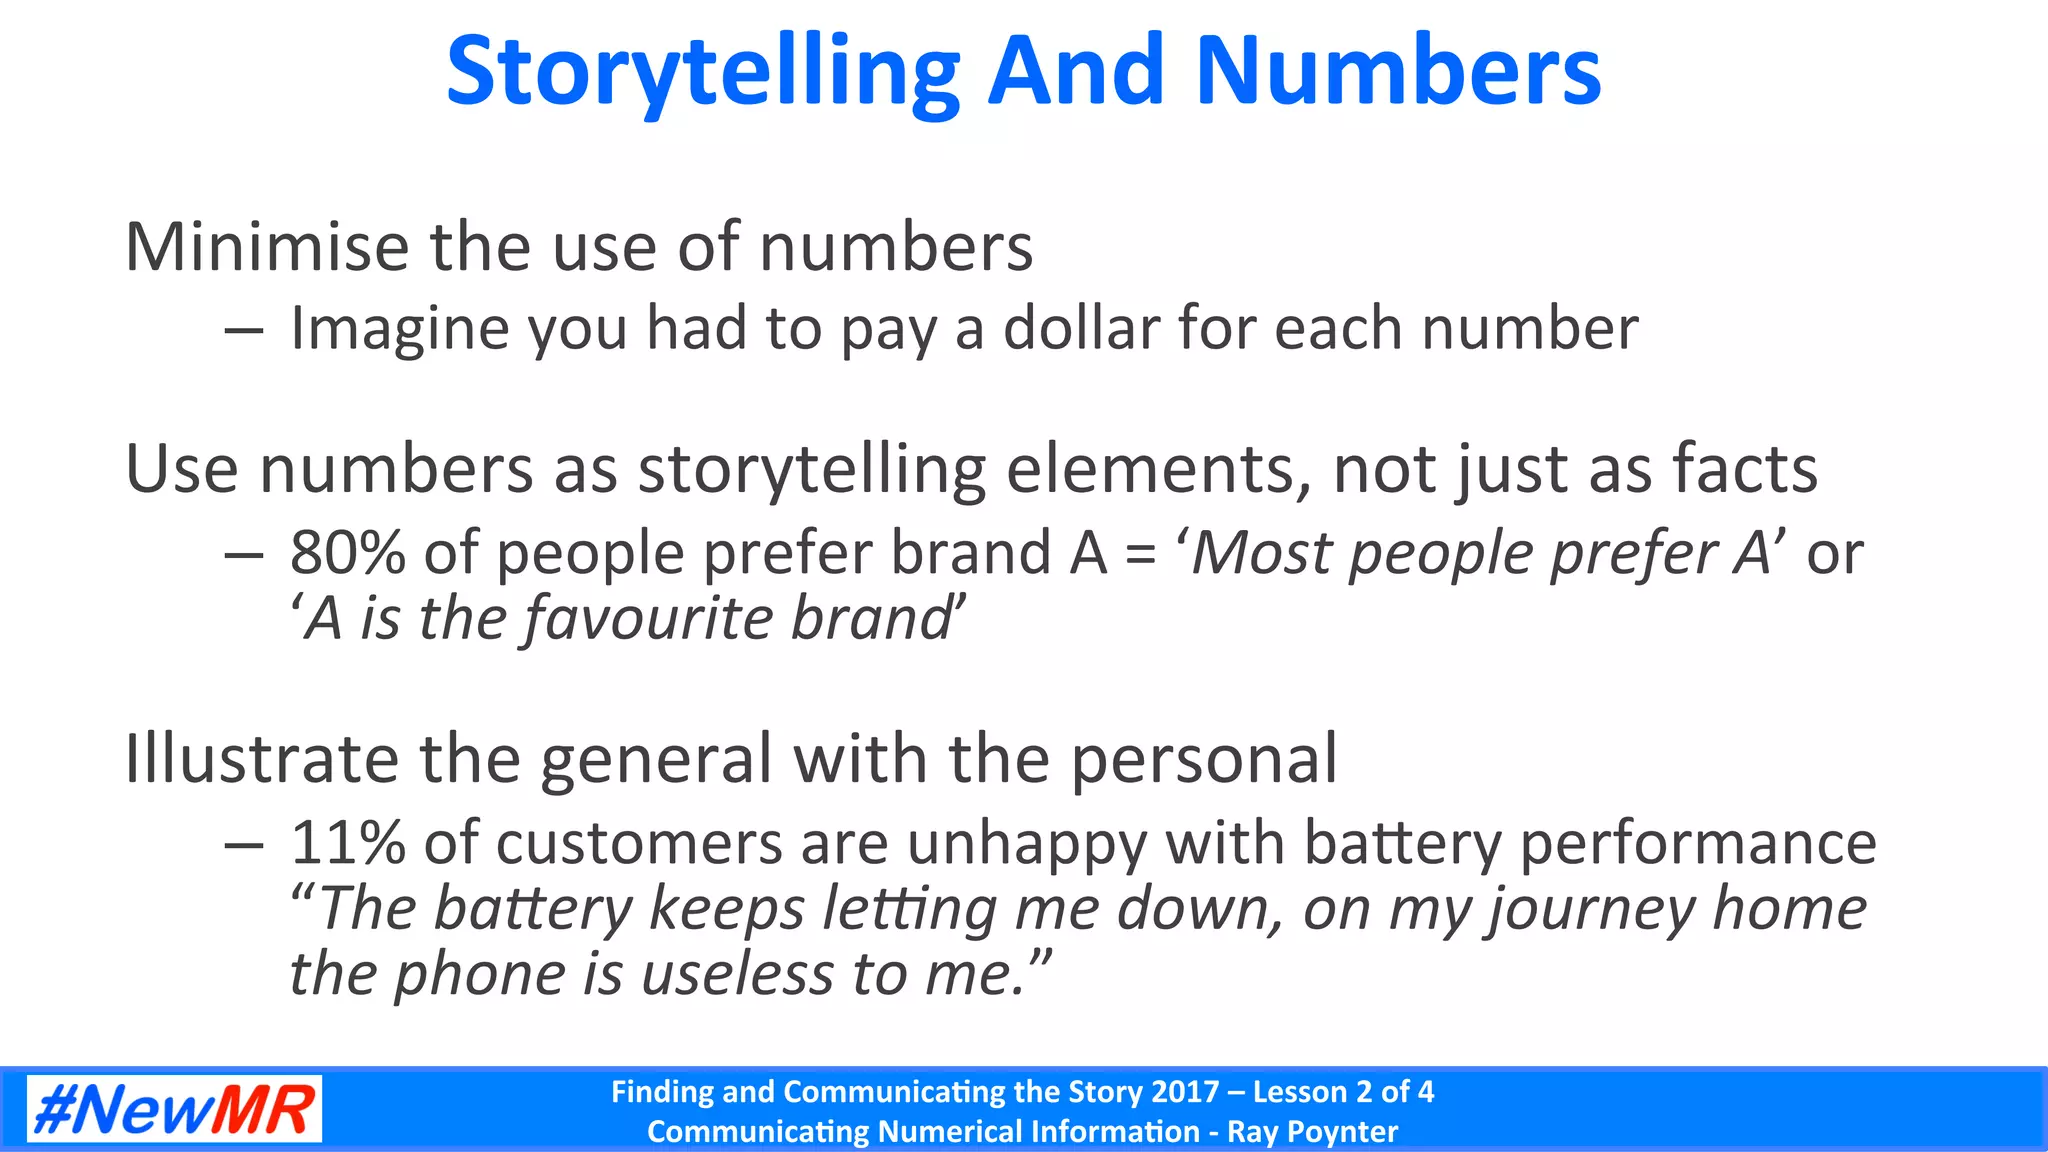
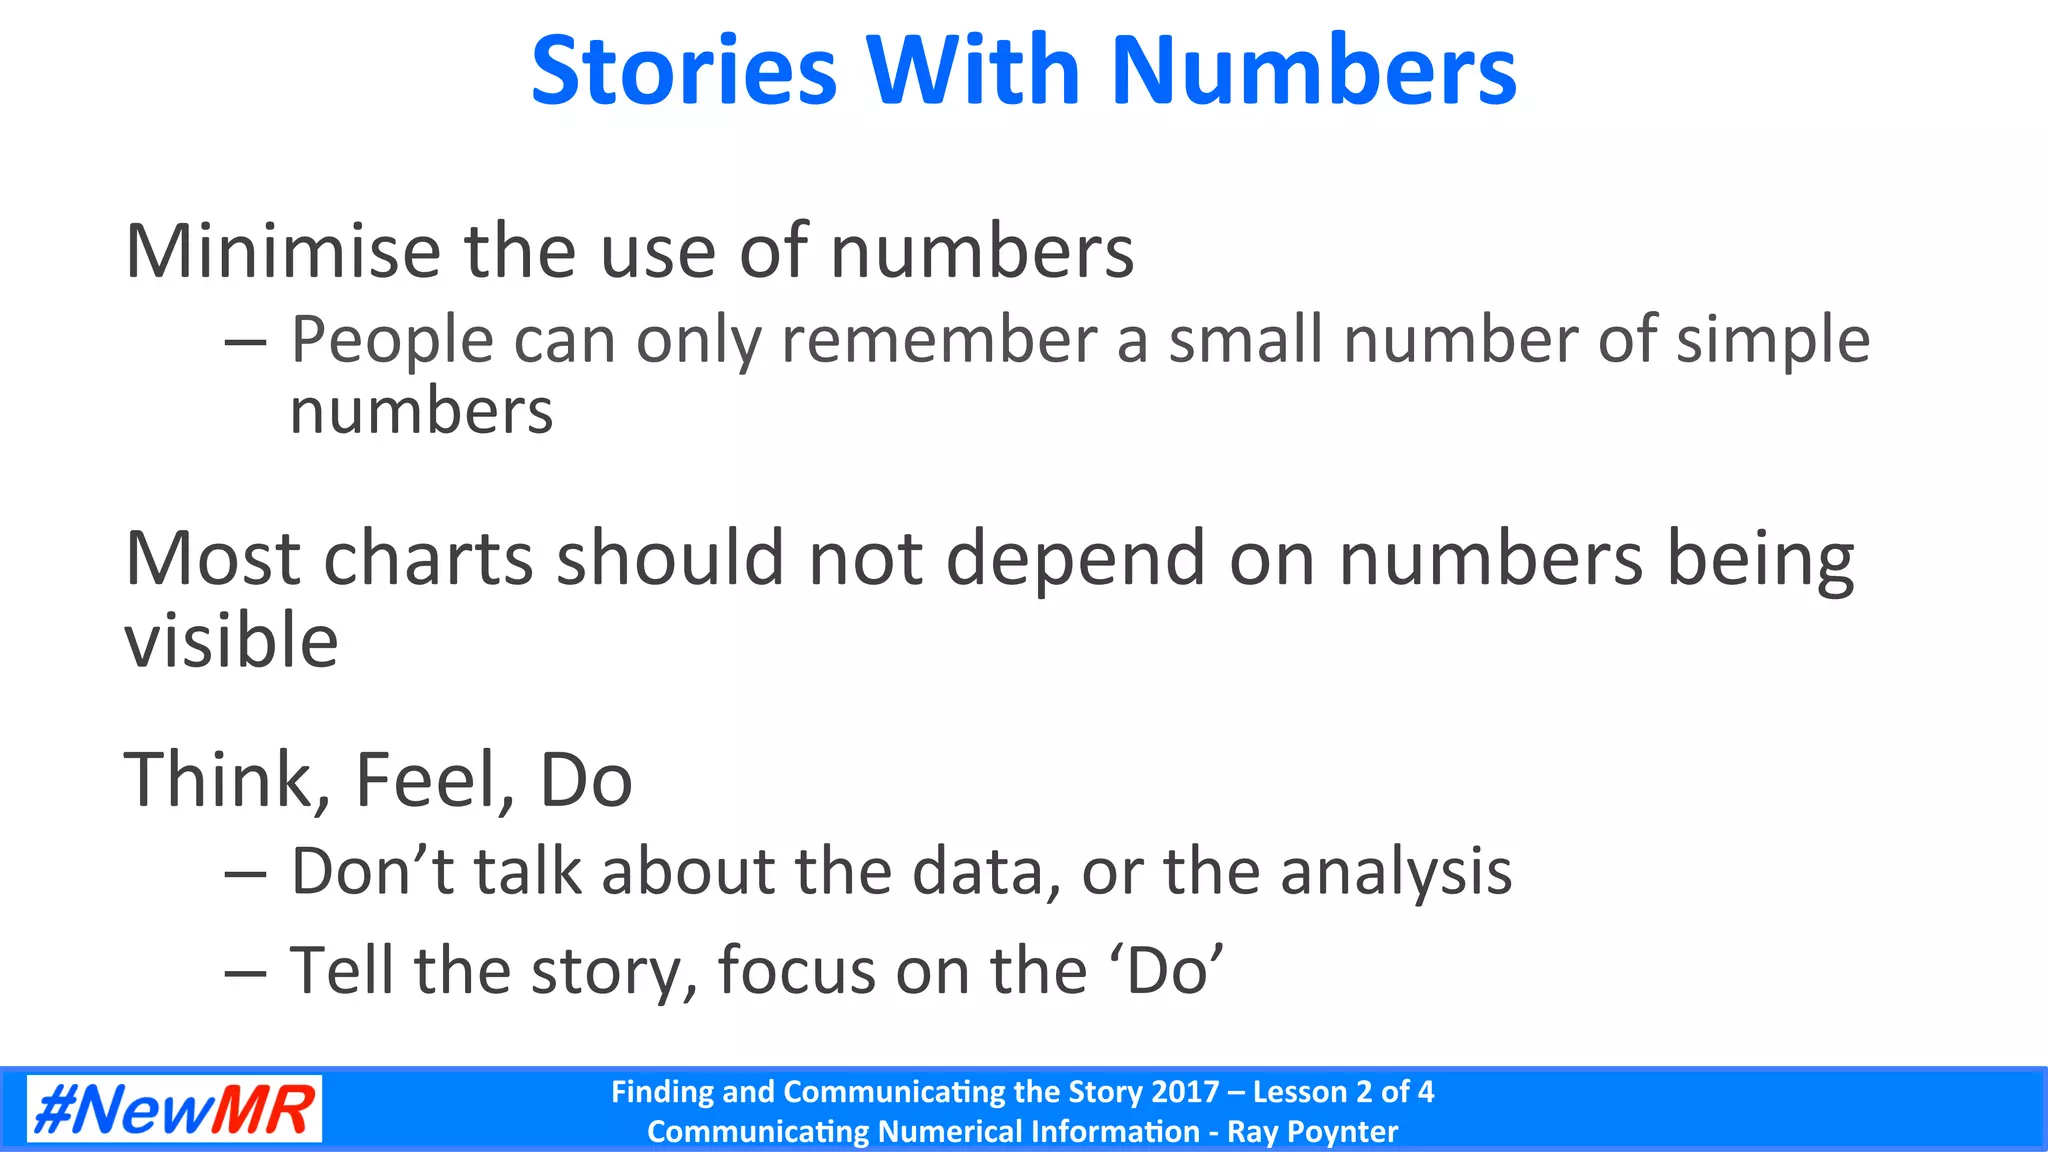


This document discusses effective communication of numerical information, emphasizing the importance of reducing complexity and telling a story with data. Key strategies include simplifying data presentation, using visualizations, and focusing on the emotional impact of numbers. It offers practical tools for structuring and presenting data in a way that engages the audience and facilitates understanding.