4. Determinants of Myocardial Oxygen Consumption
• In contrast to most other vascular beds, myocardial oxygen
extraction is near-maximal at rest, averaging 60% to 80% of
arterial oxygen content. So it might increase to maximum 90 %
after heavy exercise.
• Thus because of high resting tissue extraction of oxygen,
increase in themyocardial oxygen consumption ( MVo2)are
primarly met by a proportional increase in coronary blood flow.
• The major determinants of MVo2 are heart rate, systolic
pressure (or myocardial wall stress), and left ventricular (LV)
contractility.
• Atwofold increase in any of these individual determinants of
MVo2 requires an approx 50% increase in coronary blood flow.
5. • Coronary blood flow at rest is Approx 250ml/min.
• Myocardium will regulate its own blood flow between perfusion
pressure of 40 to 140 mmhg, beyond this is pressure dependent.
Autoregulation
• Regional coronary blood flow remains constant as coronary
artery pressure is reduced below aortic pressure over a wide
range when the determinants of myocardial oxygen
consumption are kept constant.
• When pressure falls to the lower limit of autoregulation,
coronary resistance arteries are maximally vasodilated to
intrinsic stimuli, and flow becomes pressure-dependent,
resulting in the onset of subendocardial ischemia.
• The ability to increase flow above resting values in response to
pharmacologic vasodilation is termed coronary flow reserve.
6. • Transmural variations in the lower autoregulatory pressure
limit, which result in increased vulnerability of the
subendocardium to ischemia.
• Subendocardial flow occurs primarily in diastole and begins to
decrease below a mean coronary pressure of 40 mm Hg.
• By contrast, subepicardial flow occurs throughout the cardiac
cycle and is maintained until coronary pressure falls below 25
mm Hg.
• This difference arisesfrom
– Increased oxygen consumption in the subendocardium.
– Higher restingflow rates
– Increased sensitivity to systolic compressive affects ie
subendocardial flow occurs only in diastole.
• The transmural difference in the lower autoregulatory pressure
limit results in vulnerability of the subendocardium to ischemia
in the presence of a coronary stenosis.
7.
8.
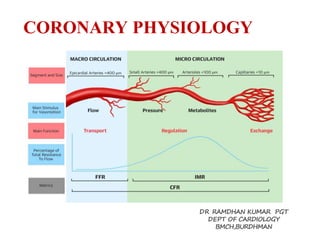
9. Determinants of Coronary VascularResistance
• The resistance to coronary blood flow can be divided into three major
components
• R1( Epicardial arteries )- Under normal circumstances, there is no measurable
pressure drop in the epicardial arteries, indicating negligible conduit
resistance.
• R2 ( Microcirculatory resistance arteries &arteriole (20 to 400 μm in
diameter)- distributed throughout the myocardium &respond to physical
forces (intraluminal pressure and shear stress), as well as the metabolic needs
of the tissue.
• R3 (Extravascular compressive resistance)- During systole, cardiac contraction
raises the extravascular pressure to values equal to LVpressure at the
subendocardium. This declines to values near pleural pressure at the
subepicardium.
• The increased effective back pressure during systole produces a time varying
reduction in the driving force for the coronary flow that impedes the coronary
flow to subendocardium.
• In heart failure compressive effects from elevated ventricular diastolic
pressures also impede perfusion via passive compression by increasing extra
vascular tissue pressure during diastole.
10. Physiological assesment of coronary artery stenosis
• The physiologic assessment of stenosis severity is a critical
component of the management of patients with obstructive
epicardial CAD.
• Stenosis in the epicardial artery result in reduced perfusion
pressure , arterioles downstream dilate to maintain normal
resting flow .
• As stenosis progress, arteriolar dilatation becomes chronic,
decreasing potential to augment flow and thus reduce coronary
flow reserve.
• As CFR approaches to 1,any further decrease in perfusion
pressure or increase in MV02 result in ischemia.
11. • The total pressure drop across a stenosis is
governed by three hydrodynamic factors —
viscous losses, separation losses, and
turbulence.
12. The Coronary Pressure–Flow Relationships
• Myocardial ischemia results from an imbalance
between myocardial oxygen supply and demand.
• Coronary blood flow provides the needed oxygen
supply for any given myocardial oxygen demand and
normally increases automatically from a resting
level to a maximum level in response to increases in
myocardial oxygen demand from exercise and
neurohumoral or pharmacological hyperemic
stimuli.
• This increase from baseline to maximal flow has
been termed coronary flow reserve (CFR).
13. • Blood flow has 3 major resistance components: the epicardial
vessel (R1), the small arteries and arterioles (R2), and the
intramyocardial capillary system(R3).
• When coronary reserve is normal, these 3 resistances are
assumed to be functioning normally.
• In patients without atherosclerosis, the large epicardial vessel
resistance (R1) is trivial.
• Arteries with diameters 400 um have only minimal resistance.
• Adjustment of coronary resistance occurs principally at the R2
resistance (vessels 400 um in diameter) and is due to the
integrated action of several control mechanisms.
• Across a normal epicardial artery, supplying normal
myocardium, coronary blood flow can increase 3-fold in adults.
14. • Autoregulation automatically maintains the
basal flow at a constant level in response to
changing pressure and oxygen demand.
• Atherosclerotic narrowings produceepicardial
vessel resistance and, after a critical reduction
in vessel lumen area, can abolish not only
coronary reserve but also autoregulation, thus
reducing resting coronary bloodflow.
• Coupled with reduced flow is the loss of
pressure distal to a stenosis.
15. • The resistance to flow
through a stenosis
caused by viscous
friction, flow
separation, turbulence,
and eddies at the site of
the stenosis results in
energy loss.
• Energy loss produces
pressure loss distal to
the stenosis and thus a
pressure gradient across
the narrowed segment
(Figure 1).
16. • Thepressure loss or
gradient increases
with increasing
coronary flowalong
a quadratic pressure
drop–flow
relationship of the
specific coronary
stenosis
17. • In vessels without a
stenosis, the
pressure–flow curve
of maximal
vasodilation is
linear in the
physiological
pressure range .
18. • However, when a stenosis is present, the maximal flow
at any given arterial pressure is lower.
• In this setting, the coronary pressure–flow line at
maximum vasodilation is no longer straight but
curvilinear because stenosis resistance is flow
dependent.
• The clinical significance of these observations is that 2
nearly identical angiographic stenoses (eg, 60%
diameter narrowing) can have a dramatically different
clinical impact for thepatient.
• One stenosis would limit flow for increasing demand
and would produce angina, whereas the other would be
angiographically apparent but would remain clinically
unimportant
19. Coronary Pressure and`
Fractional Flow Reserve
• Myocardial perfusion pressure, normally the diastolic
coronary pressure, equals aortic pressure minus the left
ventricular diastolic pressure or central venous pressure.
• Across normal coronary arteries, aortic pressure is
transmitted completely, withoutappreciable pressure
loss even to the most distal regions.
• As noted earlier, the distal coronary pressure in arteries
with an atherosclerotic narrowing is decreased in
relationship to the degree of stenosis resistance.
• Pijls et al related the distal coronary pressure to the
ischemic potential of a stenosis by calculating a value
called the fractional flow reserve (FFR).
20. • By taking the ratio of the coronary pressure
measured distal to the stenosis to aortic pressure as
the normal perfusion pressure (distal coronary
pressure/aortic pressure) and obtaining these
measurements when the microvascular resistance
was minimal and assumed to be constant (that is, at
maximal hyperemia), the percentage of normal
coronary flow, or a fraction of normal flow (ie, FFR),
can be calculated.
• The FFR measures the maximum achievable
myocardial blood flow in the presence of a coronary
artery stenosis as a percentage of the maximum
blood flow in the hypothetical case of a completely
normal artery
21. • FFR model assumes that under maximum arterial
vasodilation, the resistance of the myocardium is
minimal and constant across different myocardial
vascular beds, and thus blood flow to the
myocardium is proportional to the driving pressure
(myocardial perfusion pressure).
• FFR can be derived separately for the myocardium,
for the epicardial coronary artery, and for the
collateral supply.
• Calculations of myocardial, coronary, and collateral
FFR from pressure measurements taken during
maximal arterial vasodilation (ie, hyperemia) are as
follows:
22. • The FFR is simplified to Pd/Pa given the
assumption that Pv is negligible relative to Pa.
23.
24. • An FFR value of 0.6 means that the
maximum myocardial flow across the
stenosis is only 60% of what it should be
without the stenosis.
• An FFR of 0.9 after percutaneous coronary
intervention (PCI) means that the
maximum flow to the myocardium is 90%
that of a completely normal vessel.
25. • FFR has a normal value of 1.0 for every
patient and every coronary artery.
• An FFR 0.75 is associated with inducible
ischemia (specificity, 100%), whereas a
value 0.80 indicates absence of inducible
ischemia in the majority of patients
(sensitivity, 90%).
26. Fractional Flow Reserve
• Based on the principle that the distal coronary
pressure measured during vasodilation is directly
proportional to maximum vasodilated perfusion.
• FFR is defined as the ratio of maximum blood flow
in a stenotic artery to maximum blood flow in the
same artery if there were no stenosis.
• FFR is simply calculated as a ratio of mean pressure
distal to a stenosis (Pd) to the mean pressure
proximal stenosis, that is the mean pressure in the
aorta (Pa), during maximalhyperaemia.
27.
28. LIMITATIONS OF CORONARYANGIOGRAPHY
– Interpretation is highlysubjective
– CAG provides a 2–dimentional view of a 3-dimensional
lumen.
– Severity of a stenotic lesion is reported in comparison to a
normal reference segment . This is particularly fallacious in
case of diffusedisease.
– CAG is a lumenography &does not provide information
regarding vessel wall &extent of positive or negative
remodeling.
– An ecentric stenosis has varying appearance of severity in
different views. The length, size and severity of a lesion & its
relationship with the vessel wall can affect the coronary flow.
– Several artifacts contribute to the disparity in interpretation
like vessel foreshortening, overlapping vessels, calcification
&contrast streaming.
29. TECHNIQUE
Catheter
• Diagnostic catheters can not be used to measure FFR -
pressure measurements can be inaccurate &the wire
manipulation is met with friction due to smaller internal
diameters compared to guide catheters.
• The main advantage of using guide catheters is that PCI
is immediately possible ifrequired.
• Guide catheter with Side holes should not be used
– It can create a false gradient between the side holes &the tip
of the guide catheter creating a false Positive FFR.
– Pharmacological vasodilatory agents may be flushed into the
aorta instead of the coronary artery.
30. Pressure Wire
• Two pressure wires are available namely
PressureWire ( stJude medical, MN, USA) &
Volcano WaveWire ( Volcano Inc,
CA,USA)
• Both have the pressure sensor (solid-state
(electronic) sensor) located at the junction of
the radiopaque &radiolucent part of the wire,
30 mm from the tip.
• The wires are 0.014-inch (0.33-mm) floppy-
tipped guide wire
31. 36
PressureWir
e®
The distal pressure in the coronary artery is measured by a tiny
sensor located 3 cm from the tip of an 0.014” guidewire, called
PressureWire®.
33. Maximal Hyperaemia
• Epicardial &resistance arteries have to be
vasodilated.
• Epicardial vessels are dilated using a bolus of
100-200 mcg of intracoronary nitroglycerineat
least 30 seconds before the first measurement.
• Hyperaemia is induced in the resistance
vessels using adenosine ( IC or IV ) or
papaverine ( IC)
36. Anticoagulation
• Standard protocols for anticoagulation should
be followed.
• Heparin is administered according to body
weight to maintain an ACT of at least 250.
• Display
• The pressure wire is connected to an interface
( Analyzer Express, St Jude medical inc. or
combomap, volcano Inc.) which shows the
mean Aortic pressure (Pa) &the mean pressure
at the tip of the guide wire (Pd) simultaneously
&provides a FFR value immediately.
37. 42
RadiAnalyze
r®
PressureWire® is attached to RadiAnalyzer®, an interface which
makes
the FFR calculations automatically during the procedure.
It displays both aortic and distal pressure wave forms.
Cathlab
recordin
g
system
AO
transducer
IBP
input
FFR
PressureWire
38. Precautions
• Guiding catheter should not have side holes
• Introducer needle should be removed before
equalising or takingmeasurements.
• Equalise the pressure measured by the
pressure wire &guiding catheter.
• Height of the transducer should be adjusted to
thepatients heart level.
• Appropriate dose &route ofpharmacological
agents to achieve maximal hyperaemia is
essential to obtain accurate results
• Use central vein for IV adenosine.
39. Pressure Measurement
Step 1:Zero the pressure system to the
atmosphere.
Step 2:Insert the pressure sensor guide wire
into the guide and equalize the 2 pressures.
Step 3: Advance the pressure wiresensor
distal to the region of interest.
Step 4: Induce maximal hyperemia.
Step 5:Wire pullback to check for signal drift.
41. UNIQUE FEATURES OF FFR
• Normal value of irrespective of the patient , artery or
vascular bed. It is independent of gender &other factors like
DM &HTN
• Well defined cut-off values:
– FFR values ≤ 0.75 is invariably associated with inducible ischemia
(sensitivity 88%, specificity 100%, positive predictive value 100%&overall
accuracy 93%)
– FFR ≥0.80 is usually not associated with inducible ischemia.
– The gray zone of 0.75 to 0.80 spans over a small range of FFR values.
• Systemic haemodynamics like heart rate , blood pressure &
LVcontractility do not affect the value of FFR since the value
of Pd &Pa are taken simultaneously.
• Reproducibility : FFR is reproducible since the
microvasculature has the capacity to vasodilate the same
extent repeatedly.
42. • Contribution of collateral vessels is taken in to
account. The pressure distal to the stenosis is
influenced by antegradeflow &retrograde flow &is
therefore influenced by a stenotic vessel supplied by
collateral &a stenotic vessel giving collaterals to a
more severely stenosed vessel.
• Spatial resolution
– During maximal hyperaemia, pulling back the pressure
wire can provide an instantaneous measure of the
signifance of a particular segment of the coronary
artery with a spatial resolution of a few millimeters.
– It therefore provides a per segment analysis of the
coronary artery.
– This is especially useful in case of sequential stenosis to
determine the stenosis with the maximum
haemodynamic significance.
43. • Relation between FFR &viable myocardium :
– If a stenotic vessel supplies a larger viable
myocardial mass, there will be larger
hyperaemic flow during maximal vasodilation
resulting in a greater gradient between Pd &Pa
&thus , a lower value of FFR.
– Therefore , the haemodynamic
significance of a lesion is dependent on its
perfusion territory.
44. APPLICATIONS OF FFR IN SPECIFIC
SUBSETS
Intermediate lesions
• Intermediate lesions with a FFR of ≥ 0.80 can be safely defered.
• The DEFER study has shown that patients with single vessel
stenosis and FFR >0.75whodidnot undergo PCI hadexcellent
outcomes.
• The risk of cardiac death or MI related to the stenosis was <1%
peryearand was notreduced with PCI.
45.
46.
47.
48.
49. • Deferral of revascularization forsingle-vessel
stenoses according to the FFR value is safe
regardless of the stenosis location.
• Muller et al showed that medical treatment of
patients with proximal left anterior descending
stenoses and FFR >0.80had excellent 5-year
outcomes.
• Even for patients with small coronary arteries
(diameter <2.8 mm), FFR can safely determine
stenoses that necessitate revascularization.
50. • Physiologic and Anatomical Evaluation Prior to and After Stent
Implantation in Small Coronary Vessels (PHANTOM) trial,
– 60 patients with small coronary arteries underwent FFR.
– 56 of the 60 patients had undergone IVUS.
– Patients were stratified according to FFR (<0.75 and >0.75).
– The group with FFR <0.75underwentrevascularization.
– At 1year, there was no occurrence of MI or death in either
group.
– In patients with FFR <0.75,24%underwent arepeat PCI, but
only 2.6% of patients with FFR >0.75underwent
revascularization.
– Overall, there was no correlation between FFR and IVUS.
51.
52. Multivessel Coronary Artery Disease.
• FFR has a major impact on the revascularisation strategy in
multivessel disease .
• In patients who have triple vessel disease , FFR may demonstrate
haemodynamically significant stenosis of only two vessels.
• Conversely , a patient with apparently one or two vessel disease may
have a haemodynamic significant lesion in LM artery or in all three
vessels.
• This can affect the decision of PCI versus surgical revascularisation &
also the number of stents used during PCI.
• The FAME study showed a reduced rate of mortality &MI after 2 yrs
in the subset with FFR guided PCI, in patients with multivessel
disease.
53. The FAME study was designed to reflect daily practice
in performing PCI in patients with multivessel disease
Inclusion criteria:
• ALL patientswith multivessel disease
•At least 2 stenoses ≥ 50% in 2 or 3 major epicardial
coronary artery disease, amenable for stenting
Exclusion criteria:
• Left main disease or previous bypass surgery
• ST-elevation MI with CK > 1000 U/l within last 5 days
• extremely tortuous or calcified coronary arteries
Note: patients with previous PCI were not excluded
Ref. NEJM Vol 360, No 3, pp 213-224. Slides courtesy Nico H JPijls.
FAME study: Study Population
54.
55.
56.
57.
58.
59.
60. • CONCLUSIONS:
Routine measurement of FFR in patients
with multivessel disease (MVD) who are
undergoing PCI with drug-eluting stents
(DES) significantly improves outcomes at 1
year by reducing MACE (composite rate of
death, nonfatal myocardial infarction,and
repeat revascularization)
61. FAMEII: Fractional Flow Reserve-Guided PercutaneousCoronary
Intervention plus Optimal Medical Treatment versus Optimal
Medical Treatment Alone in Patients with Stable Coronary Artery
Disease
62. 50% randomly
assigned to FU
73% 27%
Regist
ry
When all FFR >
0.80
(n=332)
MT
Randomized
Trial At least 1 stenosis
with FFR ≤ 0.80
(n=888)
Randomization
1:1
PCI +
MT
MT
Follow-up after 1, 6 months, 1, 2, 3, 4, and 5 years
De Bruyne B, et al. N Engl J Med. 2012
FAME 2 Study Flow Chart
Stable CAD patients scheduled for 1, 2 or 3 vessel DES-PCI
N = 1220
FFR in all target lesions
65. FAME 2 TRIAL
• Conclusion
• In patients with stable coronary artery disease and
at least one stenosis with an FFR≤0.80, OMT alone
was associated with a more than fourfold larger
hazard of major adverse cardiac events than FFR-
guided PCI with drug-eluting stents plus OMT.
• In contrast, in patients with hemodynamically non-
significant stenoses (FFR>0.80), OMT alone was
associated with a favourable clinical outcome.
66. Left-Main CoronaryArtery Disease
• Left main coronary artery poses certain challenges
which make the interpretation of CAG &severityof
stenosis difficult.
– Greater inter-observervariability
– Under-estimation of functional significance since it supplies
a large myocardialterritory
– Diffuse atherosclerosis in a short LMCAresults in absence of
a reference segment to judge the significance of a lesion
– Spilling of contrast medium in to the aorta
– Overlapping the catheter with the LMCA
– Non – invasive testing may lead to false negative results since
reduced tracer uptake in all vascular territories leading to
balanced ischemia.
– FFR has been found to be safe in guiding LMCA
revascularisation in several studies &is associated with
improved outcomes.
67.
68. Tandem Lesions
• Tandem lesions are defined as 2 separate lesions with
>50%stenosis each in the same coronary artery,
separated by an angiographically normal segment.
• If the FFR is<0.75, Hirota et al suggested performing PCI
for the stenosis that showed marked narrowing first and
then repeating the FFR measurement.
• If the FFR remains <0.75,the other stenosis was
revascularized as well;in contrast, if the FFR value of the
first lesion increased after PCI to >0.75,then the second
lesion wastreated onlymedically
69. Considerations for Serial
lesions
Pre FFR (1+2) with
pullback
Lesion 1 large dP,
Stent
Recheck FFR
Treat lesion 2,
Final FFR
J Am Coll Cardiol Intv.
2012;5(10):1013-1018.
70. FFR Guided PCI of Serial Lesions
N=131 Patients with multiple 40-70% stenoses, 2 centers
N=298 Lesions, at least 20 mm apart, either chronic CAD or no
• Lesion with largest pressure drop was
stented first (116 total stents, 70 proximal,
46 distal)
• Strategy not clearly stated but seems like
goal was to achieve post stent FFR > 0.80
• Revascularization deferred in 61% lesions
• ≥2 stents deployed in only 18% vessels
Kim et al. J Am Coll Cardiol Intv 2012;5:1013-8
71. Bifurcation lesions
• Bifurcation lesions are particularly difficult to evaluate
by angiography.
• After stenting the main vessel, the side branch appears
pinched which is grossly overestimated by angiography
• Koo et al showed that kissing balloon dilatation of the
ostial side branch lesions with FFR < 0.75 only , resulted
to a FFR > 0.75 in 95% patients after 6 months.
• If the FFR of an apparently pinched side branch is >0.75,
it can safely be left alone.
72. Post stenting
• Nico H.J. Pijls at al showed that FFR
measured after stenting should be >0.90 &
is an independent predictor of 6 month
mortality.
• The registry was performed in 750 patients
in 15hospitals in 8 countries (5 centers in
the United States, 5 centers in Europe, and
5 centers inAsia).
73. Coronary Pressure Measurement After Stenting Predicts
Adverse Events at Follow-Up
AMulticenter Registry, (Circulation. 2002;105:2950-
2954.)
74. CABG conduit patency
• 20-25 % of grafts done to physiologically
nonsignificant lesions ( FFR > 0.80) were found to
be occluded at1yr.
• This occurs because blood flow favors a path of
lower resistance through the native vessel with a
nonsignificant obstruction as compared to a vein
graft.
• Thus FFR can provide information about future
graft patency &allows an appropriate selection of
the vessel which should not be grafted
75. Graft intervention
• FFR can be used to determine the
physiological significance of a lesion in a
graft vessel.
• The same cut off af ≤ 0.75 has been used in
a small study comparing FFR to stress
myocardial perfusion imaging with an
acceptable specificity &negative predicitive
value.
76. PITFALLSOF FFR
Hemodynamic Artifacts
• Damped pressure waveforms.
• Guide obstruction
• Contrast media
• Very small guide (<5F)
• Pressure signal drift
• Side holes andostial
‘pseudostenosis’
Technical
• loose connections
• Improper zero
• Calibration offset
Anatomic
• Extreme tortuosity
• Inability to wire vessel
• Spasm
Mechanical
Wire/artery impact
Pharmacologic
Inadequate hyperemia
77.
78.
79.
80. CONCLUSION
• FFR strongly supports the concept of 'Functionally Complete
Revascularisation', that isstenting of the physiologicallysignificant
ischemic stenosis & medicalmanagement of the non-ischemic
stenosis .
• In spite of the strong evidence favoring its use, FFR is still not used
widely .
• The application of FFR along with angiography combines two gold
standard investigations to provide an all in one anatomical &
physiological assessment of CAD.
• Its application in various subsets of coronary artery anatomies make
FFR an essential tool in the cath lab ,in decision making &improving
outcomes of patients undergoing PCI.
81.
82.
83. Coronary Flow and Flow Reserve
• As stenosis severity increases, maximal
coronary flow becomes attenuated and CFR
decreases.
• CFR is a combined measure of the capacity
of the major resistance components (the
epicardial coronary artery and supplied
vascular bed) to achieve maximal blood
flow in response to hyperemic stimulation.
84. • Anormal CFR implies that both the epicardial and
minimally achievable microvascular bed resistances
are low and normal.
• However, when abnormal, CFR does not indicate
which component is affected, thus limiting the
clinical applicability of this measurement.
• Although early studies in animals and patients
suggested an absolute CFR of3.5 to 5 in adult
patients with chest pain syndromes and CAD risk
factors undergoing cardiac catheterization with
angiographically normal vessels, the normal CFR
was 2.70 to 6 which suggests a degree of patient
variability and microvascular disease.
85. • In patients with essential hypertension and normal
coronary arteries or in patients with aortic stenosis
and normal coronary arteries, CFR may be reduced,
in part because of myocardial hypertrophy and an
abnormal microvasculature.
• CFR can be altered by changes in either basal or
hyperemic flow, which are influenced by
hemodynamics, loading conditions, and
contractility.
• For example, tachycardia increases basal flow and
decreases hyperemic flow, thus reducing CFR 10%
for each 15-beat increase in heart rate.
86. • Because CFR is a summed response of both the epicardial and
microvascular flow, clinicians are reluctant to use CFR as the
sole indicator of lesion significance except when it is normal.
• To increase confidence in CFR as a measure of lesion severity,
the determination of relative CFR (rCFR) has been proposed by
Gould et al,3 who defined rCFR as the ratio of maximal flow in a
coronary artery with stenosis (QS) to maximal flow in a normal
coronary artery without a stenosis (QN).
• It was shown that rCFR was independent of the aortic pressure
and rate–pressure product and was well suited to assess the
physiological significance of coronary stenoses when an
adjacent nondiseased coronary artery was available
• For invasive catheterization laboratory flow studies, rCFR was
defined as the ratio of CFRtarget to CFRnormal reference vessel:
87. • The normal range for rCFR is 0.8 to 1.0.
• Because of the variability of CFR and limitations in patients with
multivessel CAD, rCFR is not commonly used.
• Likewise, rCFR relies on the assumption that the microvascular
circulatory response is uniformly distributed among the myocardial
beds; thus, rCFR is of no value in patients with myocardial infarction
(MI) or left ventricular regional dysfunction or in patients in whom the
microcirculatory responses may be heterogeneous (eg, those with
myocardial fibrosis or asymmetric hypertrophy).
• In clinical terms, CFR is best used to assess the microcirculation in the
absenceof epicardial artery narrowings.
• CFR is not used to assess stenosis significance because of the influence
of hemodynamics and the unknown impact of the microcirculation.
88. Rentrop Grade ofCollateral
Filling
• Rentrop et al. proposed the system below to grade collateral filling of
recipient arteries:
• Rentrop Grade0
No visible filling of any collateral channels.
• Rentrop Grade1
Collateral filling of branches of the infarct related artery.
• Rentrop Grade2
Partial collateral filling of the epicardial segment of the infarct related
artery .
• Rentrop Grade3
Complete collateral filling of the infarct related artery.
89. Laminar flow
• Laminar flow is the normal condition for blood flow throughout most
of the circulatorysystem.
• It is characterized by concentric layers of blood moving in parallel
down the length of a blood vessel.
• The highest velocity (Vmax) is found in the center of the vessel.
• The lowest velocity (V=0) is found along the vessel wall.
• The flow profile is parabolic once laminar flow is fully developed. This
occurs in long, straight blood vessels, under steady flow conditions.
• One practical implication of parabolic, laminar flow is that when flow
velocity is measured using a Doppler flowmeter, the velocity value
represents the average velocity of a cross-section of the vessel, not the
maximal velocity found in the center of the flow stream.
• The orderly movement of adjacent layers of blood flow through a
vessel helps to reduce energy losses in the flowing blood by
minimizing viscous interactions between the adjacent layers of blood
and the wall of the blood vessel.
• Disruption of laminar flow leads to turbulence and increased energy
losses.
90.
91. Turbulent Flow
• Generally in the body, blood flow is laminar. However, under
conditions of high flow, particularly in the ascending aorta,
laminar flow can be disrupted and become turbulent.
• When this occurs, blood does not flow linearly and smoothly in
adjacent layers, but instead the flow can be described as being
chaotic.
• Turbulent flow also occurs in large arteries at branch points, in
diseased and narrowed (stenotic) arteries (see figure below),
and across stenotic heart valves.
92. • Turbulence increases the
energy required to drive
blood flow because
turbulence increases the loss
of energy in the form of
friction, which generates
heat.
• When plotting a pressure-
flow relationship (see figure
to right), turbulence increases
the perfusion pressure
required to drive a given flow.
• Alternatively, at a given
perfusion pressure,
turbulence leads to a decrease
in flow.
93. Viscosity of Blood
• Viscosity is an intrinsic property of fluid related to the internal friction of
adjacent fluid layers sliding past one another
• This internal friction contributes to the resistance to flow.
• The interactions between fluid layers depend on the chemical nature of the
fluid, and whether it is homogeneous or heterogeneous in composition.
• For example, water is a homogeneous fluid and its viscosity is determined by
molecular interactions between water molecules.
• Water behaves as a Newtonian fluid and therefore under non-turbulent
conditions, its viscosity is independent of flow velocity (i.e., does not change
with changes invelocity).
• Although plasma is mostly water, it also contains other molecules such as
electrolytes, proteins (especially albumin and fibrinogen), and other
macromolecules.
• Because of various molecular interactions between these many different
components of plasma, it is not surprising that plasma has a higher viscosity
than water.
• In fact, plasma at 37°C is about 1.8-times more viscous than water at the same
temperature; therefore, the relative viscosity of plasma (compared to water)
is about 1.8.
94. • The addition of formed elements to the plasma (red cells, white cells, and
platelets) further increases the viscosity.
• Of these formed elements, red cells have the greatest effect on viscosity under
normal conditions.
• As shown in the figure to the right in which whole blood viscosity is
determined in vitro using a viscometer, an increase in red cell hematocrit
leads to an increase in relative viscosity.
• Note that the increase is non-linear, so that doubling hematocrit more than
doubles the relative viscosity.
• Therefore, blood viscosity strongly depends on hematocrit.
• At a normal hematocrit of 40-45%, the relative viscosity of blood is 4-5.
• Patients with a condition called polycythemia, which is a abnormal elevation
in red cell hematocrit, have much higher blood viscosities.
• This increases the resistance to blood flow and therefore increases the work of
the heart and can impair organ perfusion.
• Some patients with anemia have low hematocrits, and therefore reduced
blood viscosities.
95.
96. • Asecond important factor that influences blood viscosity is
temperature.
• Just like molasses, when blood gets cold, it get "thicker" and flows
more slowly.
• Therefore, there is an inverse relationship between temperature and
viscosity.
• Viscosity increases about 2% for each degree centigrade decrease in
temperature.
• Normally, blood temperature does not change much in the body.
However, if a person's hand is exposed to a cold environment and the
fingers become cold, the blood temperature in the fingers will fall and
viscosity increase, which together with sympathetic-mediated
vasoconstriction will decrease blood flow in the cooled region.
• When whole body hypothermia is induced in critical care or surgical
situations, this will also lead to an increase in blood viscosity and
therefore affect systemic hemodynamics and organ blood flow.
97. • Unlike water, blood is non-Newtonian, meaning
that viscosity is not independent of flow at all flow
velocities. In fact, during conditions such as
circulatory shock where microcirculatory flow in
tissues is reduced because of decreased arterial
pressure, low flow states can lead to several-fold
increases in viscosity. Low flow states permit
increased molecular interactions to occur between
red cells and between plasma proteins and red cells.
This can cause red cells to stick together and form
chains of several cells (rouleau formation) within
the microcirculation, which increases the blood
viscosity.
98. • If clotting mechanisms are stimulated in
the blood, platelet aggregation and
interactions with plasma proteins occur.
This leads to entrapment of red cells and
clot formation, which dramatically increase
blood viscosity.
99. • There is a microcirculatory phenomenon called the Fahraeus-
Lindqvist effect that leads to a reduction in hematocrit in
small arterioles (less than 200 microns in diameter) and
capillaries relative to the hematocrit of large feed arteries. This
decrease in hematocrit in these flow vessels reduces the relative
blood viscosity in the small vessels, which helps to offset the
increase in viscosity that can occur because of reduced velocity
in these same vessels. The net effect of these changes is that
blood flow in the microcirculation has a lower viscosity than
what is predicted by in vitro blood viscometer measurements. In
vivo measurements of blood viscosity were made in dog
hindlimbs in 1933by Whittaker and Winton (J. Physiol. 78:339,
1933).At a given arterial blood hematocrit, the relative viscosity
of blood is much lower than predicted from in vitro experiments
(compare figure at right with previous figure that used a
viscometer).