This document presents a study on developing an automatic image processing method to detect and count red blood cells from peripheral blood smear microscope images. The method first uses various image processing techniques like histogram equalization, edge detection, dilation and erosion to extract individual red blood cells from the images. Neural networks are then used to classify the extracted cells as red blood cells, white blood cells or sickle red blood cells. Only the cells classified as red blood cells are counted. The study found that the proposed method achieved a sensitivity of 0.86, specificity of 0.76 and accuracy of 0.74 compared to manual counting. This automatic method can help reduce the workload and tedium of manual blood cell counting.
![RED BLOOD CELLS EXTRACTION AND COUNTING
J. Poomcokrak1
and C. Neatpisarnvanit2
1
Department of Biomedical Engineering, Mahidol University, Thailand
2
Department of Electrical Engineering, Mahidol University, Thailand
ABSTRACT
Blood cell counting by laboratory task utilizes
hemocytometer and microscope. The conventional task
depends on physician skill. It is laborious. This paper
shows the effectiveness of an automatic image processing
method to detect normal red blood cells (RBCs) by
peripheral blood smear microscope image. When single
RBCs were extracted from sickle RBCs and white blood
cells (WBCs) component, its images were analyzed and
classified by neural network. Next RBCs were counted
and displayed. This study found the method proposed
system has sensitivity 0.86, specificity 0.76 and accuracy
0.74.
1. INTRODUCTION
Blood is a connective tissue consisting of cells suspended
in plasma. Blood’s major functions are to transport
various agents such as oxygen, carbon dioxide, nutrients,
wastes, and hormones. Blood cells are composed of
erythrocytes (red blood cells, RBCs), leukocytes (white
blood cells, WBCs) and thrombocytes (platelets). The
most abundant small reddish cells are erythrocytes and
called red blood cell. An erythrocyte is a discoid cell
with a thick rim and a thin sunken center [1]. RBCs’ two
principal functions are to move oxygen from lung to
tissues elsewhere and transport carbon dioxide from
tissues to the lung. Whereas, the Leukocytes or white
blood cells are part of the immune system.
The conventional device used to count blood
cells is the hemocytometer. It consists of a thick glass
microscope slide with a rectangular indentation creating a
chamber of certain dimensions. This chamber is etched
with a grid of perpendicular lines. It is possible to count
the chamber of cells in a specific volume of fluid, and
calculate the concentration of cells in the fluid [2,3]. To
count blood cell, physician must view hemocytometer
through a microscope and count blood cells using hand
tally counter. The overlapped blood cells on the top-side
and right-side of hemocytometer are not counted.
Normally, the counting task is time-consuming and
laborious. Several attempts have been made to mimic the
procedure of cell recognition from image. The major
application of neural networks was devoted to the WBCs
classification via extracted morphologic parameters [4-6].
Some red blood cell classification task using
neural network was adapted for Thalassemia diagnostic
tool [7]. Many commercially available products have
been developed to automatically count RBCs or WBCs
[8]. Their advantages include automatic cell counting
cells without hand tally counter, no requirement of messy
washing and no associated biohazard. However, these
products are expensive.
2. EXPERIMENT
This work aims to apply image processing to extract the
blood image taken from blood smear microscope, then
automatically counting red blood cells. This work can
help release physicians from tedious and laborious blood
cell counting task. The images of blood cell was
digitized by the optical microscope. The composition of
blood image consists of red blood cells, white blood cells
and sickle red blood cells. The image was analyzed by
manually looking for red blood cells. After that, the red
blood cells were counted using the proposed red blood
cell counting method, automatically. The proposed
method consists of three steps. The first step is to apply
an image processing to delete incompleted blood cells
that overlap on the boundary of the image. Then, single
blood cells were extracted from the image using edge
detection algorithm [6] and each single blood cells image
scale to 31x30 pixel. Finally, each single blood cells
were analyzed by using a neural network to search for red
blood cells and count them. An overall procedure is
shown in Fig. 1.
Digital image processing was extensively used
in this work. It is the key performance index to establish
the ability of the proposed method [9].
2.1. Image processing
The main image processing tasks consists of enhancing
the image's qualities and deleting overlapped blood cells
in the boundary area of the image. Both tasks can be
subdivided into smaller tasks as shown in Fig. 2
illustrating the main steps and examples of input/output
images.
2.1.1 Histogram equalization
This process adjusts intensity values of the image by
performing histogram equalization involving intensity
transformation, so that the histogram of the output image
approximately matches a predefined histogram.
The 3rd International Symposium on Biomedical Engineering (ISBME 2008) 199](https://image.slidesharecdn.com/0b17a534-e3d2-436d-be52-7bea0e2fce80-161101185122/85/RBC-1-320.jpg)
![original image
Figure 1. A proposed red blood cell counting
procedure
2.1.2 Contrast and brightness adjustment
To adjust brightness of an image, an histogram of the
interested image is used to determine data and display
ranges of the image. The data range is the range of
intensity values actually used in the image. The display
range is the black-to-white mapping used to display the
image determined by the image class. Contrast
adjustment is done by manipulating the display range of
the histogram while the data range of the image remains
constant.
2.1.3 Cell detection
The major challenge of red blood cell detection is the
incomplete or overlapped blood cells around the
boundary area of an image. The objective of blood cell
detection is to detect cells which differentiate themselves
from the background in terms of contrast. Changes in
contrast can be detected by image processing operators
that calculate the gradient of an image. Then a threshold
can be applied to create a binary mask containing the
segmented cell.
The edge detection is done by using the Sobel
operator. The broader of the blood membranes were
enhanced. An edge enhanced gray level image is thus
produced. Next, the Canny method is applied to search
for edges by looking for local maxima of the gradient.
The gradient is calculated using the Gaussian kernel. The
proposed method applies two threshold values, to detect
strong and weak edges, and includes the weak edges in
the output only if they are connected to the strong edges.
2.1.4 Image dilation
The first step is to apply morphological operator to create
a structuring element specified by interested shapes, disk-
shaped structuring element. Depending on shape
structures, disk-shaped approximation are suitable for
computing granulometrics. Disk-shaped structuring
element is approximated by specifies radius from the
origin of granule. The structuring element members,
binary gradient mask, consist of all pixels whose no
greater than radius away from the origin. Then the binary
gradient mask is dilated using the vertical structuring
element followed by the horizontal structuring element.
The dilation morphological operator has been used to
better connect separated points of the membrane [6].
2.1.5 Interior gap filling
The dilated gradient mask shows the outline of the blood
cell quite nicely, but there are still holes in the interior of
the cell. Filling internal holds of the connected element
get the biggest area in the processed image.
2.1.6 Object smoothening (Erosion)
All of blood cells of interest has been successfully
segmented. Finally, in order to make the segmented
object look better, the objects in the processed image can
be smoothed by eroding the image. This step reduces the
spur elements along the membrane edges. Figure 3
shows the outline of the resulting smoothed image.
2.2. Single blood cell extraction
This method extracts the single blood cell from the
derived binary image to obtain cell’s position. The single
blood cells extraction involves several steps as described
in the following topics.
2.2.1 Border padding
As the neighborhood operator block slides over the entire
image, some of the pixels around the border may be
missing, if the center pixel is on the border of the image.
The missing pixels will be padded using 0 value (black)
to complete the image.
2.2.2 Centroid finding
The centroid of the converted binary image is measured
by finding the center of mass of the binary image region.
The centroid coordinates are definded as x-coordinate
and y-coordinate. All other elements of centroid are in
order of dimension.
2.2.3 Single blood cell isolation window.
Image processing
Single blood cell extraction
Single cell analysis and classification by
Neural Network
Red blood cells counting
200 The 3rd International Symposium on Biomedical Engineering (ISBME 2008)](https://image.slidesharecdn.com/0b17a534-e3d2-436d-be52-7bea0e2fce80-161101185122/85/RBC-2-320.jpg)
![Neural networks have been applied very
successfully in the identification and control of dynamic
systems[10]. Neural networks are composed of simple
elements operating in parallel. The network function is
determined largely by the connections between elements.
We can train a neural network to perform a particular
function by adjusting the values of the connections
(weights) between elements. Multilayer perceptron
(MLP) neural networks using are adjusted or trained, so
that a particular input leads to an output value of each
blood cell window. Neural network consists of three
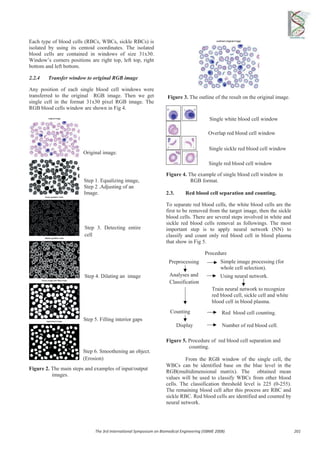
fully connected layers as shown in Fig 6. There are 930
input nodes in the input layer, 10 hidden nodes in hidden
layer, two bias constants, and one output in output layer.
This is a simple structure which is fully connected. The
number of hidden nodes was chosen on the basis of trials
and errors with the training set to be as low as possible.
Figure 6. Structure of neural network in this study.
The training patterns were prepared and
assessed, manually. They consist of 59 RBCs patterns
and 59 non RBCs (sickle RBCs and WBCs) patterns.
Each pattern was scaled to 31x30 pixel image. The
images were converted to grayscale and inputted to train
neural network with hyperbolic tangent sigmoid transfer
function. The output from neural network are given the
value between -0.9 to 0.9 with respect to target value -1
(non RBCs) and 1 (RBCs). The mean squared error was
calculated when each pattern was presented. The weights
in neural network were trained to obtain the 0.001 mean
squared error with 5,000 epochs.
The values obtained from neural network step
were used to separate sickle RBCs from normal RBCs.
The (31x30 pixel) images from image processing step
were validation set. The number of normal RBCs are
counted using result from neural network.
3. RESULT AND DISCUSSION
The image was processed by image processing steps. The
original image that shown in the task was very bright.
The steps of equalizing and adjusting of an image could
effect the contrast of blood cells from the background.
Edges of blood cells wound be clearly shown. Next,
detecting entire cell step caused binary image lines. The
lines were formed by contrast in the image. Then dilating
an image would thicken lines. Finally, filling interior
gaps and smoothening an object would only show blood
cells.
The procedure of single blood cells extraction
gave blood cell windows (31x30 pixel). The parameters
of the proposed windows were chosen from data set. In
Fig 4, blood cells completely appeared in the windows
but there were some parts of the neighbor blood cells.
Results of final extraction RBCs and WBCs that overlap
on the boundary of the image were not extracted. RBCs,
WBCs and sickle RBCs collapsed on the other blood cell
were not extracted. The RBCs counting achieves 59 out
of 68 isolation task. The results were showed in table 1.
Figure 7 shows the comparison between a case of
incorrect isolation with correct isolation.
Original
image
Final
extraction
Red blood cell overlapping the
rim
2 0
Overlapped Red blood cell 2 0
Red blood cell 68 59
Sickle red blood cell 6 3
Overlapped sickle red blood
cell
1 0
White blood cell overlapping
the rim
1 0
White blood cell 5 1
Table 1. RBCs detection results
.
Figure 7. Comparison between incorrect and correct
RBCs isolation.
From the above figure, the sickle RBCs were separated as
RBCs by the proposed algorithm. Because it is big when
comparing to the contained window, like normal RBCs.
Nevertheless, this problem could be solved by increasing
training sickle RBCs patterns in neural network. The
results were calculated by the following equation.
31x30
Input
layer
10 node
hidden layer
output
layer
1
2
930
h1
h10
O1
Bias Bias
Sickle RBCs (incorrect) window
normal RBCs (correct) window
202 The 3rd International Symposium on Biomedical Engineering (ISBME 2008)](https://image.slidesharecdn.com/0b17a534-e3d2-436d-be52-7bea0e2fce80-161101185122/85/RBC-4-320.jpg)
![Sensitivity = TP/(TP+FN)
Specificity = TN/(TN+FP)
Accuracy = (TP+TN)/(TP+FP+FN+TN) (1)
When TP (True Positive) is RBCs counted. TN (True
Negative) is non RBCs and is not counted. FP (False
Positive) is non RBCs counted. FN (False Negative) is
RBCs but it is not counted. From the result, the method
has sensitivity = 0.86, specificity = 0.76 and accuracy =
0.74. The proposed algorithm offers medium-to-high
accuracy, but it automates the RBCs counting.
4. CONCLUSION
This work aimed to study the possibility of red blood
cells counting. Further more, study of the collapsed red
blood cells should be done in order to get more accuracy.
Results show that the automatic red blood cell extraction
and counting start from image processing then single
blood cell extracted and finally separating red blood cell
offers 74% accuracy or better. Authors believe that the
classifier (multi layer perceptron neural networks) is
suitable for the RBCs counting application. Higher
accuracy can be achieved when the number of sample
training images is increased.
REFERENCES
[1] K.S. Saladin, Anatomy and Physiology: The unity of
form and function, McGraw-Hill, NY, 4th
, chap. 18, pp.
680-696, 2007.
[2] J.P. Mather and P.E. Roberts, Introduction to cell and
tissue culture: Theory and Technique, Plenum Press, NY
and London, 1998.
[3] D.R. Caprette, “Introduction Laboratory : using a
counting chamber,” Bios211, 2007.
[4] Q. Zheng, B.K. Milthorpe, and A.S. Jones, “Direct
neural network application for automated cell
recognition,” Cytometry 57A, pp. 1-9, 2004.
[5] T. Markiewidz and S. Osowski, “ Data mining
techniques for feature selection in blood cell
recognition,” in Proc. ESANN. Symp. Bruges, BG, pp.
407-412, April 2006.
[6] F. Scotti, “Automatic Morphological Analysis for
Acute Leukemia Identification in Peripheral Blood
Microscope Images,” in Proc. IEEE Int. Symp. CIMSA,
Giardini Naxos, Italy, pp. 96-101, July 2005.
[7] W. Wongseree and N. Chaiyaratana, “Thalassemic
Patient Classification Using a Neural Network and
Genetic Programming,” IEEE, pp. 2926-2931, 2003.
[8] Effector Cell Institute, Inc, “CYTOREONTM
,”
news, Tokyo, Japan, December 2007.
[9] R.G. Gonzalez, R.E. Woods and S.L. Eddins, Digital
Image Using MATLAB Processing, Pearson Education,
Inc. NJ, chap. 9, pp. 334-377, chap. 10, pp. 378-425,
2004.
[10] S. Kumar, NEURAL NETWORK. A classroom
approach, McGraw-Hill, Singapore, International Edition,
chap. 5, pp. 104-156, 2005.
The 3rd International Symposium on Biomedical Engineering (ISBME 2008) 203](https://image.slidesharecdn.com/0b17a534-e3d2-436d-be52-7bea0e2fce80-161101185122/85/RBC-5-320.jpg)