An Interactive Genome Visualization Tool Using DECIPHER Data
•Download as PPT, PDF•
0 likes•30 views

Poster - DECIPHER Symposium 2009
Recommended

Recommended
More Related Content
Similar to An Interactive Genome Visualization Tool Using DECIPHER Data
Similar to An Interactive Genome Visualization Tool Using DECIPHER Data (20)
More from Rafael C. Jimenez
More from Rafael C. Jimenez (20)
Recently uploaded
Recently uploaded (20)
An Interactive Genome Visualization Tool Using DECIPHER Data
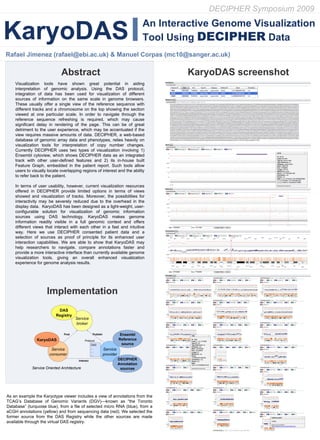
- 1. An Interactive Genome Visualization Tool Using DECIPHER Data DECIPHER Symposium 2009 Rafael Jimenez (rafael@ebi.ac.uk) & Manuel Corpas (mc10@sanger.ac.uk) Visualization tools have shown great potential in aiding interpretation of genomic analysis. Using the DAS protocol, integration of data has been used for visualization of different sources of information on the same scale in genome browsers. These usually offer a single view of the reference sequence with different tracks and a chromosome on the top showing the section viewed at one particular scale. In order to navigate through the reference sequence refreshing is required, which may cause significant delay in rendering of the page. This can be of great detriment to the user experience, which may be accentuated if the view requires massive amounts of data. DECIPHER, a web-based database of genomic array data and phenotypes, relies heavily on visualization tools for interpretation of copy number changes. Currently DECIPHER uses two types of visualization involving 1) Ensembl cytoview, which shows DECIPHER data as an integrated track with other user-defined features and 2) its in-house built Feature Graph, embedded in the patient report. Such tools allow users to visually locate overlapping regions of interest and the ability to refer back to the patient. In terms of user usability, however, current visualization resources offered in DECIPHER provide limited options in terms of views showed and visualization of tracks. Moreover, the possibilities for interactivity may be severely reduced due to the overhead in the display data. KaryoDAS has been designed as a light-weight, user- configurable solution for visualization of genomic information sources using DAS technology. KaryoDAS makes genome information readily visible in a full genomic context and offers different views that interact with each other in a fast and intuitive way. Here we use DECIPHER consented patient data and a selection of sources as proof of principle for its enhanced user interaction capabilities. We are able to show that KaryoDAS may help researchers to navigate, compare annotations faster and provide a more interactive interface than currently available genome visualization tools, giving an overall enhanced visualization experience for genome analysis results. sources and displaying their content in a genomic context. The applicability of DAS is also extended to protDASein sequence and structure data integrating major protein databases like CATH, SCOP, MSD, InterPro, and Pfam. DAS clients like SPICE and Dasty query DAS sources to display protein annotations and related 3D structure and genome information. DAS genome browsers are specialized to concentrate on derived features over specific genome regions, in particular, gene structures and protein sequences. However these systems are not designed for visually representing features on a higher level of genome compaction. Interpretation of genome information like copy number aberrations requires viewing the data in its full genomic context. Thus, such genome browser do not employ an effective exploratory visualization on a higher representation level. As a solution we propose an exploratory information approach to integrate genome information and make it readily visible in a manner that allows easy interpretation of their full genomic context. We have developed a Karyotype DAS client, a highly interactive web client to aid researchers to visualize, share and compare annotations coming from DAS sources and genome analysis DAS results. To aid researchers to include exploratory analysis and tailored functional genomics results we are working on the next version of GEPAS (The Gene Expression Profile Analysis Suite) to offer results in DAS format. Moreover we have created a virtual DAS registry which allows researchers with little knowledge about DAS to make their custom annotations accessible in DAS format. Thus, researchers can integrate their annotations and analysis results on our DAS client or any of the other DAS browsers. Abstract Implementation As an example the Karyotype viewer includes a view of annotations from the TCAG’s Database of Genomic Variants (DGV)—known as “the Toronto Database” (turquoise blue), from a file of selected micro RNA (blue), from a aCGH annotations (yellow) and from sequencing data (red). We selected the former source from the DAS Registry while the other sources are made available through the virtual DAS registry. KaryotypeDASviewer KaryoDAS Service broker Service consumer Service provider Interact PublishFind Service Oriented Architecture DAS ... ... ... DAS Registry Ensembl Reference source DECIPHER Annotation sources KaryoDAS Protocol KaryoDAS screenshot