IIP Note
•
0 likes•121 views

IIP numbers disappoint for a second month on account of de-growth in capital goods
Recommended

Recommended
More Related Content
What's hot
What's hot (19)
Similar to IIP Note
Similar to IIP Note (20)
More from Fullerton Securities
More from Fullerton Securities (20)
Recently uploaded
Recently uploaded (20)
IIP Note
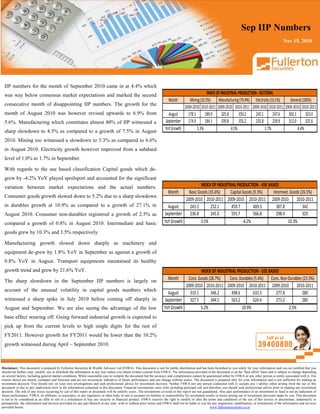
- 1. Disclaimer: This document is prepared by Fullerton Securities & Wealth Advisors Ltd (FSWA). This document is not for public distribution and has been furnished to you solely for your information and you are notified that you should not further copy, modify, use or distribute the information in any way unless you obtain written consent from FSWA. The information provided in the document is on the "best effort" basis and is subject to change depending on several factors, including general market conditions. While reasonable care to compile the document but the accuracy and completeness cannot be guaranteed either by FSWA or any other person or entity associated with it. The returns shown are merely estimates and forecasts and are not necessarily indicative of future performance and can change without notice. The document is prepared only for your information and is not sufficient for making an investment decision. You should rely on your own investigations and seek professional advice for investment decision. Neither FSWA nor any person connected with it, accepts any l iability either arising from the use of this document or due to any inadvertent error in the information contained in this document. Financial investments carry risks including principal risk and therefore you should seek professional advice prior to making any investment decision. The risk of any losses occurring by use of this report or document will be entirely yours. The investments covered in this report are not guaranteed. Also past performance of an investment or fund is not an indication of future performance. FSWA, its affiliates, or associates, or any regulatory or other body or enti ty assumes no liability or responsibility for investment results or losses arising out of investment decisions made by you. This document is not to be considered as an offer to sell or a solicitation to buy any security or financial product. FSWA reserves the right to modify or alter the terms and conditions of the use of this service or discontinue, temporarily or permanently, the information and services provided (or any part thereof) at any time, with or without prior notice and FSWA shall not be liable to you for any suspension, modification, or termination of the information and services provided herein. www.fullertonsecurities.co.in Sep IIP Numbers Nov 15, 2010 IIP numbers for the month of September 2010 came in at 4.4% which was way below consensus market expectations and marked the second consecutive month of disappointing IIP numbers. The growth for the month of August 2010 was however revised upwards to 6.9% from 5.6%. Manufacturing which constitutes almost 80% of IIP witnessed a sharp slowdown to 4.5% as compared to a growth of 7.5% in August 2010. Mining too witnessed a slowdown to 5.3% as compared to 6.6% in August 2010. Electricity growth however improved from a subdued level of 1.0% to 1.7% in September. With regards to the use based classification Capital goods which de- grew by -4.2% YoY played spoilsport and accounted for the significant variation between market expectations and the actual numbers. Consumer goods growth slowed down to 5.2% due to a sharp slowdown in durables growth at 10.9% as compared to a growth of 27.1% in August 2010. Consumer non-durables registered a growth of 2.5% as compared a growth of 0.8% in August 2010. Intermediate and basic goods grew by 10.3% and 3.5% respectively. Manufacturing growth slowed down sharply as machinery and equipment de-grew by 1.8% YoY in September as against a growth of 0.8% YoY in August. Transport equipments maintained its healthy growth trend and grew by 21.6% YoY. The sharp slowdown in the September IIP numbers is largely on account of the unusual volatility in capital goods numbers which witnessed a sharp spike in July 2010 before coming off sharply in August and September. We are also seeing the advantage of the low base effect wearing off. Going forward industrial growth is expected to pick up from the current levels to high single digits for the rest of FY2011. However growth for FY2011 would be lower than the 10.2% growth witnessed during April – September 2010. Month 2009-2010 2010-2011 2009-2010 2010-2011 2009-2010 2010-2011 2009-2010 2010-2011 August 178.1 189.9 325.8 350.2 245.1 247.6 302.1 323.0 September 174.9 184.1 339.8 355.2 235.8 239.9 312.0 325.6 YoYGrowth INDEXOFINDUSTRIALPRODUCTION-SECTORAL 5.3% 4.5% 1.7% 4.4% Mining(10.5%) Manufacturing(79.4%) Electricity(10.1%) General(100%) Month 2009-2010 2010-2011 2009-2010 2010-2011 2009-2010 2010-2011 August 243.3 252.1 459.7 469.3 307.8 342 September 236.8 245.0 591.7 566.8 298.4 329 YoY Growth INDEX OF INDUSTRIAL PRODUCTION - USE BASED Basic Goods (35.6%) Capital Goods (9.3%) Intermed. Goods (26.5%) 3.5% -4.2% 10.3% Month 2009-2010 2010-2011 2009-2010 2010-2011 2009-2010 2010-2011 August 319.1 346.2 498.6 633.5 277.8 280 September 327.5 344.5 563.2 624.4 273.2 280 YoY Growth INDEX OF INDUSTRIAL PRODUCTION - USE BASED Cons. Goods (28.7%) Cons. Durables (5.4%) Cons. Non-Durables (23.3%) 5.2% 10.9% 2.5%