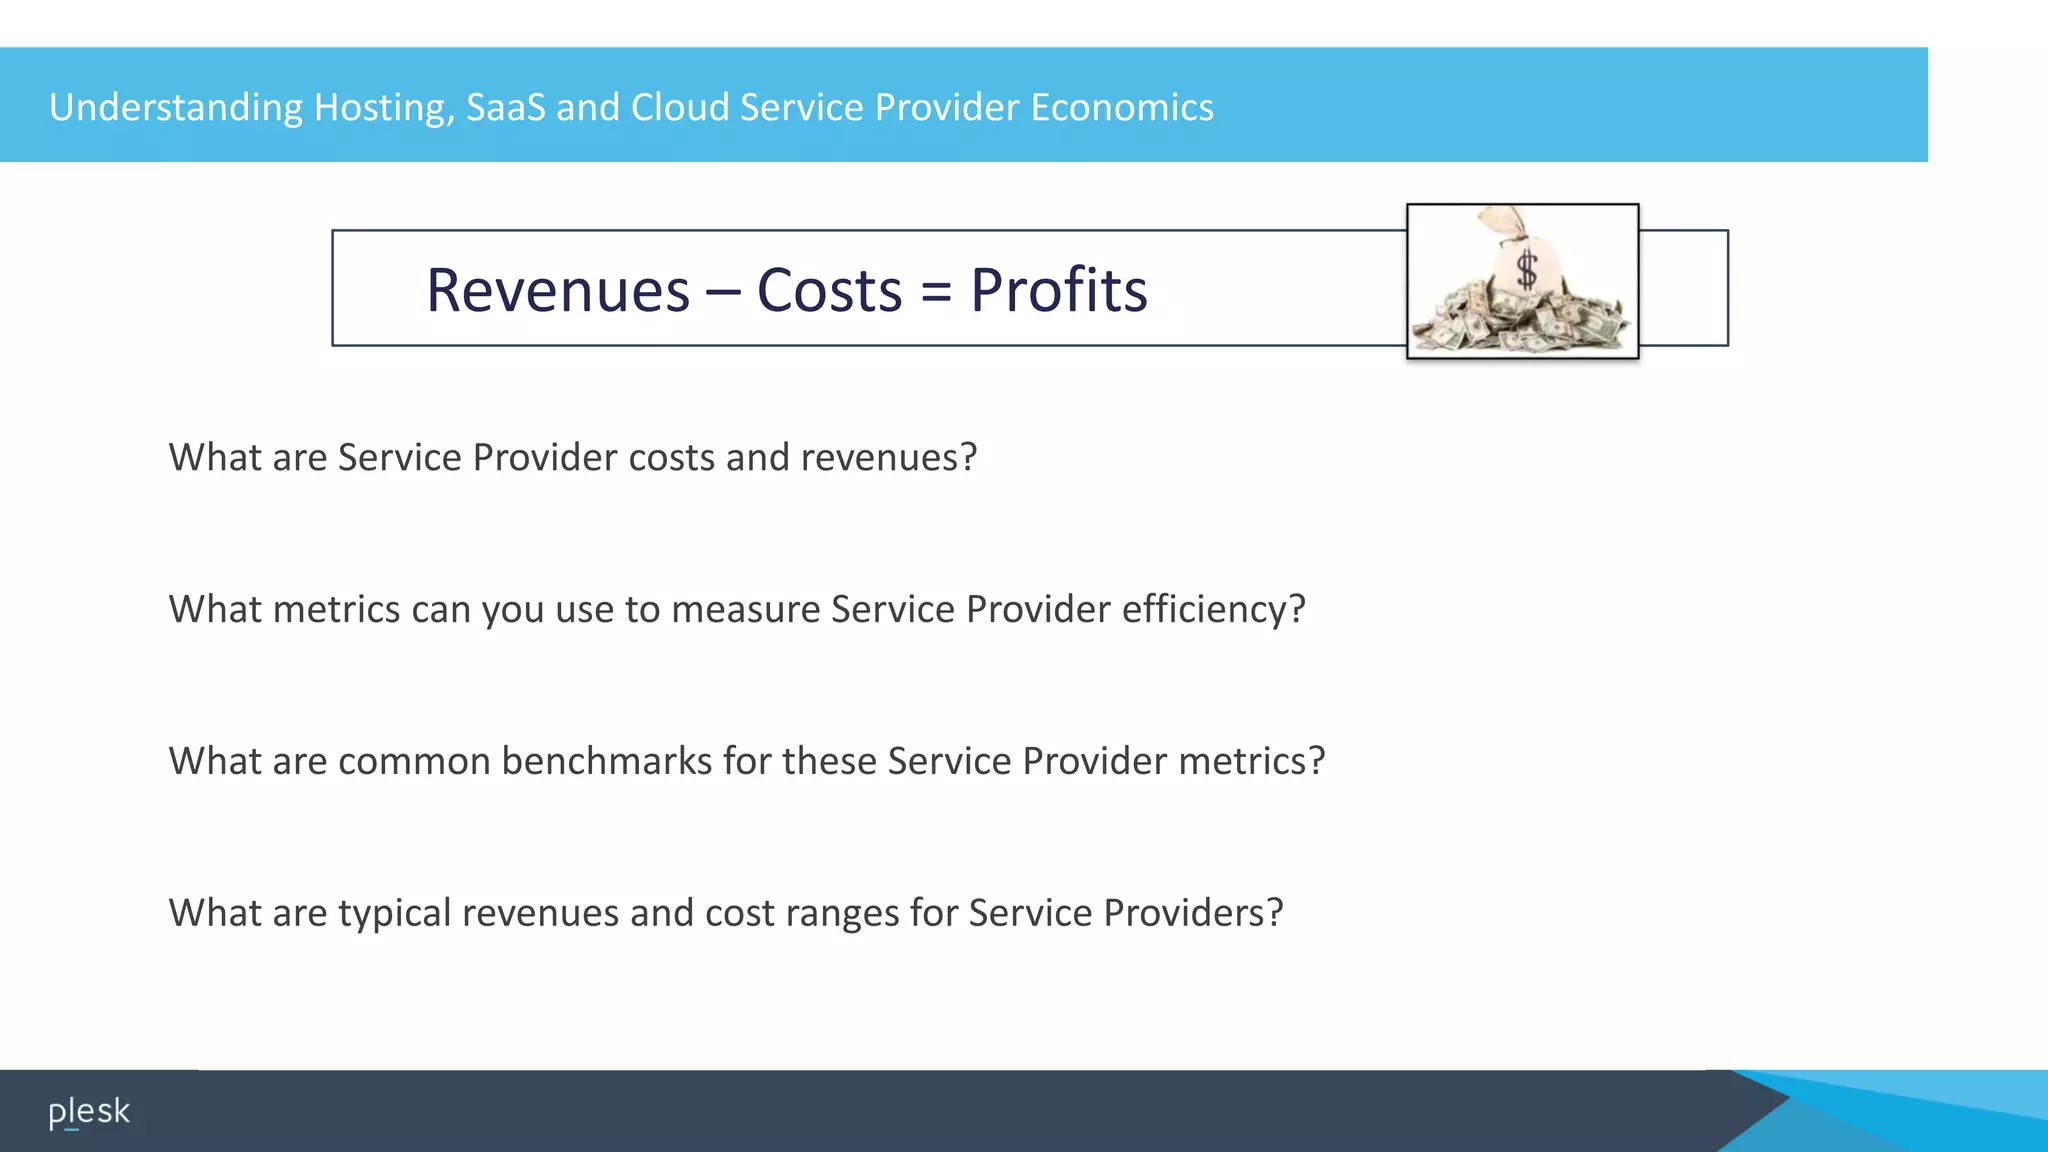
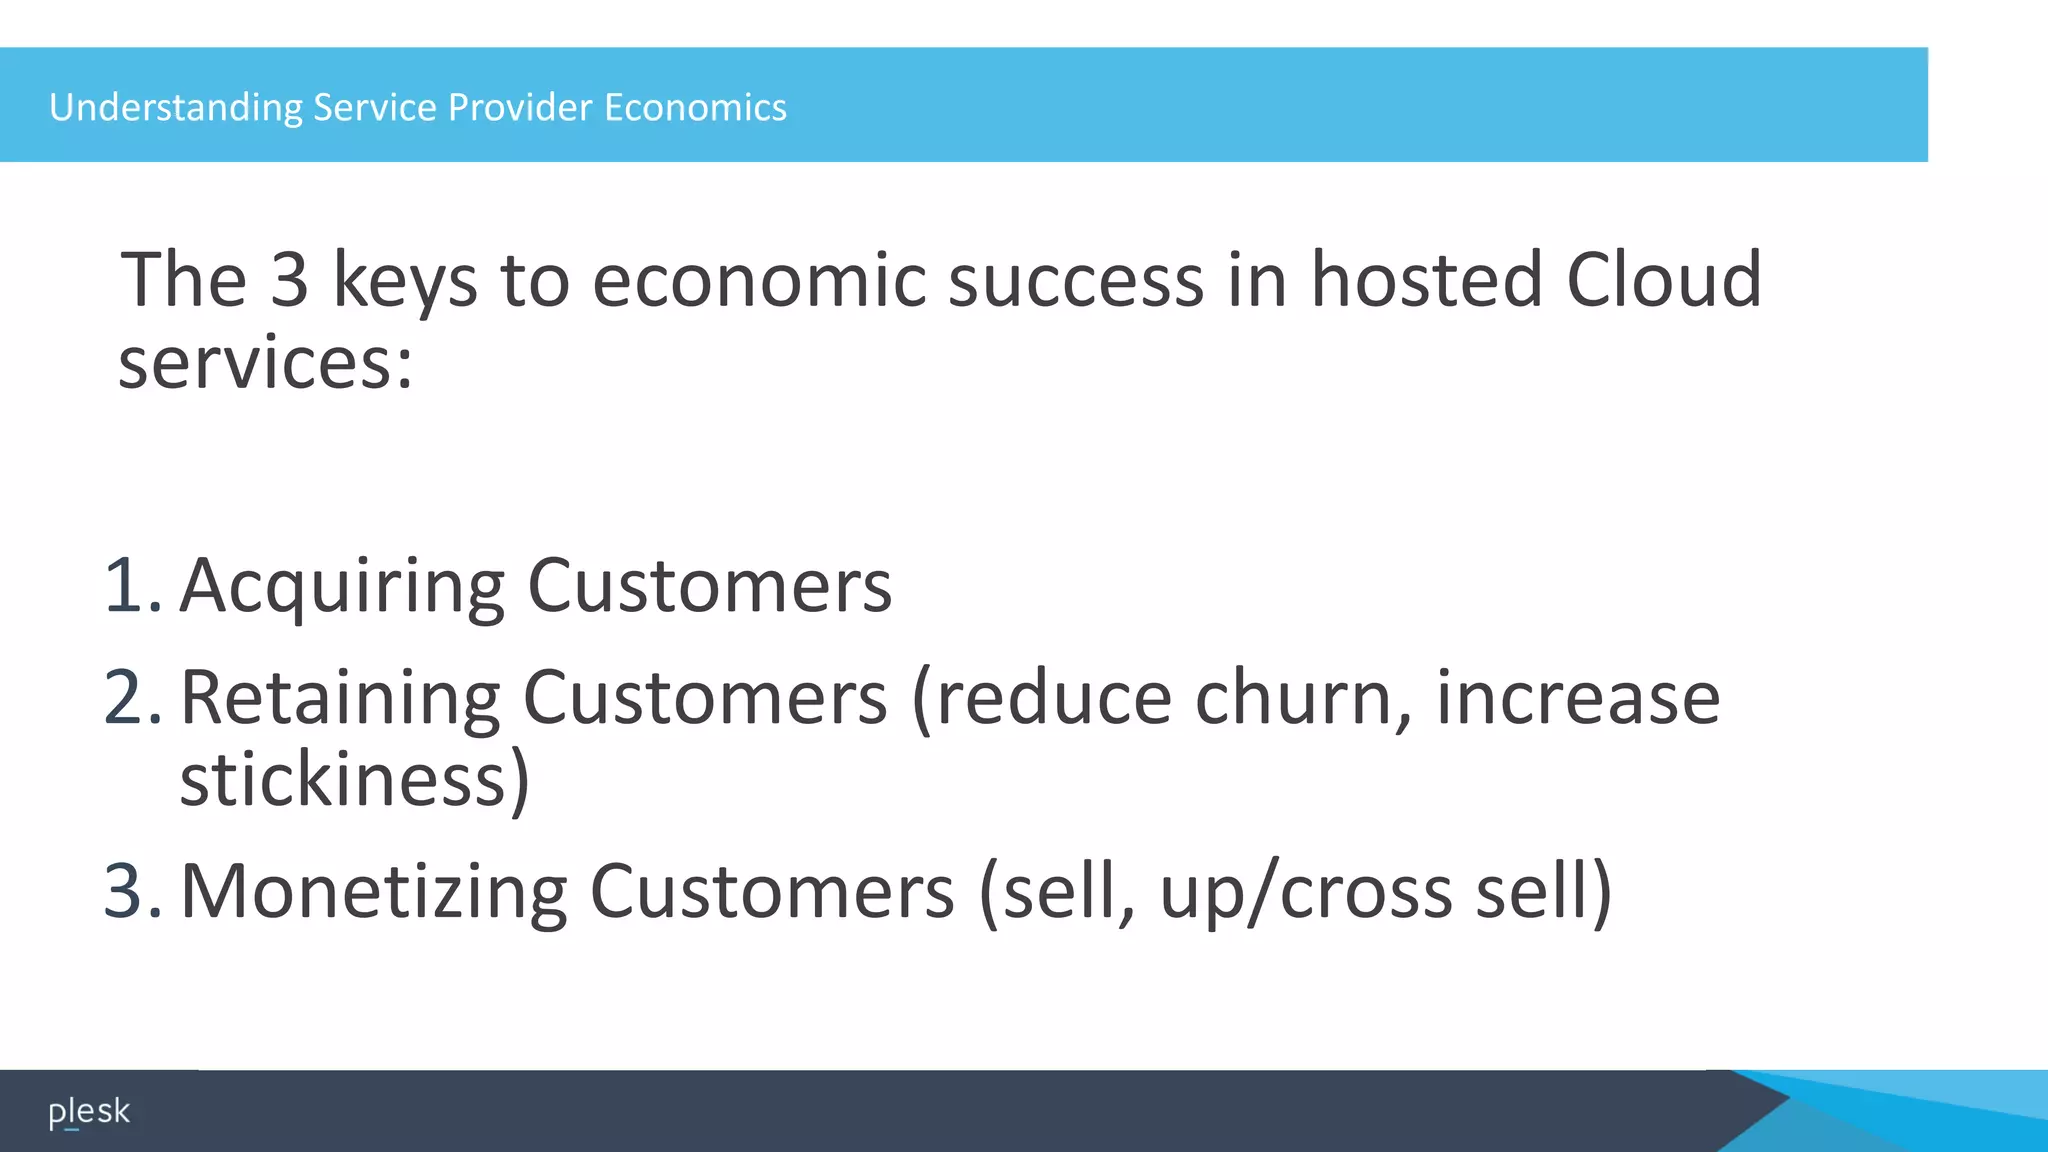
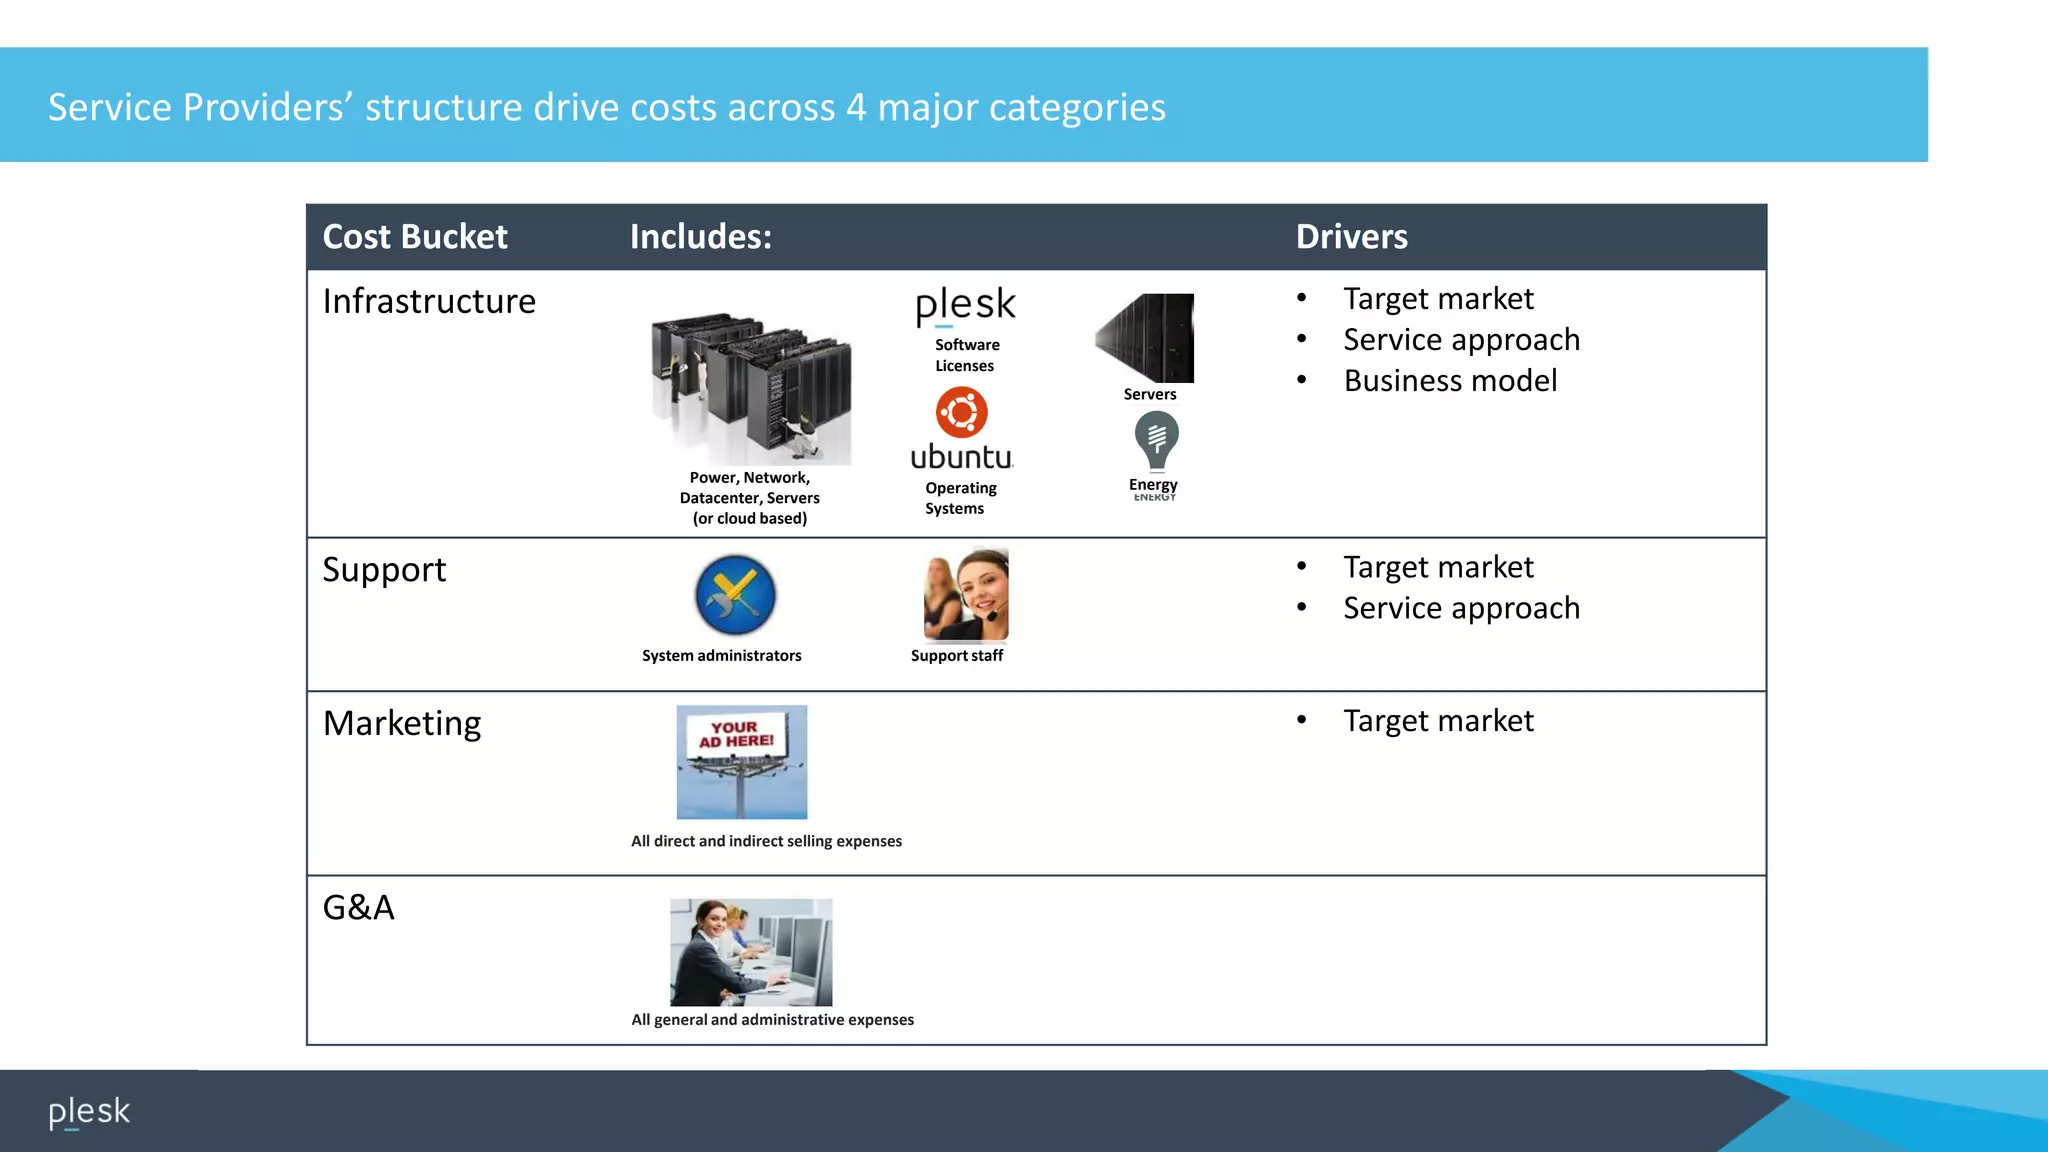
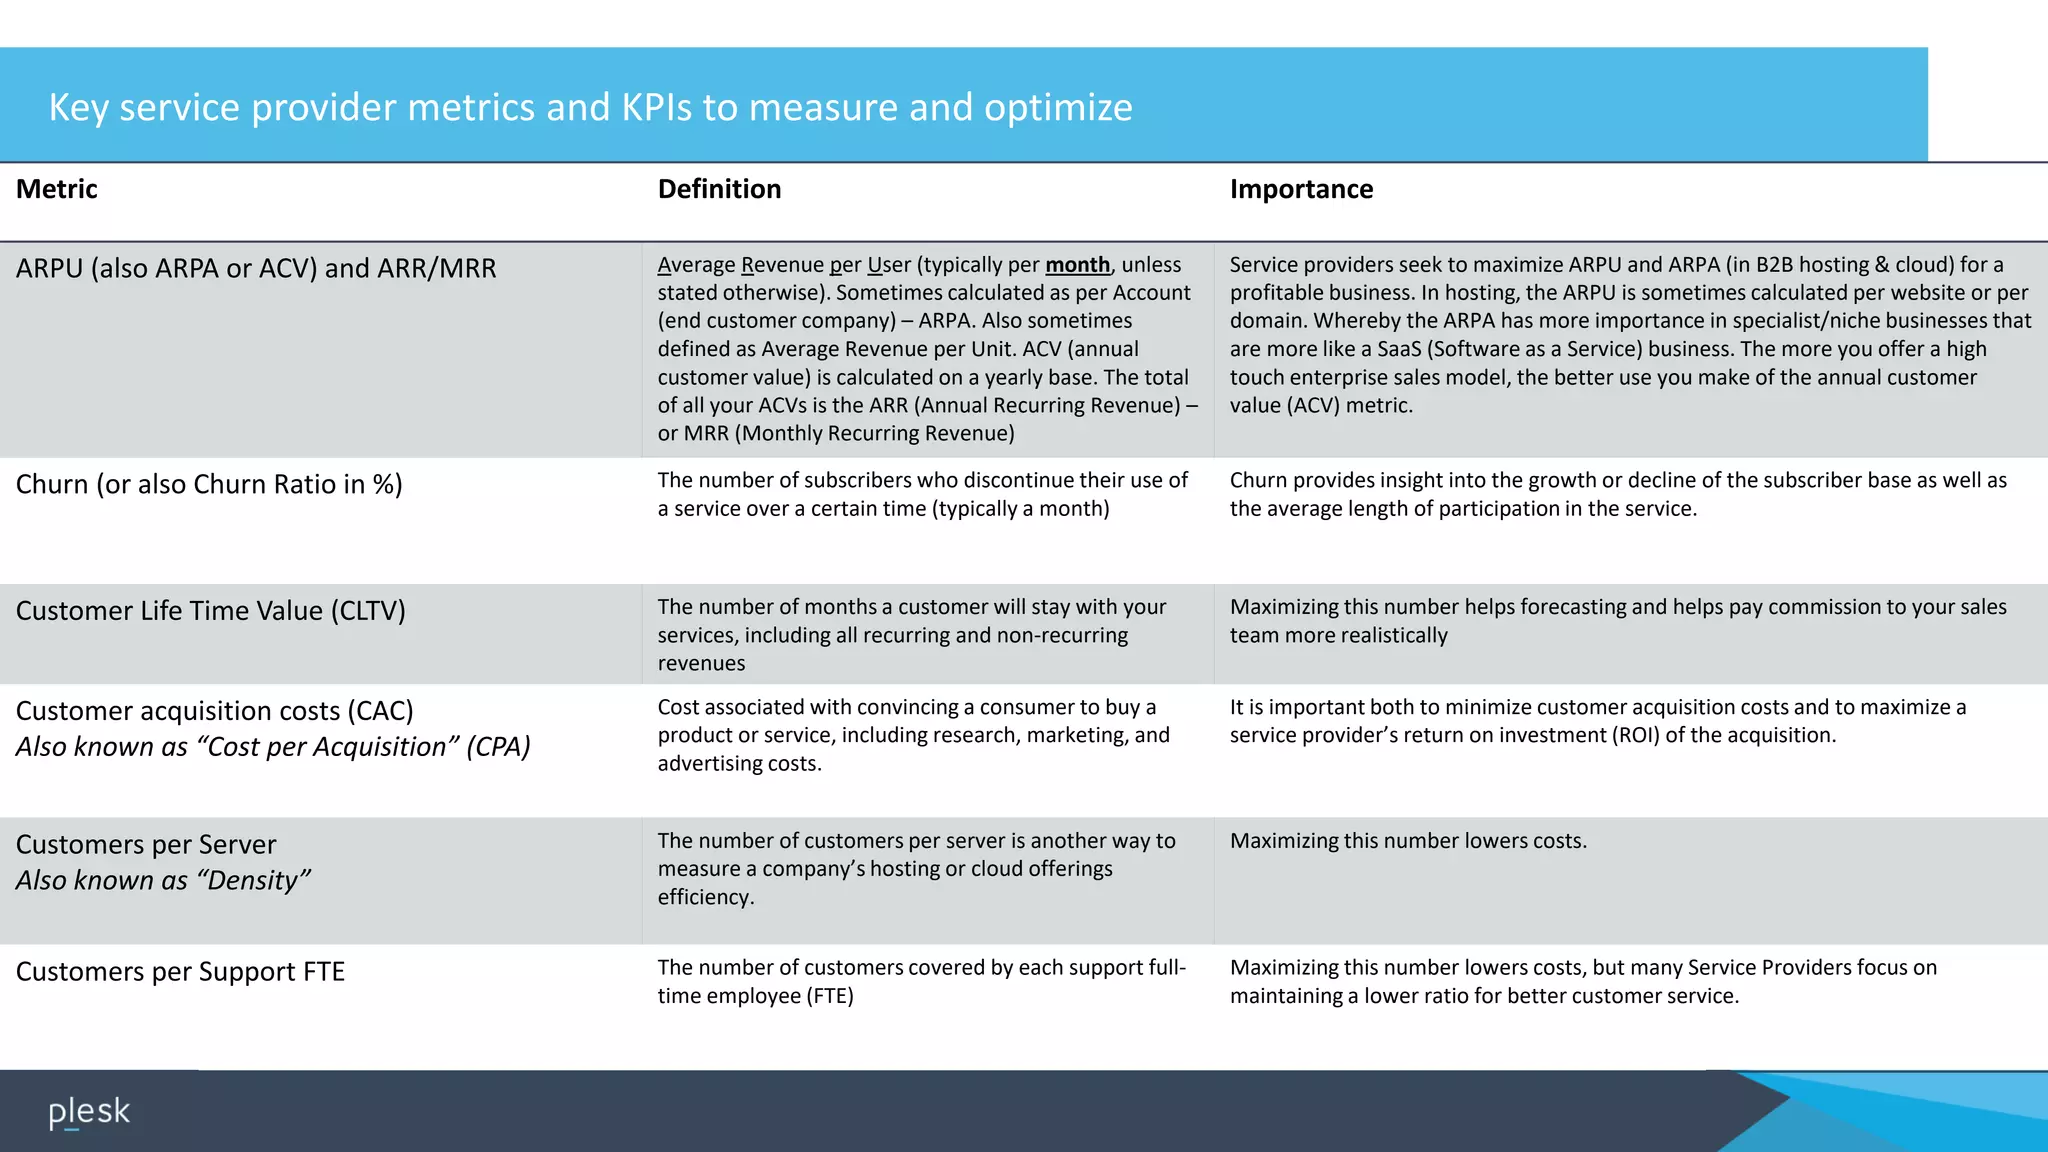
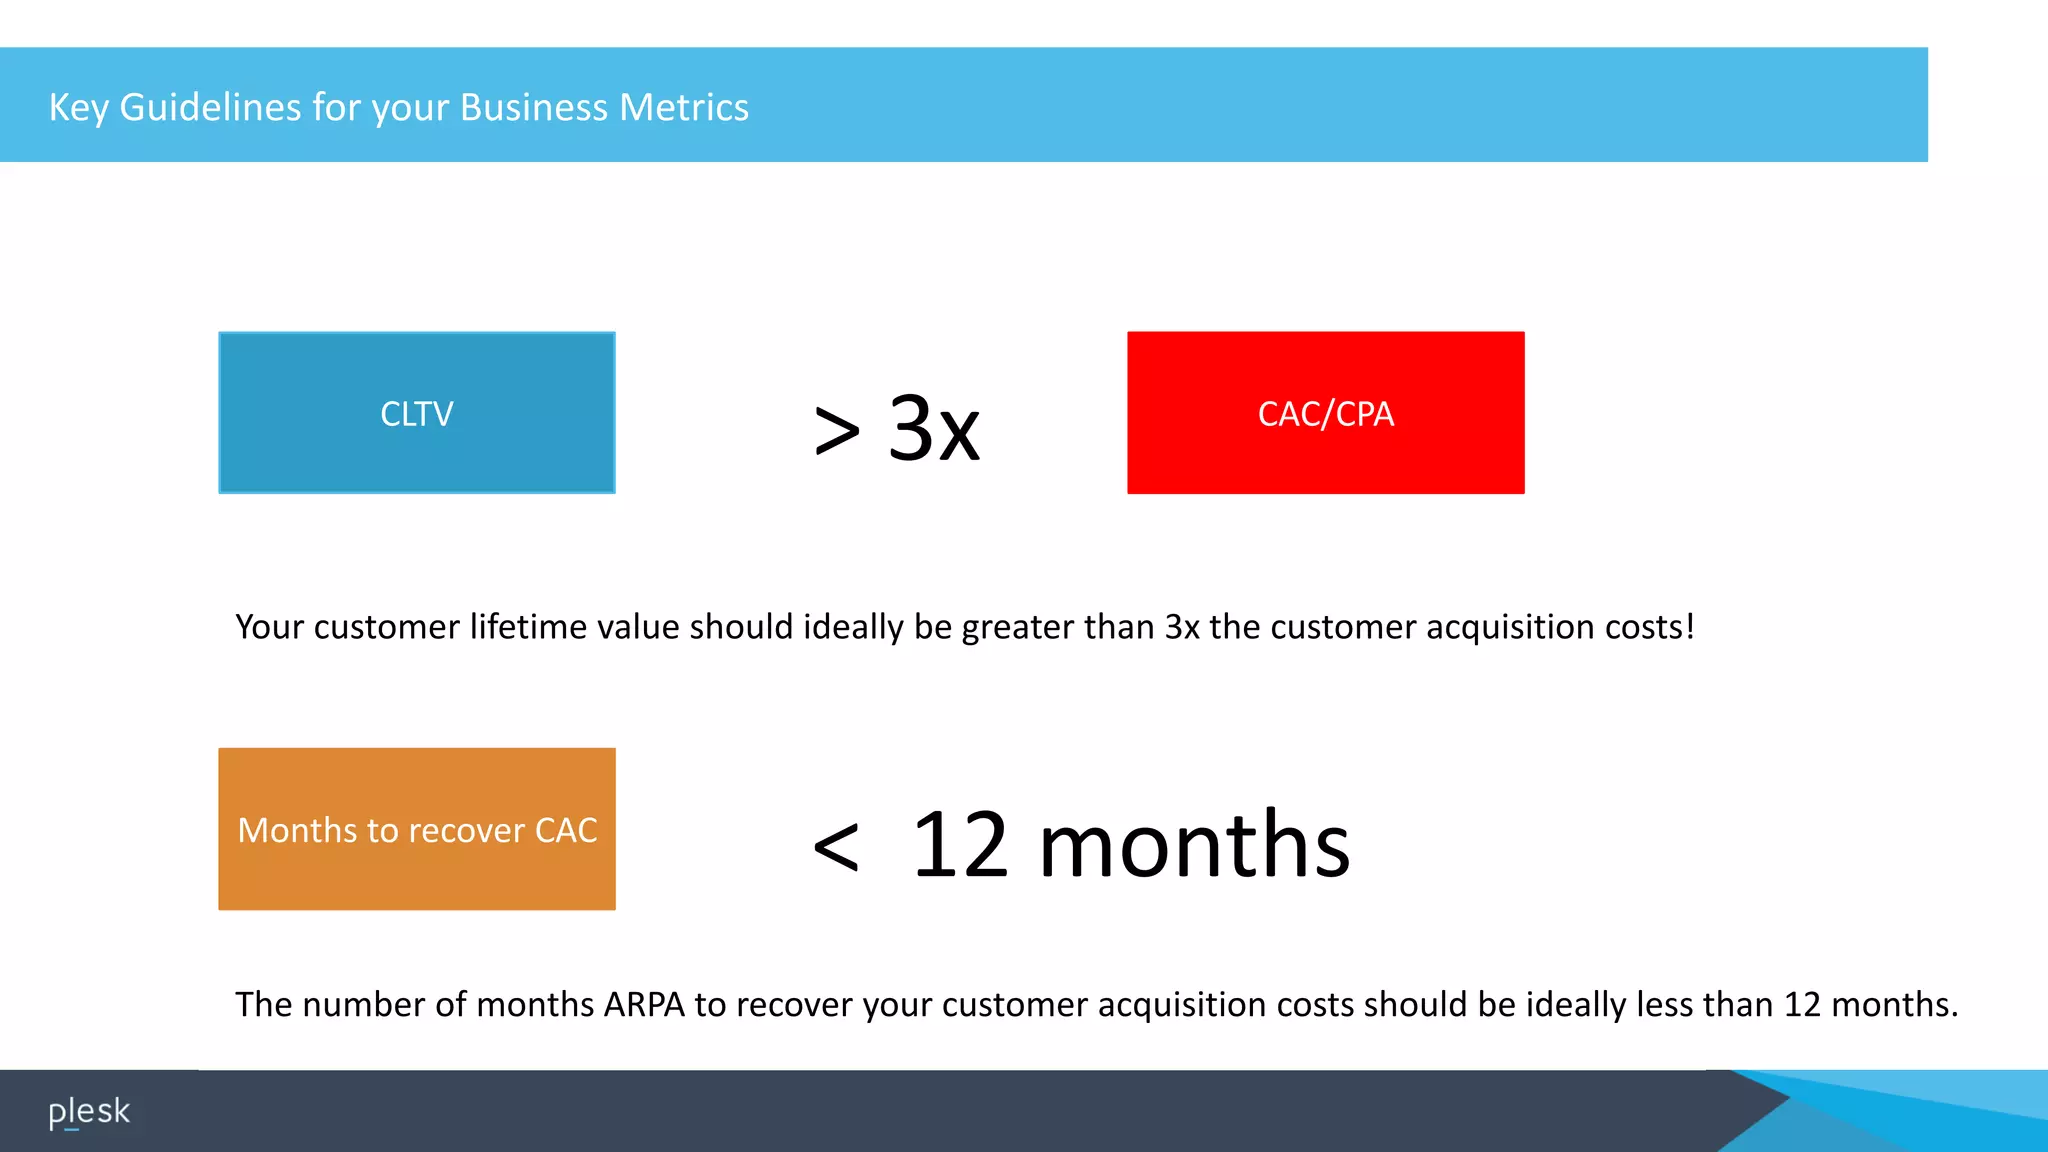
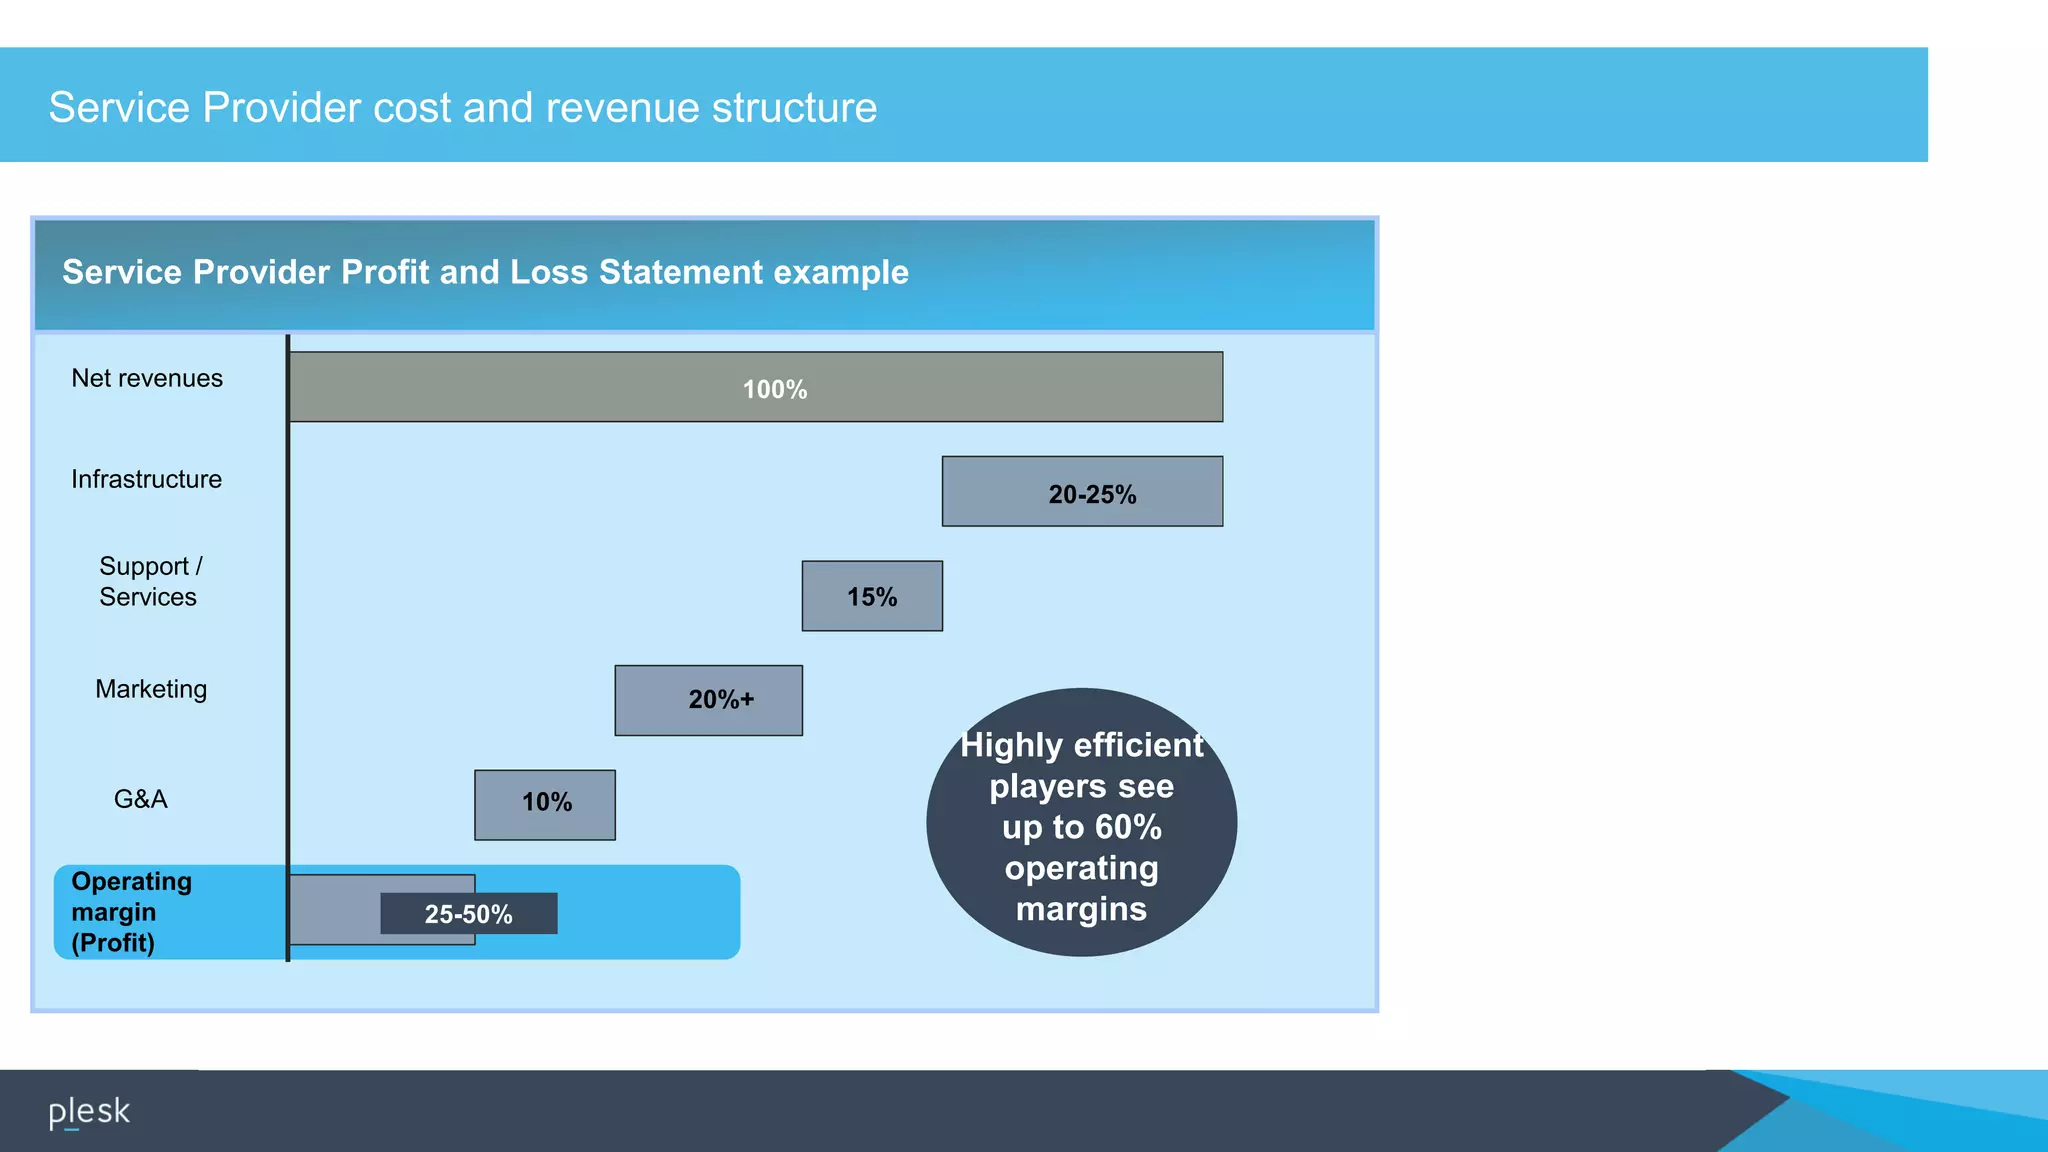
We work through 6 KPIs that every business manager–whether new to the service provider club, a system integrator transitioning into cloud services, or well-established kingpin of hosting–needs to know. These KPIs, if applied and measured correctly, are guaranteed to increase your profits.
2. What are Service Provider costs and revenues?
What metrics can you use to measure Service Provider efficiency?
What are common benchmarks for these Service Provider metrics?
What are typical revenues and cost ranges for Service Providers?
Understanding Hosting, SaaS and Cloud Service Provider Economics
Revenues – Costs = Profits
3. Understanding Service Provider Economics
The 3 keys to economic success in hosted Cloud
services:
1.Acquiring Customers
2.Retaining Customers (reduce churn, increase
stickiness)
3.Monetizing Customers (sell, up/cross sell)
4. Cost Bucket Includes: Drivers
Infrastructure • Target market
• Service approach
• Business model
Support • Target market
• Service approach
Marketing • Target market
G&A
Service Providers’ structure drive costs across 4 major categories
Servers
Operating
Systems
Software
Licenses
Power, Network,
Datacenter, Servers
(or cloud based)
Energy
System administrators Support staff
All general and administrative expenses
All direct and indirect selling expenses
5. Key service provider metrics and KPIs to measure and optimize
Metric Definition Importance
ARPU (also ARPA or ACV) and ARR/MRR Average Revenue per User (typically per month, unless
stated otherwise). Sometimes calculated as per Account
(end customer company) – ARPA. Also sometimes
defined as Average Revenue per Unit. ACV (annual
customer value) is calculated on a yearly base. The total
of all your ACVs is the ARR (Annual Recurring Revenue) –
or MRR (Monthly Recurring Revenue)
Service providers seek to maximize ARPU and ARPA (in B2B hosting & cloud) for a
profitable business. In hosting, the ARPU is sometimes calculated per website or per
domain. Whereby the ARPA has more importance in specialist/niche businesses that
are more like a SaaS (Software as a Service) business. The more you offer a high
touch enterprise sales model, the better use you make of the annual customer
value (ACV) metric.
Churn (or also Churn Ratio in %) The number of subscribers who discontinue their use of
a service over a certain time (typically a month)
Churn provides insight into the growth or decline of the subscriber base as well as
the average length of participation in the service.
Customer Life Time Value (CLTV) The number of months a customer will stay with your
services, including all recurring and non-recurring
revenues
Maximizing this number helps forecasting and helps pay commission to your sales
team more realistically
Customer acquisition costs (CAC)
Also known as “Cost per Acquisition” (CPA)
Cost associated with convincing a consumer to buy a
product or service, including research, marketing, and
advertising costs.
It is important both to minimize customer acquisition costs and to maximize a
service provider’s return on investment (ROI) of the acquisition.
Customers per Server
Also known as “Density”
The number of customers per server is another way to
measure a company’s hosting or cloud offerings
efficiency.
Maximizing this number lowers costs.
Customers per Support FTE The number of customers covered by each support full-
time employee (FTE)
Maximizing this number lowers costs, but many Service Providers focus on
maintaining a lower ratio for better customer service.
6. Key Guidelines for your Business Metrics
CLTV CAC/CPA
> 3x
Months to recover CAC
< 12 months
Your customer lifetime value should ideally be greater than 3x the customer acquisition costs!
The number of months ARPA to recover your customer acquisition costs should be ideally less than 12 months.
7. Operating
margin
(Profit)
Service Provider Profit and Loss Statement example
G&A
Marketing
Support /
Services
Infrastructure
Net revenues
20%+
25-50%
15%
20-25%
100%
10%
Service Provider cost and revenue structure
Highly efficient
players see
up to 60%
operating
margins