
Recommended
Recommended
More Related Content
Similar to NGRI_Project1.pdf
Similar to NGRI_Project1.pdf (20)
Recently uploaded
Recently uploaded (20)
NGRI_Project1.pdf
- 1. 1 1. Introduction Thin section preparation, petrography and basic analytical techniques involved in geochemistry are very essential in geology to understand the rock characteristics and petrogenesis. In this study, petrographic studies are carried out on a set of granitoids, representing the Singhbhum Granite (SG), around Keonjhar area, Singhbhum Craton to understand the mineralogical associations and textural features. Whole rock major elemental data were obtained on the same set of samples, to characterise these granites in terms of their source and nature. In the process, the methodology involved in thin section preparation, sample reduction for the whole rock geochemical analyses, issues on sample contamination, homogeneity etc. are learnt and practiced. In addition, sample preparation for X-ray fluorescence spectrometry (XRF) by pressed pellet method, and the closed digestion sample dissolution method for the Inductively Coupled Plasma Mass spectrometer (ICP-MS) analyses were performed. Quartz, plagioclase and K-feldspar are the major minerals present in these granitoids, with accessory phases like apatite, zircon, biotite, epidote, hornblende etc. The major elemental data was used to plot Alumina Saturation Index (ASI), Total Alkali Silica (TAS), Mg number and Harker diagrams. In the QAPF plot (Streckiesen, 1976), most samples plot in the fields of granites and granodiorites. The alumina saturation index (Shand, 1922) suggest that these rocks are metaluminous, probably derived from an igneous source.
- 2. 2 2. Geological setting: Singhbhum craton, occupying an area of 50,000 sq. km and is bounded to the north by the Singhbhum shear zone (200 km long) and by the Sukinda thrust to the south represents a triangular area bounded between the Eastern Ghats Granulite belt and the Mahanadi Valley Graben in the North. Granitoids and their enclaves represents the oldest component of this craton and are considered as Singhbhum nucleus. The Singhbhum nucleus is surrounded by volcano-sedimentary sequences and supracrustals (Naqvi and Rogers, 1987; Saha, 1994; Weaver, 1990; Bose, 2009). Fig. 2.1- Geologic map of the eastern Indian craton (redrawn from Saha 1994)
- 3. 3 The major components of the singhbhum craton are as follows: Singhbhum granite with enclaves of Older Metamorphic Tonalite Gneiss (OMTG) and Older Metamorphic Group (OMG) of sediments and volcanics. Basins of banded iron formation (BIF) fringing the Singhbhum granite Volcanic basins, loosely termed as greenstone belts. Flysch-like sediments and volcanics of North Singhbhum orogeny. Mafic dyke swarms. Kolhan basin. The OMG represents the oldest supracrustal assemblage of the Singhbhum Craton and comprises pelitic schists, quartz-magnetite-cumingtonite schists, quartzites, banded gneiss, para and ortho amphibolites reflecting the first cycle of mafic volcanism, plutonism and sediment deposition in the Singhbhum Craton. The volcano-sedimentary sequences of Iron Ore Group indicate second cycle of volcanism and sedimentation in the Singhbhum Craton (Saha et al., 1988; Saha, 1994; Misra, 2006; Mukhopadhyay et al., 2012; Mondal, 2009). The volcano-sedimentary sequences of Simlipal basin are coeval with the third cycle of magmatism and sedimentation of Singhbhum Craton. The Proterozoic north Singhbhum mobile belt got accreted along the northern margin of the Singhbhum platform (Bose, 2009). The Dalma and Dhanjori basins of the Proterozoic north Singhbhum mobile belt are distinctly marked by bimodal komatiite-tholeiite magmatism and sedimentary rocks. The 2.25 Ga eruption of Jagannathpur and Malangtoli lavas post-dates the IOG mafic volcanism and are overlain by Kolhan Group of sediments which are followed by the emplacement of Soda Granite (2.22 Ga) and Kuilapal Granite (1.64 Ga) ( Saha, 1994; Saha et al., 1988; Bose, 2000; Misra, 2006). These granitoid intrusions, copper mineralization (1.77–1.63 Ga) and associated shear zone activities along south Singhbhum shear zone (SSZ) were punctuated by different phases of intrusion of Newer Dolerite dyke with uranium mineralization along SSZ dated at 1.58–1.48 Ga (Mohanty, 2012; Roy and Sarkar, 2006; Mazumder et al., 2010; Roy et al., 2002; Sarkar et al., 1986; Iyengar and Murthy, 1982; Sengupta et al., 1984). The intrusion of Newer Dolerite dyke phase III marked the final magmatic episode in the geological history of Singhbhum Craton (Misra and Johnson, 2005).The oval shaped Singhbhum granite is known to have emplaced in 3 phases (phase 1, 2 &3). The phase 1 and 2 are geochemically distinguished as Type A and they had formed around 3300-3400 Ma. Phase 3 granites had formed around 3100 Ma. Broadly, Singhbhum granite belongs to granodorite-adamellite-granite (GAG) suite containing 300-
- 4. 4 3400 Ma old enclaves of OMG and OMTG. Nilgiri granites in the east, Chakradharpur granite in the north and Bonai granite in the west are correlatives of Singhbhum granite. In this work, samples collected from Keonjhar region of Bastar was studied using thin section and to understand their geochemistry, chemical composition was estimated by XRF spectrometry. Methodology 3.1. Thin Section Preparation: Samples collected during the fieldwork were prepared for the thin section (~0.03mm) to study petrological studies. This discussion will deal with the preparation of polished thin section of rocks. The rock sample is fixed in the slabbing saw holder to cut the sample into a chip size, the required thickness of the sample is of about 40mm. while cutting the sample the diamond coated rock cutting blade should be frequently poured with water so that the disc doesn’t get hot. Rectangular Slab making: Finding the best portion from the previously cut slab, the sample is now required to cut into a rectangular size slab with the help of a special rock-cutting blade which is made of metal with diamonds embedded on it, Then the rectangular slab is washed in water or soaped and then dried for 2 to 3 hours. Grinding: Grind the sample on a flat surface using diamond abrasive. Before starting the wheel, use billet to spread water around it so that it makes the wheel wet. The rectangular slab is required to go through the process of grinding so that it can achieve standard slide size (i.e. 45*26mm). Then the sample is required to mark again. The last phase of grinding or lapping is done on the surface of a glass plate. This lapping is done with the help of carborandam powder, it is an abrasive used to even the surface of the sample. The technique of lapping the sample on the glass plate with appropriate abrasive is an important process because this will the sample to stick on the slide (that will be discussed below). The 1st lapping is done with 400 micron powder then the 2nd lapping is done with 600 micron powder. After the completing the process of making slab the sample is required to heat in the sunlight so that it could evaporate the water content present in it(before mounting) 4 to 5 hours.
- 5. 5 Mounting: The glass slide is required to frost or grind so that it acquires the flat or rough surface, this will help the epoxy to bind well along with sample and the slide. Then write the sample number with diamond coated pen-nib on the frosted side of the slide so that the number gets covered by the epoxy shortly. Ensure the sample is dried enough prior to actual mounting. Prepare an epoxy, by mixing resin and hardener in 3:1 ratio. Apply the epoxy on the frosted side of the slide. Move the slide above the sample while pressing it gently with a finger or an eraser. This will squeeze out the extra epoxy and by this process a constant thickness can be achieved, and if the work is done in this way most of the air-bubbles can be removed effectively. While doing this, be sure that the sample number gets coated with epoxy. After fixing it on the glass-slide, the respected samples are required to press by a pressing machine. The pressing should be done up to 12-14 hours. After completing the process of pressing the sample is required to heat in the sunlight again for 3 to 4 hours to in order to evaporate the additional water present in it. Figure3.1.1: (a) Rock prior to cutting (b) Rock ready for first cut. (c) Grinding the chip will remove any saw marks from the cutting. (d) Moving slide around to expel bubbles and extra epoxy.
- 6. 6 Grinding and Polishing: After completing the process of pressing, the mounted sample of 40mm thickness is required to cut into a thickness of 25 mm chip by using the PetroThin® saw. After achieving this thickness the sample requires to go through the process of grinding to achieve the required thin section thickness i.e.0.5 mm. While using a PetroThin® saw, a vacuum chuck is recommended for securing the glass slides. Then use the (400 to 600) mesh of carborandam powder for lapping to check the final thickness. After lapping, the thickness of the sample is checked by using petrographic microscope; then the final diamond polishing is done to sum up the process of grinding and the polishing; for a petrographic thin section, thickness of the sample should be 30µm. Figure3.1.2: (e) Pressing the samples. (f) Slide with chip mounted in cut-off saw. (g) Lapping on the glass. (h) Slightly-thick quartz in a thin section.
- 7. 7 3.2. Sample reduction: A good sample preparation is essential for better results and to minimize analysis errors of target elements. XRF can take almost any type of samples such as solids, powders, briquettes, fusion products, liquids, supported specimens. Specimen or Sample preparation is generally not required for qualitative analysis. Rock sample is a heterogeneous mixture of different minerals present and it is necessary to make the sample homogeneous to get accurate analytical data as it is essential that the surface layer should be representative of the bulk specimen. A small amount of the sample is analyzed, which should represent the entire material. Mostly samples are to be-prepared in powder form and effectively homogenized. Sample surface should be smooth and flat. Irregular sample surfaces change the distance from the sample to the X-ray source and introduce error. All XRF systems are calibrated based on a fixed sample to source distance. Changing the distance can increase or decrease the intensity coming from any element contained in the sample. For chemical analyses of rocks, first sample undergoes a series of steps to reduce the size. 1. Chipping: First of all the sample have to be reduced in the size, for this we chip the samples with the help of hammer. (Note: Keep the area clean and wear a mask to protect your eyes) 2. Jaw Crushing: Jaw crusher are normally used to reduce the size of samples having pieces in the size range of 20-200mm. The crushing plates are made of cast steel, manganese steel or tungsten carbide and may have vertical ribs to provide adhesion and initiate crushing. They must be adjusted periodically to compensate for wear. Possible sources of error during crushing include loss of volatile elements, dust loss, cross- contamination due to inadequate cleaning of equipment between samples. 3. Ring Grinder: Rock samples are finely powdered to better than –250 mesh size with the help of jaw crusher and Pulverizer. Stainless steel equipment’s were used and to avoid the contamination; first we used silica powder and grind it. Then after rinsing; we proceed for the final powdering of the sample. After every processing the instrument was cleaned-with air blower, tissue paper and acetone to further avoid any chance of contamination.
- 8. 8 (A)XRF Pellets: Two types of pellets are prepared for WD-XRF analysis: (i) Fused glass bead (ii) Pressed pellet at 10 – 35 tons of pressure; but we have done Pressed Pellets. i. Fused glass bead: Fused discs are generally preferred for major element analysis of rock samples to minimize the particle size effect and sample inhomogeneity. It was shown that when the sample diluted sufficiently with flux (1:100), the matrix effects become constant and there is a simple linear relationship between intensity and concentration. One of the major problem with such high- Figure 3.2.1- : Sample processing steps for geochemical analysis: (a-b) Jaw crusher, obtained size of the rock fragments varies from 35-10mm. (c-d) Ring grinder to powder the sample 200-250µm.
- 9. 9 dilution, however, is that the estimation of low concentration elements like Ti, Mn, P, and S becomes difficult as the concentration of these elements falls to below the detection limits. ii. Pressed Pellets: As the flux dilutes the rock sample, some of the trace elements reach below the detection limits. For example in the granite rock sample, normally the nickel and chromium concentration is only around 10 ppm. These sample after fusion and dilution have to be determined as 2 ppm only if the sample to flux ratio is kept at 1:4. Therefore, it is advisable to prepare the pressed pellets for the estimation of trace elements in the rock sample. Pressed pellets are prepared by using collapsible aluminum cups (Govil 1985). Sample is grinded and powdered into 200 mesh size approximately. Then take an aluminum cup and fill it with boric acid crystals and make the surface flat by removing the excess boric acid crystals using a paper. Spread the powdered sample above it uniformly using a clean paper and make it into infinite thickness. Press the sample using a hydraulic press machine at a pressure of between 10 and 35T. (A)ICP-MS Sample Preparation: Close Vessel Digestion: Samples will be dissolved in vials which must be cleaned to minimize sample contamination. Then carefully take HNO3 and MQ water (1:3) and place the vials on hotplate for 1400 C 24hours. After 24hours, carefully remove the vials from hotplate and allow them to cool for 30minutes. Then rinse the vials thoroughly with MQ water. Weigh appx. 50mg of the sample and put in vials and add HF and HNO3 in 7:3 ratio. Figure 3.2.2 – Pressed Pellets Note: (While preparing pellets, care should be taken to avoid contamination to the sample. Don’t use the same paper again in order to spread the powdered sample. Use clean paper and cups and take fresh boric acid crystals for filling the cups).
- 10. 10 Now samples are ready for digestion. Keep the samples on a hotplate at 1600 C for 48hours. Next add 1 or 2 drops Perchloric acid (HClO4) into the vails and keep it hotplate at 80o C till the sample turns into a semi-solid form. Now add 20 ml of 1:1 HNO3: Millipore water into the vails and add 5ml of Rhodium (Rh) of 1 ppm concentration as an internal standard. Now pour this solution into conical flask and make up the volume to 250ml. Before using conical flask, make sure to wash it once with 1:1 HNO3: Millipore water and twice with Millipore water. Pour the samples into 30 ml HDPE bottles and later dilute the sample in 1:9 ratio by adding Millipore water. 3.3. LOI (Loss on ignition): Loss on ignition is the weight loss that occurs when the powdered sample is heated to about 800º C, at which point all of the remaining volatiles, including structural volatiles (H2O, CO2, etc.), are released. So in this experiment, we normally measure the amount of volatiles in our sample. Commonly the volatiles are CO2 (e.g. carbonate rocks, organic materials) and H2O (mica, amphiboles, clay minerals). Therefore, depending on the type of rock that you are going to analyze (mineralogical- composition), the temperature of ignition is variable. If your sample is Granitic rocks, you have to heat the sample at about 650o C for 45minutes. Equipment: Ceramic Crucible Desiccator Muffle furnace Weighing instrument Safe Gloves (a) (b) Figure 3.3.1-(a) Crucible has been cleaned with distilled water and then acetone. (b) Desiccators.
- 11. 11 Procedure: 1. Before Ignition: First the crucible has to be washed in Millipore water and later with acetone (C3H6O). Then take 1.0gm of powder sample by using weighing instrument. For LOI, we will place the samples in a silica crucibles. Then ignite it at 6500 C for about one hour in a muffle furnace by using protecting hand-gloves. 2. After Ignition: Then after place in a desiccator, allow to cool. Wait 30minute then remove the samples from the desiccator and weigh the samples for their post-ignition weight. Calculate %LOI using the following equation: 3.4.Geochemical Analysis: The major and trace elements analyses of the samples using powder of 200µm were studied using the XRF spectrometer which is a Wavelength dispersive type (WD-XRF, Epsilon-5; PANalytical B.V. Lelyweg, The Netherland). XRF is an analytical method to determine the chemical composition of all kinds of materials. The materials can be in solid, liquid, powder, filtered or other form. It can also sometimes be used to determine the thickness and composition of layers and coatings. The method is fast, accurate and non-destructive, and usually requires only a minimum of sample preparation. Applications are very broad and include the metal, cement, oil, polymer, plastic and food industries, along with mining, mineralogy and geology, and environmental analysis of water and waste materials. The x-ray spectrometry is chiefly classified into two types: (a) Wavelength – Dispersive x-ray spectrometry: X-ray spectral lines of all elements in the sample are excited simultaneously, then separated on the basis of their wavelengths prior to detection. LOI(%) = S2/S1*100 Where, S2= Loss of ignition (W1-W2) S1= Sample weight W1= Weight of Crucible + Sample weight (After ignition) W2= Weight of Crucible + Sample weight (Before ignition)
- 12. 12 (b) Energy – Dispersive x-ray spectrometry: X-ray spectral lines of all elements in the sample are excited and detected simultaneously, then the resulting detector output pulses are separated electronically on the basis of their pulse heights and thereby on the basis of the photon energy of the x-rays from which they originated. Principle of XRF Spectrometry: X-rays are electromagnetic radiations having a wavelength range of 10-5 A to 100 A. Practical XRF spectrometry deals with the specific region of 0.1 A to 20 A. Fluorescence is a phenomena similar to luminescence. When an atom is excited by removing an electron from the inner K shell, an electron is transferred from outer shell to K shell. The difference in the energy of the two shells is emitted as x-ray photon. These x-rays, emitted from an excited element, have the wavelength characteristic of that particular element and its intensity is- directly proportional to the number of excited atoms or the concentration of that element present in the rock sample. Figure 3.4.1-Production of characteristic radiation
- 13. 13 XRF spectrometry is a group of non-destructive instrumental method of qualitative and quantitative chemical analysis based on the measurement of the wavelength and intensity of their x-ray spectral lines emitted by secondary excitation. In wavelength Dispersive x-ray fluorescence spectrometry, x-ray spectral lines of all the elements in the samples are excited simultaneously and then separated on the basis of their wavelengths prior to detection. WDXRF spectrometry is the most widely used system for the analysis of geological samples. For WDXRF, the detection system is a set of collimators, a diffraction crystal and a detector. The X-rays coming from the sample fall on the crystal, and the crystal diffracts (reflects) the X-rays with different wavelengths in different direction. This is equivalent to a prism that separates white light into all the different colors. By placing the detector at a certain angle, the intensity of X-rays with a certain wavelength can be measured. It is also possible to mount the detector on a goniometer and move it through an angular range to the intensities of many different wavelength. Figure 3.4.2- Schematic description of WD-XRF principle
- 14. 14 The basic sequence of an x-ray spectrometric analysis is as follows: (a) The X-ray tube produces the x-ray primary beam. (b) The primary x-ray beam irradiates the sample and excites each element to emit its characteristic x-ray spectrum. The wavelength of the emitted spectral line is characteristic of the emitting element (basis of qualitative analysis). The intensity of each line is related to the Concentration of the emitting element (basis of qualitative analysis). (c) The collimator renders the secondary x-rays from the sample parallel. (d) The analyzer crystal specially disperses the secondary x-rays, causing each analyze line to go in a different direction. As per Bragg's law it works as a monochromators. As per Bragg's law the equation is- At one angle of the crystal only one wavelength will be diffracted. e.g. at 45.2 2 only C (e) The detector receives each wavelength diffracted by the crystal and for each x-ray photon absorbed produces an output pulse of electric current having an amplitude proportional to the incident x-ray photon energy. (f) The pre amplifier and amplifier amplify these pulses linearly i.e. without changing their relative amplitudes. (g) The pulse height selector passes all pulses having a preset range of amplitudes. (h) Scaler counts these pulses digitally and timer measure the counting time. n = 2d sin (where = wavelength, n= order of diffraction) d= inter planar spacing of the crystal = angle of diffraction
- 15. 15 4. Petrography and Geochemistry The samples in general exhibited holocrystalline, inequigranular and porphyritic textures composed mainly of coarse to medium grained quartz, alkali feldspar and plagioclase. Accessory minerals that were observed includes biotite, zircon, apatite, titanite, epidote, hornblende and opaque phases. Quartz phenocrysts were almost anhedral showing undulate extinction with first order grey interference. Feldspar crystals were euhedral to subhedral in shape and were identified based on their distinct twining i.e. orthoclase with Carlsbad twinning, microcline with tartan twinning and plagioclase with lamellar twinning. Plagioclase, K- feldspar and epidote showed zoning. Biotite grains observed were subhedral in shape with tabular form, exhibited pleochroism and parallel extinction. Myrmekitic texture was present i.e. inter growth of quartz and plagioclase feldspars formed due to production of the excess quartz by the replacement of alkali feldspar by plagioclase feldspar. Perthitic texture was seen and are formed due to the inter growth of sodic and potassic feldspar resulting in lamellae of sodic feldspar within potassic feldspar. Perthitic textures are considered as an indicator of slow cooling which resulted in exsolution of alkali feldspars. Figure4.1- Photomicrograph showing (a) Quartz showing Undulatrory extinction Biotite and Plagioclase are present (b) K-feldspar showing Carlsbed and Albite twinning. (c) Plagioclase altered by Sercite (white Mica) (d) Plagioclase and K-felspar are highly altered and Sericitised. (a) (b) (c) (d)
- 16. 16 (a) (b) (c) (d) Figure 4.2 - Photomicrographs showing (a) zoned plagioclase and k-feldspar (b) Pethitic texture and Biotite altered to chlorite (c) euhedral plagioclase phenocryst with a zoned rim. (d) Epidote in plagioclase and chloritised biotite. Figure 4.3- Photomicrograph showing (a) Epidote, microcline, plagioclase and biotite getting altered to chlorite. (b) Perthitic and Polikitic texture with large feldspar grain containing small grains of titanite and epidote. (c) Granitic gneiss showing (Gneissosity is seen where the layering of equant crystal (e.g. quartz and plagioclase) alternate with platy or elongate biotite minerals layers). (d) Carlsbed twining in Orthoclase and wispy perthitic exsolution.
- 17. 17 Sericitization is a common type of hydrothermal alteration that occurs in felsic rocks and was observed in few thin sections. Sericite is a white colored mica that is formed by alteration of feldspar. Epidote, one of the common accessory mineral observed in the current study is a product of Saussuritization, a process in which plagioclase feldspar is altered to a characteristic assemblage of minerals called saussurite; the typical assemblage formed includes epidote. Figure4.4-Photomicrograph showing (a,b) major minerals K-feldspar and Quartz. (c)rhombohedral titanite (sphene) surrounded by plagioclase, quartz.(d) Zircon showing high interfernce colour. Zr (a) (b) (c) (c)
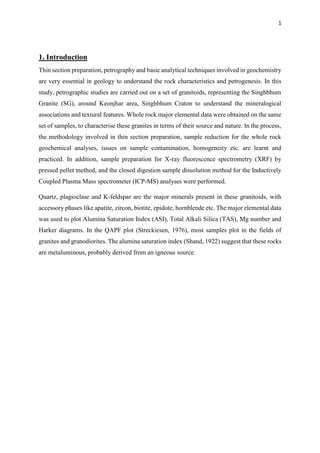
- 18. 18 Geochemistry Fig. 4.5 Total Alkali Silica and QAP diagram Fig 4.6 Alumina Saturation Index diagram
- 19. 19 Figure 4.7 Harker type variation diagram of the samples collected showing the variability of various oxides w.r.t. their respective SiO2.
- 20. 20 The studied granitoids are having SiO2 contents in tight range of 69.88 to 73.84 wt.% except for one sample with low SiO2 value of 60 wt.%. In the Total Alkali Silica (TAS) plot most of the samples exhibit granitic character, barring one sample of dioritic affinity. The major elements doesn’t show any differentiation trend against Silica. The Al2O3 compositions ranged between 9.68 and 11.96 wt.%. The alumina saturation index (Shand,1943) is <1 with all samples falling into metaluminous region, and 2 samples among them are peralkaline, suggesting the igneous origin for these rocks. The CaO values varied from 0.66 to 8.39 wt.%. In the QAP diagram, the distribution of samples ranges from granite to granodiorite (Streckiesen, 1976). The Na2O values are in the range between 3.26 and 4.53 wt.%, while the corresponding K2O values varied from 1.47 to 6.99 wt.%. Based on K2O/Na2O ratios are variable, suggesting that there are 2 types of granites, sodic and potassic with the cut-off being at 1. This observation is further confirmed by the variations in the abundance of plagioclase and other mineralogical associations. The Mg# vs Silica plot shows higher Mg# (>50) for some samples. High Mg# in Archean granitoids is attributed to peridotite assimilation (Rapp XXXX) with distinct petrogenetic history when compared to regular crustal derived granitic melts. However, such observations need to be confirmed with trace elemental systematics and other data sets. Conclusions The Total Alkaline Silica (TAS) indicate that studied granitoid samples are of 2 types, granites and diorite. Compositionally there are two different types of granites, Sodic and Potassic and are confirmed by mineralogical abundances of feldspars. Presence of hornblende and the metaluminous character of the granitoids possibly reflect their igneous source. There was no major differentiation trend in the major elements and the silica content was restricted to a tight range of 69 to 73 wt % except for the diorite with 60 wt %. Mg# vs. Silica suggests the possibility of peridotite assimilation and needs to be confirmed by trace element analysis.
- 21. 21 REFERENCES 1. Anzelmo John, Seyfarth Alexander, Arias Larry, 2001, Approaching a universal sample, Preparation method for XRF analysis of powder materials, Advances in X-ray analysis, v.44, p.369-372. 2. Chappell, B.W., and White, A.J.R., 1974, Two contrasting granite types, Pacific Geology, v. 8, p. 173–174. 3. Streckiensen, 1976, To each plutonic rock it’s proper name, Earth Science reviews, v 12, p. 1-33. 4. Shand SJ. The problem of alkaline rocks, Proceedings of the GeologicalSociety of South Africa, 1922, v.25, p 19-33. 5. Martin, H., Smithies, R., Rapp, R., Moyen, J., Champion, D., 2005. An overview of adakite, tonalite-trondhjemite-granodiorite (TTG), and sanukitoid: relationships and some implications for crustal evolution. Lithos 79, 1-24. 6. The structural and geochemical evolution of the Singhbhum granite batholithic complex, India by A.K Saha, S.L Ray,1984, Tectonophysics,v.105, p.163-176. 7. A.K Saha, 1979, Geochemistry of Archean Granites of the Indian Shield: A review, Geological Society of India, Vol 20, p. 375-392. 8. John D. Winter, 2nd (ed.). (2013); Principles of Igneous and Metamorphic Petrology. p. 378-395. 9. Dewasis Upadhyay, Sabyasachi Chattopadhyay, Ellen Kooijman, Kalus Mezger, Jasperr Berndt, 2014, Magmatic and metamorphic history of Paleoarchean tonalite- trondhjemite-granodiorite (TTG) suite from the Singhbhum craton, eastern India, Precambrian Research v.252 180–190 10. M. Ramakrishnan and R. Vaidyannadhan, Geology of India. v.1. p.210-248 (2008). 11. Grover C. Moreland, 1968, Preparation of polished thin sections, The American Mineralogist v.53. p. 2070-2074. 12. Heiri, O., Lotter, A., & Lemcke, G.(2001), LacCore, National Lacustrine Core Facility, Loss-on-ignition standard operating procedure. p.1-6. 13. Thin section preparation, Logitech Machine System’s Technology Manual for Thin Rock Section Production, p.20, (1989). 14. The Netherlands under the title “Theory of XRF” Copyright © 2003 by PANalytical BV, The Netherlands, 3rd (ed.), 2010. 15. Rajat Mazumder & Wlady Altermann, A brief overview of Palaeoproterozoic Geology of the Singhbhum Crustal province, Eastern India, UNESCO IGCP 509. 16. Robin Gill, © 2010: Igneous Rocks and Processes a Practical Guide. P.241-288. 17. Dexter Perkins, Minerals in thin section, second edition, 2007, p. 121-139. 18. A.K Saha (1994); Crustal evolution of Singhbhum-North Orissa Eastern India. p. 99- 123. 19. Chris Riddle Analysis of Geological Materials. p.65-75