1. Team 5: Fiona Nguyen Delta Airlines
Tyler Britton JetBlue Airlines
Paul Shimshak Southwest Airlines
Clare Blessinton United Continental Airlines
Course: FIN 3010-02
Professor: Dr. Premalata Sundaram
Fall 2015
Number of
firms Current PE Trailing PE Forward PE
Aggregate
Mkt Cap/
Net Income
Aggregate
Mkt Cap/
Trailing Net
Income
Expected
growth -
next 5
years PEG Ratio
22 47.14 28.11 14.42 14.65 10.90 34.73% 0.31
63.06 14.33 9.10 39.15B 9.60% 0.45 as of 12/02/2015
#REF! #REF! #REF! #REF! #REF! #REF! Please fill in your airlines matching values here
30.13 18.18 12.14 32.13B 21.54% 0.48
3.51 3.37 7.18 21.74B 25.00% 0.24
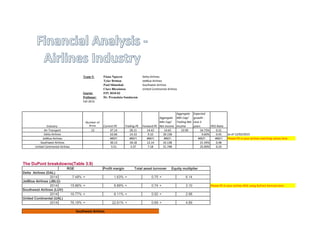
The DuPont breakdowns(Table 3.9)
ROE Profit margin Total asset turnover Equity multiplier
Delta Airlines (DAL)
2014 7.48% = 1.63% × 0.75 × 6.14
2014 15.86% = 6.89% × 0.74 × 3.10 Please fill in your airlines ROE using DuPont formula here
2014 16.77% = 6.11% × 0.92 × 2.98
2014 76.18% = 22.61% × 0.69 × 4.89
United Continental Airlines
Industry
Air Transport
Delta Airlines
JetBlue Airlines
Southwest Airlines
Southwest Airlines
JetBlue Airlines (JBLU)
Southwest Airlines (LUV)
United Continental (UAL)
2. JBLU LUV DAL
I. ST solvency, or liquidity, ratios (don’t study last two)
Current Ratio 0.62 0.74 0.74 0.75
Quick Ratio 0.60 0.686 0.69 0.70
Cash Ratio 0.18 0.216 0.12 0.25
II. LT solvency or finanical leverage, ratios
Finanical Analysist or investor will look at this ratio
Total Debt Ratio 0.68 0.665 0.84 0.80
D/E ratio 2.10 1.982 5.14 3.89
Equity multiplier 3.10 2.982 6.14 4.89
LT Debt Ratio 0.27 -0.561 0.76 0.54
TIE ratio -3.41 17.115 2.65 -8.11
Cash coverage ratio -4.85 24.331 5.37 -10.77
III. Asset Management, or turnover, ratios
Inv. Turnover 109.78 26.96
Days' sales in Inv. 3.32 13.54
Receivable turnover 42.77 50.973 17.57 19.05
Days' sales in Receivables 8.53 7.161 20.77 19.16
Fixed asset turnover 0.96 1.302 1.84 1.05
Total Asset turnover 0.74 0.921 0.75 0.69
IV. Profitablity ratios:
Profit margin 6.89% 6.11% 1.63% 22.61%
ROA 5.12% 5.62% 1.22% 15.57%
ROE 15.86% 16.77% 7.48% 76.18%
ROE 15.86% 16.77% 7.48% 76.18%
V. Market value ratios
PE ratio 14.9 18.228 4.3 $3.51
PEG ratio 0.10 24.117 1.57 $4.35
Price-Sales Ratio 1.100 1.717 1.1 $0.60
Price-Book Ratio 3.3 4.61 3.3 2.57
UAL (2015 data)
Financial Ratios 2014
3. Industry Number of firms Current PE Trailing PE Forward PE
Aggregate
Mkt Cap/ Net
Income
Aggregate
Mkt Cap/
Trailing Net
Income
Expected
growth -
next 5
years PEG Ratio
Air Transport 22 47.14 28.11 14.42 14.65 10.90 34.73% 0.31
Delta Airlines 63.06 14.33 9.10 39.15B 9.60% 0.45 as of 12/02/2015
Key Financial Ratios and Statistics FYE: 12/31/2014 Number of shares
Year Sales Net Income EPS Date
12-mos
Rolling EPS Dividend P/E Ratio
Dec-14 40,362.00 659 0.78 Dec-14 0.78 NA 63.06 18.01
Growth Rates 6.18 2.67 2.74 Sep-14 11.5 0.09 3.14
Jun-14 12.67 0.09 3.06
Mar-14 12.53 0.06 2.77
1. What is the business model for your company, what is makes and sells, what industry, etc.? What are the inherent risks in the industry segment it is operating in? What is the nature of governance for your company? Who are the Board of Directors, what do senior management get compensated and how, etc.
Business Model: - Delta Airlines is an airline business model in air transportation industry. They provide scheduled air transportation for passengers and cargo throughout the United States and around the world. Their global route network gives them a presence in every major domestics and international market.
Inherent Risks: - The inherent risks of airlines industry include the following:
a) A capital intensive industry with high fixed costs compared to revenues: the airline industry is considered among the top of this category with high risks.
b) Low profitablity: in case the airline is not able to attain an economy of scale or if there is a downturn in sales, the high fixed cost cannot be covered and the business becomes unprofitable.
c) High vulnerablity to the state of the economy: in case of global slowdown, recession, nature disaster, terror threats, fuel costs,etc. the company can face severe liquidity crisis.
d)High barrier to entry and regulations in the markets: airlines are highly regulated due to political, economic, and safety concerns. However, in deregulated markets, entry barriers are low, thus, increasing the competition and promotes more players to enter the market.
e) Low switching costs for customers: it is very hard for airlines to develop a loyal customer base. Thus, all major airlines have been running Frequent Flyer Programs
f) Unprecedented safety concerns: because of the nature of air travel, the risks are high and, in case of accidents, the human casualty mounts up.
Corporate Governance: - The business of Delta is managed under the direction and oversight of the Board, which is elected by the stockholders. The Delta Board represents the stockholders’ interest in optimizing long-term financial returns.
- The Board also considers, as appropriate, the concerns of other stakeholders and interested parties, including employees, customers, suppliers, government officials and the public at large.
- Directors counsel management and monitor performance and adherence to corporate standards. Delta’s business is conducted by its employees, managers and officers under the direction of the chief executive officer.
Board of Directors: - The Board of Directors holds regular meetings four times a year, schedules special meetings when required, and regularly meets in executive session without management. The Board and its committees also meet informally from time to time.
Non-Executive, Independent Chairman of the Board: Mr. Daniel Carp
President - Director: Mr. Edward H. Bastian CEO - Director: Mr. Richard H. Anderson
Non-Executive, Independent Vice Chairman of the Board: Mr. Roy J. Bostock
CFO - Executive Vice President: Mr. Paul Jacobson COO - Executive Vice President: Mr. Wayne West
Director Compensations: The Board will periodically review director compensation in comparison with companies that are similarly situated to ensure that Board and committee compensation is reasonable and competitive. Directors who are employees of Delta will not be separately compensated.
Compensation should fairly pay outside directors for work required in a company of Delta’s size and scope; compensation should align directors’ interests with the long-term interest of stockholders; and the structure of the compensation should be transparent and easy for stockholders to understand.
The Board will work with the appropriate Committee and any compensation consultant regarding director compensation.
2. What is the ownership structure of the company? Who owns the stock of this company? Individual vs Pension funds vs Mutual funds, etc.
Current Ownership # of Owners % Owned by
-Institutions: 35,455.06 Mil USD 1,256 88.67%
-Mutual Funds: 15,710.80 Mil USD 1,893 39.29%
-Insiders: 97.78 Mil USD 0.25%
3. What is the company’s most recent capital structure? What kinds of financing does the company use? How does that compare with the other firms in the same industry? Does your company have too little or too much debt? Explain the advantages and disadvantages of debt.
Capital Structure: Total Debt to Total Equity 110.94
as of 12/02/2015 Total Debt to Total Capital 52.59
Total Debt to Total Assets 18.07
Long-Term Debt to Equity 97.14
Long-Term Debt to Total Capital 46.05
Financing Method: Debt, capital expenditures on leases and investment (on new aircrafts), share repurchase programs, and undrawn revolving lines of credit.
Debt Analysis - The principal amount of debt and capital leases has declined from $14.4 billion at the beginning of 2012 to $9.9 billion at December 31, 2014 . Since December 31, 2009, they have reduced their principal amount of debt and capital leases by $8.4 billion.
- They have focused on reducing their total debt in recent years as part of their strategy to strengthen their balance sheet. In addition, they have refinanced debt to reduce their total future interest expense.
- Delta's underfunded pension plans remain a concern. Pension liabilities have been increased from $12,392 (mil) in 2013 to $15,138 (mil) in 2014. I expects that figure to increase at year-end 2015 due to the prevailing interest rate environment.
4. What has been the dividend policy for your company? Has it paid dividends, plans to pay or has just recently started paying dividends? Do they pay cash dividends or do they do stock buybacks? What are the pros and cons of either approaches of returning cash to stockholders?
Dividend Policy - In May 2013, they announced a plan to return more than $1 billion to shareholders over the next three years. As part of this plan, the Board of Directors initiated a quarterly dividend program and a $500 million share repurchase program,
which was to be completed no later than June 30, 2016. They completed this share repurchase authorization during the June 2014 quarter.
- In the September 2013 quarter, the Board of Directors initiated a quarterly dividend program of $0.06 per share. In the September 2014 quarter, the Board increased the quarterly dividend payment to $0.09 per share.
- Their ability to pay future dividends is subject to compliance with covenants in several of their credit facilities. In addition, any future determination to pay cash dividends will be at the discretion of the Board of Directors,
subject to applicable limitations under Delaware law, and will be dependent upon our results of operations, financial condition, cash requirements, future prospects and other factors deemed relevant by the Board of Directors.
Pros and Cons of dividend paying:
I do not consider shareholder returns at these levels to be constraints on the ratings given Delta's ability to generate cash. However shareholder-friendly activities could present a credit concern in the future if they were pursued at the expense of a healthy balance sheet.
5. How would you value the company based on different approaches discussed in Chapter 8, eg. Constant dividend growth model, multi stage valuation, multiples, etc.?
Stock valuation: Price/Earnings 14.3 Using multipliers: Po= 36.77
as of 12/02/2015 Price/Book 3.8 BPE = 47.14
Price/Sales 1.0 EPS = 0.78
Dividend Yield .55
845,048,310
4.
5. December 31, Common Size December 31,Common Size Change in %
(in millions, except share data) 2014 2013
ASSETS
Current Assets:
Cash and cash equivalents 2,088$ 3.86% 2,844$ 5.44% -1.58%
Short-term investments 1,217 2.25% 959 1.84% 0.41%
Accounts receivable, net of an allowance for uncollectible
accounts of $21 and $23
at December 31, 2014 and 2013, respectively 2,297 4.24% 1,609 3.08% 1.16%
Hedge margin receivable 925 1.71% 3 0.01% 1.70%
Fuel inventory 534 0.99% 706 1.35% -0.36%
Expendable parts and supplies inventories, net of an
allowance for obsolescence of $127 and $118
at December 31, 2014 and 2013, respectively 318 0.59% 357 0.68% -0.10%
Hedge derivatives asset 1,078 1.99% 585 1.12% 0.87%
Deferred income taxes, net 3,275 6.05% 1,736 3.32% 2.73%
Prepaid expenses and other 733 1.35% 852 1.63% -0.28%
Total current assets 12,465 23.03% 9,651 18.47% 4.56%
Property and Equipment, Net:
Property and equipment, net of accumulated depreciation and
amortization of $9,340 and $7,792 at December 31, 2014 and
2013, respectively 21,929 40.52% 21,854 41.82% -1.31%
Other Assets:
Goodwill 9,794 18.10% 9,794 18.74% -0.65%
Identifiable intangibles, net of accumulated amortization
of $793 and $738
at December 31, 2014 and 2013, respectively 4,603 8.51% 4,658 8.91% -0.41%
Deferred income taxes, net 4,320 7.98% 4,992 9.55% -1.57%
Other noncurrent assets 1,010 1.87% 1,303 2.49% -0.63%
Total other assets 19,727 36.45% 20,747 39.71% -3.26%
Total assets 54,121$ 100% 52,252$ 100% 0%
LIABILITIES AND STOCKHOLDERS' EQUITY
Current Liabilities:
Current maturities of long-term debt and capital leases 1,216$ 2.25% 1,547$ 2.96% -0.71%
Air traffic liability 4,296 7.94% 4,122 7.89% 0.05%
Accounts payable 2,622 4.84% 2,300 4.40% 0.44%
Accrued salaries and related benefits 2,266 4.19% 1,926 3.69% 0.50%
Hedge derivatives liability 2,772 5.12% 146 0.28% 4.84%
DELTA AIR LINES, INC.
Consolidated Balance Sheets
6. Frequent flyer deferred revenue 1,580 2.92% 1,861 3.56% -0.64%
Other accrued liabilities 2,127 3.93% 2,250 4.31% -0.38%
Total current liabilities 16,879 31.19% 14,152 27.08% 4.10%
Noncurrent Liabilities:
Long-term debt and capital leases 8,561 15.82% 9,795 18.75% -2.93%
Pension, postretirement and related benefits 15,138 27.97% 12,392 23.72% 4.25%
Frequent flyer deferred revenue 2,602 4.81% 2,559 4.90% -0.09%
Other noncurrent liabilities 2,128 3.93% 1,711 3.27% 0.66%
Total noncurrent liabilities 28,429 52.53% 26,457 50.63% 1.90%
Total Liabilities 45,308 83.72% 40,609 77.72% 6.00%
Commitments and Contingencies
Stockholders' Equity:
Common stock at $0.0001 par value; 1,500,000,000 shares
authorized, 845,048,310 and 869,484,981 shares issued at
December 31, 2014 and 2013, respectively - 0.00% - 0.00% 0.00%
Additional paid-in capital 12,981 23.99% 13,982 26.76% -2.77%
Retained earnings 3,456 6.39% 3,049 5.84% 0.55%
Accumulated other comprehensive loss (7,311) -13.51% (5,130) -9.82% -3.69%
Treasury stock, at cost, 19,790,077 and 18,041,848 shares
at December 31, 2014 and 2013, respectively (313) -0.58% (258) -0.49% -0.08%
Total stockholders' equity 8,813 16.28% 11,643 22.28% -6.00% (2,830)
Total liabilities and stockholders' equity 54,121$ 100% 52,252$ 100% 0%
7. December 31, Common Size I. ST solvency, or liquidity, ratios (don’t study last two) Liquidity: the ability to meet short-term obligations without undue s
(in millions, except per share data) 2014 Current Ratio 0.74 = CA/CL
Operating Revenue: Quick Ratio 0.69 =(CA-Inv)/CL
Passenger: Cash Ratio 0.12 =Cash/CL
Mainline 28,688$ 71.08% II. LT solvency or finanical leverage, ratios Leverage: the proportion of assets financed by LT obligations
Regional carriers 6,266 15.52% Finanical Analysist or investor will look at this ratio
Total passenger revenue 34,954 86.60% Total Debt Ratio 0.84 =(TA-TE)/TA
Cargo 934 2.31% D/E ratio 5.14 =Total Debt/TE
Other 4,474 11.08% Equity multiplier =D/E ratio+1 6.14 =TA/TE
Total operating revenue 40,362 100% LT Debt Ratio 0.76 =LT D/(LT D+TE)
TIE ratio 2.65 =EBIT/Interest
Operating Expense: Cash coverage ratio 5.37 =(EBIT+Dep)/Int.
Aircraft fuel and related taxes 11,668 28.91% III. Asset Management, or turnover, ratios
Salaries and related costs 8,120 20.12% Inv. Turnover 26.96 times =COGS/Inv
Regional carrier expense 5,237 12.98% Days' sales in Inv. 13.54 days =365/Inv. Turnover
Aircraft maintenance materials and outside repairs 1,828 4.53% Receivable turnover 17.57 times =Sales/AR
Depreciation and amortization 1,771 4.39% Days' sales in Receivables 20.77 days =365/Rec. Turnover
Contracted services 1,749 4.33% Fixed asset turnover 1.84 times =Sales/Net FA Cost of Revenue 22,967.00
Passenger commissions and other selling expenses 1,700 4.21% Total Asset turnover 0.75 times =Sales/TA
Landing fees and other rents 1,442 3.57% IV. Profitablity ratios:
Profit sharing 1,085 2.69% Profit margin 1.63% =NI/Sales
Passenger service 810 2.01% ROA 1.22% =NI/TA
Aircraft rent 233 0.58% ROE 7.48% =NI/TE
Restructuring and other items 716 1.77% ROE 7.48% =NI/Sales * Sales/A * A/E
Other 1,797 4.45% V. Market value ratios
Total operating expense 38,156 94.53% PE ratio 4.3 =Price per share/EPS
PEG ratio 1.57 = PE ratio/E growth rate %
Operating Income 2,206 5.47% Price-Sales Ratio 1.1
Other Expense: Price-Book Ratio 3.3
Loss on extinguishment of debt (268) -0.66%
Miscellaneous, net (216) -0.54% Gross Profit Margin 43.10%
Total other expense, net (484) -1.20% Operating Margin 5.47%
Earnings Before Interest and Taxes 1,722 4.27%
Interest expense, net (650) -1.61%
Income Before Income Taxes 1,072 2.66%
Income Tax (Provision) Benefit (413) -1.02%
Net Income 659$ 1.63%
Dividends paid (251)$
Addition to RE 408$
DELTA AIR LINES, INC.
Consolidated Statements of Operations
DELTA AIR LINES, INC.
Financial Ratios 2014
8. Number of shares 2014 845,048,310
Basic Earnings Per Share 0.79$
Diluted Earnings Per Share 0.78$
Cash Dividends Declared Per Share 0.30$ 0.00074%
Book per share 14.90$
The DuPont breakdowns for Delta Airlines(Table 3.9)
ROE Profit margin Total asset turnover Equity multiplier
Delta Airlines
2014 7.48% = 1.63% × 0.75 × 6.14
9. December 31, (in millions)
(in millions) 2014 CFFA - cash flow from assets = CFC - CF to creditors + CFS - CF to stkholders
Cash Flows From Operating Activities: CFFA = Operating CF - Net Capital Spending - Change in NWC
Net income 659$ = 3,080$
Adjustments to reconcile net income to net cash provided - 1,846$
by operating activities: - 87$
Depreciation and amortization 1,771 1,147$
Amortization of debt discount, net 59
Hedge derivative contracts 2,186 Operating CF:
Deferred income taxes 414 EBIT 1,722$
Pension, postretirement and postemployment expense less Add: Depreciation 1,771$
than payments (723) Less: Taxes (413)$
Restructuring and other items 758 3,080$
Extinguishment of debt 268 Net Capital Spending:
Equity investment loss (earnings) 106 Add: End. Net Fixed Assets 21,929$
SkyMiles used pursuant to advance purchase under Depreciation 1,771$
American Express Agreements - Less: Beg. NFA 21,854$
Changes in certain assets and liabilities: 1,846$ Acquire more Property,Equipment
Receivables (302) Change in NWC:
Restricted cash and cash equivalents 62 End. NWC (4,414)$
Fuel inventory 172 Less: Beg. NWC (4,501)$
Hedge margin (922) 87$
Prepaid expenses and other current assets 58 CFFA 1,147$
Air traffic liability 174 CFC Interest paid 650
Frequent flyer deferred revenue (238) Net new borrowing (1,908)$ Payments > Proceeds
Accounts payable and accrued liabilities 228 (End. - Beg.) CFC 2,558$
Other, net 217 CFS Dividends paid 251
Net cash provided by operating activities 4,947 Net new equity raised (2,422)$
(End. - Beg.) CFS 2,673$
Cash Flows From Investing Activities:
Property and equipment additions:
Flight equipment, including advance payments (1,662)
Ground property and equipment, including technology (587)
Purchase of Virgin Atlantic shares -
Purchase of short-term investments (1,795)
Redemption of short-term investments 1,533
Other, net 48
Net cash used in investing activities (2,463)
Cash Flows From Financing Activities:
Payments on long-term debt and capital lease obligations (2,928)
Repurchase of common stock (1,100)
Cash dividends (251)
Proceeds from long-term obligations 1,020
Other, net 19
DELTA AIR LINES, INC.
Consolidated Statements of Cash Flows
DELTA AIR LINES, INC.
Consolidated Statements of Cash Flows
10. Net cash used in financing activities (3,240)
Net (Decrease) Increase in Cash and Cash Equivalents (756)
Cash and cash equivalents at beginning of period 2,844
Cash and cash equivalents at end of period 2,088$
11. Industry Number of firms Current PE Trailing PE Forward PE
Aggregate Mkt
Cap/ Net
Income
Aggregate
Mkt Cap/
Trailing Net
Income
Expected
growth -
next 5 years PEG Ratio
Air Transport 22 47.14 28.11 14.42 14.65 10.90 34.73% 0.31
Southwest Airlines 30.13 18.18 12.14 32.13B 21.54% 0.48
Year Sales Net Income EPS Date
12-mos
Rolling EPS Dividend P/E Ratio
Year Ended Dec 2014 17.09B 421M 0.56 Dec-14 1.64 0.06 25.8 20.85
Growth Rates 9.13% 136.52% 143.80% Sep-14 1.66 0.06 20.34
Jun-14 1.54 0.06 17.44
Mar-14 1.19 0.04 19.83
Business Model: 1. What is the business model for your company, what is makes and sells, what industry, etc.? What are the inherent risks in the industry segment it is operating in? What is the nature of governance for your company? Who are the Board of Directors, what do senior management get compensated and how, etc.
Southwest Airlines has a focus on commuter benefits, low fairs, and efficiency.
They are able to offer lower fairs than their competition because they only offer a single coach cabin without a first class, only use one type of plane (Boeing 737)
which lowers their operating costs, and they offer simplified snacks and drink options to have a more efficient turnaround when cleaning the aircraft in between flights.
Inherent Risks:
a. Threats of terrorism
Ever since the terrorist attacks of 9/11/2001, the airline industry has had to cope with several challenges.
Revenue has declined and costs have increased throughout the industry, and the demand for air travel has decreased because some people fear for their safety.
While the industry has improved since the attacks in 2001, there have still been issues with uncertain purchasing behavior among customers as well as historically high aircraft fuel prices.
. It is expected that these industry trends continue. (SEC.Gov).
b. Extensive governmental regulation
Airlines are required to comply with extensive laws and regulations put in place by the government, which can be very expensive.
For example, The FAA (Federal Aviation Administration) often issues new maintenance regulations that can significantly raise operational expenses.
Companies in the industry expect to continue seeing new regulations to comply with in the future. (SEC.Gov).
There are also various other regulations and laws that differ depending on the airport.
For example, the Aviation and Transportation Security Act of November 2001, requires additional federal security procedures and requirements that are funded by a per-ticket tax and a tax on airlines, which can cut down revenues and make business less profitable. (SEC.Gov)
c. Increasingly seasonal business model
Air travel can be a very seasonal business model with demand soaring during holidays and popular vacation dates in winter and spring.
Also, demand is affected by economic conditions, political stability, weather, and ticket prices.
This can sometimes be difficult for airlines to explain to shareholders, as the results from one quarter may not accurately reflect the actual health and stability of the company for the entire fiscal year and into the future. (SEC.Gov)
Corporate Governance:
The nature of governance for Southwest Airlines is very straightforward and effective.
The Board of directors is “responsible for promoting the best interest of the company and its shareholders by overseeing management of the companies business” (Southwest Airlines Co. Corporate Governance Guidelines).
They do so while following two basic legal obligations, the duty of care, “which requires that board members always exercise appropriate diligence in making decisions and overseeing management” (Southwest Airlines Co. Corporate Governance Guidelines);
and the duty of loyalty, which in simple terms requires members to ignore their personal interests and make decisions in the best interest of the company and its shareholders.
Board of Directors:
Directors get elected annually at shareholders meetings and are required to hold office until the next annual meeting, and until their successors have been elected and qualified, or until retirement, resignation, removal, or early death.
There are currently 10 members on the board with two honorary designations:
David Biegler, Veronica Biggins, Douglas Brooks, William Cunningham, John Denison, Thomas Gilligan, Gary Kelly, Nancy Loeffler, John Montford, Ron Ricks, and honorary designations to Herbert Kelleher and Colleen Barrett.
(http://southwest.investorroom.com/board-of-directors)
Director Compensations:
The Compensation Committee of the Board of Directors is responsible for structuring and reviewing the compensation and benefits for senior management and non-employee directors.
They annually evaluate the CEO’s salary, bonuses, and equity compensation. They must annually review and approve the compensation structure and performance for all officers.
12. The compensation structure for senior management seeks to promote and reward productivity and dedication to the wellbeing of the company in all areas.
It is required that directors have a financial stake in the company, any director that has served at least two years must have a minimum of 1000 shares of LUV common stock.
Current Ownership 2. What is the ownership structure of the company? Who owns the stock of this company? Individual vs Pension funds vs Mutual funds, etc.
% ownership Shares Held
Institutional Holdings 78.33% 509421839
1. Primecap Management 14.61% 74401158 (An individual investment management company)
2. FMR LLC 8.86% 45146705 (Fidelity investments Mutual Fund)
3. Vanguard Group Inc. 7.35% 37452362 (Investment management, large provider of mutual funds)
4. State Street Corp 4.39% 22384468 (Worldwide financial services holding company)
5. Blackrock Institutional Trust Company. 3.53% 17964892 (Multinational investment management corporation)
Institutions account for $25,066,850
Mutual Funds account for $12,846,460
Insiders account for $67,470,000
Capital Structure: 3. What is the company’s most recent capital structure? What kinds of financing does the company use? How does that compare with the other firms in the same industry? Does your company have too little or too much debt? Explain the advantages and disadvantages of debt.
Total Debt to Total Equity 39.73
Total Debt to Total Capital 28.44
Total Debt to Total Assets 13.33
Long-Term Debt to Equity 35.93
Long-Term Debt to Total Capital 25.71
Southwest Airlines most recent capital structure reports Debt of 2.7 billion (27.7%) and Equity of 7.0 billion (72.3%).
Financing Method: They use a mixture of common stock and corporate bonds for financing. Compare to JetBlue Airlines, another low cost air travel provider, Southwest Airlines seems to be a much healthier company.
JetBlue’s capital structure consists of 39.6% ($2 billion) in debt and 60.4% (3.0 billion) in equity. While Southwest airlines may have more debt than JetBlue, the percentage of their capital structure is less for debt compared to JetBlue.
Debt Analysis Southwest Airlines has reported earnings per share of 2.45 for 2015, 1.64 for 2014, and 1.05 for 2013. JetBlue Airlines has reported earnings per share of 1.42 for 2015, 1.19 for 2014, and .52 for 2013.
Amount outstanding for Southwest airlines is 1.7 billion, while amount outstanding for JetBlue is 86.0 million. From these numbers alone it is easy to see that Southwest Airlines is a much bigger, and more successful company.
Southwest Airlines has a debt/equity ratio of .34 for 2015 which is quite good. They have a large majority of their capital structure in equity financing which makes it very easy to acquire loans if needed.
Taking out debt in the form of loans or corporate bonds can help when pursuing a growth strategy as the money can be paid off over time.
However, the money must be paid back with interest regardless of company profitability, this can be very risky as taking out too much debt can limit profitability and growth.
With equity financing, the risk gets shared with shareholders and the company does not need to pay back equity finances other than through dividend payments.
However, with equity financing you are giving up ownership of the company and potentially limiting your power and freedom to make strategic decisions.
Dividend Policy 4. What has been the dividend policy for your company? Has it paid dividends, plans to pay or has just recently started paying dividends? Do they pay cash dividends or do they do stock buybacks? What are the pros and cons of either approaches of returning cash to stockholders?
Southwest Airlines has been paying dividends since 1976, with the first company dividend declared on August 10, 1976. Recent dividend reports show that since 1977 dividends have increased from $.0023 per share to $.075 per share.
They pay cash dividends as well as stock buybacks. Since 2011 Southwest airlines has returned $3.6 billion to shareholders through share repurchases and dividends.
As of 8/30/15 they have returned $180 million in dividends and repurchased $1.2 billion in common stock.
Pros and Cons of dividend paying:
Stock buybacks is the process of repurchasing of company shares from the market place. This reduces the number of shares outstanding, which if the company is doing well, can boost the earnings per share and return on equity metrics.
Improving metrics such as these can increase the share price over time, which is always good for the health of the company. Buybacks represent a rather uncertain return because the health of the company in the future can be hard to predict.
Dividends are regular payments to shareholders of after tax profits. Shareholders must also pay tax on their dividend payments, usually at a tax rate of 15%. Dividends represent a predictable return that most investors appreciate and look forward to
Southwest Airlines uses both methods in harmony to repay their shareholders on a quarterly schedule through dividends while also improving earnings per share by buying back stock from the marketplace.
Stock valuation: 5. How would you value the company based on different approaches discussed in Chapter 8, eg. Constant dividend growth model, multi stage valuation, multiples, etc.?
Valuation using multiples
Benchmark PE BPE = 47.14
Earnings per share EPS= 0.56
Po =26.3984
13. 6. Based on all your analysis above for your individual company, you will then meet with your group to compare and contrast the performance of your company with those of your group members. You will then set a price target of your company for 1 year in the future and issue a BUY, HOLD or SELL rating on the stock.
17. Dec 31,2014 Common Size Dec 31,2013 Common Size % change
Current assets:
Cash and cash equivalents $1,282 6.35% $1,355 7.00% -0.66%
Short-term investments 1,706 8.45% 1,797 9.29% -0.84%
Accounts and other receivables 365 1.81% 419 2.17% -0.36%
Inventories of parts and supplies, at
cost 342 1.69% 467 2.41% -0.72%
Deferred income taxes 477 2.36% 168 0.87% 1.49%
Prepaid expenses and other current
assets 232 1.15% 250 1.29% -0.14%
Total current assets 4,404 21.80% 4,456 23.03% -1.23%
Property and equipment, at cost: 0.00% 0.00%
Flight equipment 18,473 91.45% 16,937 87.55% 3.90%
Ground property and equipment 2,853 14.12% 2,666 13.78% 0.34%
Deposits on flight equipment
purchase contracts 566 2.80% 764 3.95% -1.15%
Assets constructed for others 621 3.07% 453 2.34% 0.73%
Property and equipment, at cost 22,513 111.45% 20,820 107.62% 3.83%
Less allowance for depreciation and
amortization 8,221 40.70% 7,431 38.41% 2.28%
Property and equipment, net 14,292 70.75% 13,389 69.21% 1.54% Net capital spending 903
Goodwill 970 4.80% 970 5.01% -0.21%
Other assets 534 2.64% 530 2.74% -0.10%
Total assets
20,200 19,345 100.00% -100.00%
Current liabilities:
0.00% 0.00%
Accounts payable 1,203 5.96% 1,247 6.45% -0.49%
Accrued liabilities 1,565 7.75% 1,229 6.35% 1.39%
Air traffic liability 2,897 14.34% 2,571 13.29% 1.05%
Current maturities of long-term debt
258 1.28% 629 3.25% -1.97%
Total current liabilities 5,923 29.32% 5,676 29.34% -0.02%
Long-term debt less current maturities
2,434 12.05% 2,191 11.33% 0.72% Net new borrowing 243
Deferred income taxes 3,259 16.13% 2,934 15.17% 0.97%
Construction obligation
554 2.74% 437 2.26% 0.48%
Other noncurrent liabilities
1,255 6.21% 771 3.99% 2.23%
Total Noncurrent Liabilities
7,502 37.14% 6,333 32.74% 4.40%
Total Liabilities 13,425 66.46% 12,009 62.08% 4.38%
Stockholders' equity: 0.00% 0.00%
Common stock, $1.00 par value:
2,000,000,000 shares authorized;
807,611,634 shares issued in 2014 and
2013 808 4.00% 808 4.18% -0.18% END common stock 808000000
Capital in excess of par value
1,315 6.51% 1,231 6.36% 0.15%
Retained earnings 7,416 36.71% 6,431 33.24% 3.47%
Accumulated other comprehensive
loss -738 -3.65% -3 -0.02% -3.64%
Treasury stock, at cost: 132,017,550
and 107,136,946 shares in 2014 and
2013 respectively -2,026 -10.03% -1,131 -5.85% -4.18% end treasury stock 107136946
Total stockholders' equity 6,775 33.54% 7,336 37.92% -4.38% END C.S & T Stock. 915136946
Total liabilities and
stockholders' equity $20,200 $19,345
12 Months Ended Dec 31,2014 31-Dec-13 Southwest Airlines
CASH FLOWS FROM
OPERATING ACTIVITIES: Cash Flow Summary
Net income $1,136 $754 1 CFFA = CFC +CFS
Adjustments to reconcile net income
to cash provided by operating
activities: 2 Cash Flow From Assets
Depreciation and amortization 938 867 CFFA (879,636,946.00)$ 1,385,000,000 Operating CF - Net capital spending - changes in nwc
Unrealized (gain) loss on fuel
derivative instruments 279 -5 Operating Cash Flow 2,483,000,000.00$ EBIT + DEP - TAXES
Deferred income taxes 501 50 Net Capital Spending 903,000,000.00$ Purchases of FA - Sale of FA
Changes in certain assets and
liabilities: Change in NWC 195,000,000.00$ End NWC - Beg NWC
Accounts and other receivables 54 -17
Other assets 142 -46 3 Cash Flow to Creditors
Accounts payable and accrued
liabilities 36 343 CFC (113,000,000.00)$ Interest Paid -Net new borrowing
Air traffic liability 326 400 Interest Paid 130,000,000.00$
Cash collateral received from
(provided to) derivative
counterparties -233 57 Net new borrowing 243.00$ (end LTD - beg LTD)
Other, net -277 74 4 Cash Flow to Stockholders
Net cash provided by operating
activities 2,902 2,477 CFS (766,636,946.00)$ Dividends paid - net new equity
Cash Flows From Investing
Activities: Dividends Paid 148,500,000.00$
Capital expenditures -1,748 -1,433 Net new equity raised 915,136,946.00$ ending common stock & treasury stock
Consolidated Balance Sheet (USD $)
In Millions, unless otherwise specified
Consolidated Statement of Cash Flows (USD $)
In Millions, unless otherwise specified
18. Assets constructed for others -80
Prior Period Reclassification
Adjustment 14
Purchases of short-term
investments -3,080 -3,135 Date Dividend Paid Shares OutstandingDividends Paid
Proceeds from sales of short-term
and other investments 3,185 3,198 12/9/2014 0.06 675000000 40500000
Other, net -4 0 8/9/2014 0.06 675000000 40500000
Net cash used in investing activities
-1,727 -1,384 6/2/2014 0.06 675000000 40500000
Net cash used in financing activities 3/4/2014 0.04 675000000 27000000
Proceeds from issuance of long-
term debt 300 0 148500000 Dividends paid 2014
Proceeds from Employee stock
plans 110 96
Reimbursement for assets
constructed for others 27 0
Proceeds from termination of
interest rate derivative instrument 0 0
Payments of long-term debt and
capital lease obligations -561 -313
Payments of cash dividends -139 -71
Repayment of construction
obligation -11 -5
Repurchase of common stock -955 -540
Other, net -19 -18
Net cash used in financing
activities -1,248 -851
NET CHANGE IN CASH AND CASH
EQUIVALENTS -73 242
CASH AND CASH EQUIVALENTS AT
BEGINNING OF PERIOD 1,355 1,113
CASH AND CASH EQUIVALENTS AT
END OF PERIOD 1,282 1,355
CASH PAYMENTS FOR:
Interest 128 133
Income taxes 155 346
SUPPLEMENTAL DISCLOSURE OF
NONCASH TRANSACTIONS:
Assets constructed for others $88 $105
12 Months Ended 31-Dec-14 Common Size Dec 31,2013 Common Size % change
OPERATING REVENUES:
Passenger $17,658 94.91% $16,721 94.47% 0.44%
Freight 175 0.94% 164 0.93% 0.01%
Other 772 4.15% 814 4.60% -0.45%
Total operating revenues 18,605 100.00% 17,699 100.00% 0.00%
OPERATING EXPENSES:
Salaries, wages, and benefits 5,434 29.21% 5,035 28.45% 0.76%
Fuel and oil 5,293 28.45% 5,763 32.56% -4.11%
Maintenance materials and repairs
978 5.26% 1,080 6.10% -0.85%
Aircraft rentals 295 1.59% 361 2.04% -0.45%
Landing fees and other rentals 1,111 5.97% 1,103 6.23% -0.26%
Depreciation and amortization 938 5.04% 867 4.90% 0.14%
Acquisition and integration 126 0.68% 86 0.49% 0.19%
Other operating expenses 2,205 11.85% 2,126 12.01% -0.16%
Total operating expenses 16,380 88.04% 16,421 92.78% -4.74%
EBIT 2,225 11.96% 1,278 7.22% 4.74%
OTHER EXPENSES (INCOME):
Interest expense 130 0.70% 131 0.74% -0.04%
Interest Costs Capitalized
Adjustment -23 -0.12% -24 -0.14% 0.01%
Interest income -7 -0.04% -6 -0.03% 0.00%
Other (gains) losses, net 309 1.66% -32 -0.18% 1.84%
Total other expenses (income) 409 2.20% 69 0.39% 1.81%
EBT 1,816 9.76% 1,209 6.83% 2.93%
PROVISION FOR INCOME TAXES 680 3.65% 455 2.57% 1.08%
NET INCOME $1,136 6.11% $754 4.26% 1.85%
NET INCOME PER SHARE, BASIC (in
dollars per share) $1.65 0.01% $1.06 0.01% 0.00%
NET INCOME PER SHARE, DILUTED
(in dollars per share) $1.64 0.01% $1.05 0.01% 0.00%
Cash dividends declared per
common share (in dollars per
share) $0.22 0.00% $0.13 0.00% 0.00%
I. ST solvency, or liquidity, ratios (don’t study last two)
Current Ratio 0.74$ $.74 for every $1 in current liabilities = CA/CL
Quick Ratio 0.686 Inventory is illiquid compared to cash =(CA-Inv)/CL
Cash Ratio 0.216 Usefull for short term creditors =Cash/CL
II. LT solvency or finanical leverage, ratios
Finanical Analysist or investor will look at this ratio
Total Debt Ratio 0.665 $.65 in debt for ever $1 in assets (TA-TE)/TA
Southwest Airlines
Financial Ratios 2014
Consolidated Statement of Income (USD $)
In Millions, except Per Share data, unless otherwise specified
19. Industry
Number of
firms Current PE Trailing PE Forward PE
Aggregate
Mkt Cap/
Net Income
Aggregate
Mkt Cap/
Trailing Net
Income
Expected
growth -
next 5
years PEG Ratio
Air Transport 22 47.14 28.11 14.42 14.65 10.90 34.73% 0.31
JetBlue 15.57 15.5 11.65 8.22B 25% 0.27 as of 12/08/2015
Key Financial Ratios and Statistics FYE: 12/31/2014 Number of Shares: 309,870,000
Year Sales Net Income EPS Date
12-mos
Rolling EPS Dividend P/E Ratio
Dec-14 5,817.00 401$ 1.29 Sep-14 0.24 0 11.3
Growth Rates 6.91% 139% 129% Dec-14 0.26 0 14.02
Mar-15 0.4 0 15.41
Jun-15 0.44 0 12.3
JetBlue Airlines
One of the more recent companies to join the air transport industry is JetBlue Airways, a company with a no-nonsense approach that capitalizes on cost
advantages. To achieve their success, they adopted an aggressive cost cutting approach to get rid of the unnecessary fluff that did not result in a positive return on
investment. To become an innovative cost leader with fares roughly 50% cheaper than its competitors, JetBlue did away with additional services, such as serving meals,
and focused on quality service at a more affordable price to appeal to a greater segment of the market.
The airline industry comes with a significant amount of risks, as displayed by the cumulative industry losses over the last twelve decades. A few that
stand out the most include its extensive capital requirement with high fixed costs, low profitability, high vulnerability to the state of the economy, nationalization of
airlines, frequent bailouts, high entry barriers and regulations, low switching costs for consumers, safety concerns, and alliances.
To defeat these risks, JetBlue has instituted the best possible governance team they could form. This team includes the President/CEO, CFO, an
Executive Vice President of People, Customer Experience, Corporate Affairs, General Counsel and Corporate Secretary, Operations, Commercial and Planning, as well as a
Chief Information Officer and Board of Directors. The Board of Directors includes Robin Hayes, Jens Bischof, Peter Boneparth, David Checketts, Virginia Gambale,
Stephan Gemkow, Ellen Jewett, Gen. Stanley McChrystal, Frank Sica, Thomas Winkelmann, and Chairman, Joel Peterson. This Board is composed of both employee and
independent directors, with a majority being independent directors. They comprise of three committees: audit, compensation, and corporate governance and
nominating. Self-assessments are performed every year by the board.
Compensation for executives in JetBlue is as follows: David Barger/Chief Executive Officer - $3,084,629; Mark D. Powers/Executive Vice President and
CFO - $1,675,504; Robin Hayes/President - $1,876,898; Robert Maruster/Former Executive Vice President and COO - $1,678,398; James G. Hnat/Executive Vice President
and General Counsel - $1,176,195. The distribution of the total compensation for senior management is 38.33% cash, 51.10% in equity, and 10.57% from other sources.
20. and General Counsel - $1,176,195. The distribution of the total compensation for senior management is 38.33% cash, 51.10% in equity, and 10.57% from other sources.
JetBlue’s ownership structure currently consists of institutions, mutual funds, and insiders. The distribution is as follows: Institutions - $6,914.43 (Mil
USD), 574 owners, 88.35% owned; Mutual Funds - $3,692.96 (Mil USD), 726 owners, 47.19% owned; Insiders - $35.53 (Mil USD), 0.43% owned.
As of Q3 2015, JetBlue’s capital structure consists of roughly $2B in debt and $3B in equity. This amounts to roughly 40% debt and 60% equity. The
capital structure ratios are as follows: Total Debt to Total Equity - 107.55; Total Debt to Total Capital - 51.82; Total Debt to Total Assets - 34.70; Long-Term Debt to Equity
- 97.07; Long-Term Debt to Total Capital - 46.77. Compared to a much larger competitor in Southwest Airlines, JetBlue has significantly more debt and less equity (about
a 12% spread in each category). Debt is not a bad thing if it is in the interest of growth. Without debt, you will probably remain stagnant and run out of business.
However, debt must be paid back with interest, so too much debt can bury your business. You must find a healthy balance between the two.
Although very attractive to investors, JetBlue does not yet offer dividends as a relatively new company. They are currently focusing on paying down their
debt, rather than returning cash to the stockholders. There must be a balance in these priorities. While you want to please investors, using your cash to maintain good
credit and pay off your debt is vital to the company’s survival. However, they have engaged in stock buybacks. Over the last 5 years, they have repurchased about 1% of
their outstanding shares, with plans to repurchase many more in the future with their significantly increased growing profits.
P/E ratio = 14.92; Price/Book = 3.20; Price/Sales = 0.92; BPE = 47.14; EPS = 1.29; Po = 36.54
Based on the 69% stock growth rate over the past 12 months for JetBlue, 150% increase in Net Income, and 130% increase in EPS, I would place a future
stock estimate for the company at about $40. That would be about another 60% increase from today. While it is hard to make an estimate without dividends, I believe
they will be close to maintaining this year’s growth as they accumulate more capital and continued expansion.
21. December 31, Common Size December 31,Common Size Change in %
(in millions, except share data) 2014 2013
ASSETS
Current Assets:
Cash and cash equivalents 341$ 4.35% 225$ 3.06% 1.29%
Short-term investments 367 4.68% 402 5.47% -0.79%
Accounts receivable, less allowance (2014-$6, 2013- $6) 136 1.73% 129 1.76% -0.02%
Inventory, less allowance (2014-$8, 2013-$6) 46 0.59% 48 0.65% -0.07%
Prepaid expenses 135 1.72% 126 1.71% 0.01%
Deferred Income Taxes 174 2.22% 120 1.63% 0.59%
Other 1 0.01% 6 0.08% -0.07%
Total current assets 1200 15.31% 1056 14.37% 0.94%
Property and Equipment:
Flight equipment 6233 79.51% 5778 78.61% 0.90%
Predelivery deposits for flight equipment 207 2.64% 181 2.46% 0.18%
Less: Accumulated Depreciation -1354 -17.27% -1185 -16.12% -1.15%
Other property and equipment 816 10.41% 688 9.36% 1.05%
Less: Accumulated Depreciation -252 -3.21% -251 -3.41% 0.20%
Assets constructed for others 561 7.16% 561 7.63% -0.48%
Less: Accumulated Depreciation -139 -1.77% -116 -1.58% -0.19%
Total property and equipment 6072 77.46% 5656 76.95% 0.51%
Other Assets:
Investment securities 60 0.77% 114 1.55% -0.79%
Restricted cash 61 0.78% 57 0.78% 0.00%
Other 446 5.69% 467 6.35% -0.66%
Total other assets 567 7.23% 638 8.68% -1.45%
Total assets 7,839$ 100% 7,350$ 100% 0%
LIABILITIES AND STOCKHOLDERS' EQUITY
Current Liabilities:
Accounts payable 208$ 2.65% 180$ 2.45% 0.20%
Air traffic liability 973 12.41% 825 11.22% 1.19%
Accrued salaries and related benefits 203 2.59% 171 2.33% 0.26%
Other accrued liabilities 287 3.66% 229 3.12% 0.55%
Current maturities of long-term debt and capital leases 265 3.38% 469 6.38% -3.00%
Total current liabilities 1,936 24.70% 1,874 25.50% -0.80%
JetBlue AIRLINES, INC.
Consolidated Balance Sheets
22. Long-term debt and capital lease liabilities 1,968 25.11% 2,116 28.79% -3.68%
Construction obligation 487 6.21% 501 6.82% -0.60%
Deferred taxes and other liabilities
Deferred income taxes 832 10.61% 605 8.23% 2.38%
Other 87 1.11% 120 1.63% -0.52%
Total noncurrent liabilities 919 11.72% 725 9.86% 1.86%
Commitments and Contingencies - -
Stockholders' Equity:
Preferred stock, $0.01 par value; 25,000,000 shares
authorized, none issued - -
Common stock, $0.01 par value; 900,000,000 shares authorized
, 368,883,960 and 346,489,574 shares issued and
309,871,309 and 295,587,126 shares outstanding at 2014
and 2013, respectively 4 0.05% 3 0.04% 0.01%
Treasury stock, at cost; 59,012,651 and 50,902,448 shares at
2014 and 2013, respectively (125) -1.59% (43) -0.59% -1.01%
Additional paid-in capital 1,711 21.83% 1,573 21.40% 0.43%
Retained earnings 1,002 12.78% 601 8.18% 4.61%
Accumulated other comprehensive loss (63) -0.80% - - -0.80%
Total stockholders' equity 2,529 32.26% 2,134 29.03% 3.23%
Total liabilities and stockholders' equity 7,839$ 100% 7,350$ 100% 0%
JetBlue AIRLINES, INC. JetBlue AIRLINES, INC.
Consolidated Statements of Cash Flows Consolidated Statements of Cash Flows
December 31, (in millions)
(in millions) 2014 CFFA - cash flow from assets = CFC - CF to creditors + CFS - CF to stkholders
Cash Flows From Operating Activities: CFFA = Operating CF - Net Capital Spending - Change in NWC
Net income 401$ = 854$
Adjustments to reconcile net income to net cash provided - 679$
by operating activities: - #REF!
Deferred income taxes 212 #REF!
Depreciation 263
Amortization 62 Operating CF:
Stock-based compensation 20 EBIT 756
Losses on sales of assets, debt extinguishment, and Add: Depreciation 320
customer contract termination - Less: Taxes (222)
Gain on sale of subsidiary -241 854
23. December 31, Common Size I. ST solvency, or liquidity, ratios (don’t study last two) Liquidity: the ability to meet short-term obligations without undue s
(in millions, except per share data) 2014 Current Ratio 0.62 = CA/CL
Operating Revenue: Quick Ratio 0.60 =(CA-Inv)/CL
Passenger: 5343 91.85% Cash Ratio 0.18 =Cash/CL
Other 474$ 8.15% II. LT solvency or finanical leverage, ratios Leverage: the proportion of assets financed by LT obligations
Total operating revenues 5,817 100.00% Finanical Analysist or investor will look at this ratio
Total Debt Ratio 0.68 =(TA-TE)/TA
Operating Expense: D/E ratio 2.10 =Total Debt/TE
Aircraft fuel and related taxes 1,912 32.87% Equity multiplier =D/E ratio+1 3.10 =TA/TE
Salaries and related costs 1,294 22.25% LT Debt Ratio 0.27 =LT D/(LT D+TE)
Landing fees and other rents 321 5.52% TIE ratio -3.41 =EBIT/Interest
Depreciation and amortization 320 5.50% Cash coverage ratio -4.85 =(EBIT+Dep)/Int.
Aircraft rent 124 2.13% III. Asset Management, or turnover, ratios
Sales and marketing 231 3.97% Inv. Turnover 109.78 times =COGS/Inv
Maintenance, materials and repairs 418 7.19% Days' sales in Inv. 3.32 days =365/Inv. Turnover
Other operating expenses 682 11.72% Receivable turnover 42.77 times =Sales/AR
Total operating expense 5,302 91.15% Days' sales in Receivables 8.53 days =365/Rec. Turnover
Fixed asset turnover 0.96 times =Sales/Net FA
Operating Income 515 8.85% Total Asset turnover 0.74 times =Sales/TA
Other Expense: IV. Profitablity ratios:
Interest expense (148) -2.54% Profit margin 6.89% =NI/Sales
Capitalized interest 14 0.24% ROA 5.12% =NI/TA
Interest income expense and other 1 0.02% ROE 15.86% =NI/TE
Gain on sale of subsidiary 241 4.14% ROE 15.86% =NI/Sales * Sales/A * A/E
Total other expense 108 1.86% V. Market value ratios
PE ratio 14.9 =Price per share/EPS
Earnings Before Interest and Taxes 756 13.00% PEG ratio 0.10 = PE ratio/E growth rate %
Price-Sales Ratio 1.1
Income tax expense (222) -3.82% Price-Book Ratio 3.3
Net Income 401$ 6.89% Gross Profit Margin 13.19%
Dividends paid -$ Operating Margin 9%
Addition to RE 401$
Number of shares 2014 309.87
Basic Earnings Per Share 1.36$
Diluted Earnings Per Share 1.19$ Total asset turnover Equity multiplier
Cash Dividends Declared Per Share -$ 0.00000%
Book per share 8.16$ × 0.74 × 3.10
The DuPont breakdowns for JetBlue Airlines(Table 3.9)
ROE Profit margin
JetBlue AIRLINES, INC. JetBlue AIRLINES, INC.
Consolidated Statements of Operations Financial Ratios 2014
25. Changes in certain assets and liabilities: Add: End. Net Fixed Assets 6,072$
Decrease in receivables 1 Depreciation 263
Decrease in inventories, prepaid and other 3 Less: Beg. NFA -5656
Increase in air traffic liability 148 679$
Increase in accounts payable and other accrued liabilities 68 Change in NWC:
Other, net 24 End. NWC -736 Payments > Proceeds
Net cash provided by operating activities 912 Less: Beg. NWC -818
82
Cash Flows From Investing Activities: CFFA 93$
Capital Expenditures -730 CFC Interest paid 133
Predelivery deposits for flight equipment -127 Net new borrowing -319
Proceeds from the sale and disposition of assets 8 (End. - Beg.) CFC 452$
Proceeds from the sale of subsidiary 393 CFS Dividends paid -$
Assets constructed for others - Net new equity raised 796$
Purchase of held-to-maturity investments -361 (End. - Beg.) CFS 796$
Proceeds from the held-to-maturity investments 379
Purchase of available-for-sale securities -335
Proceeeds from the sale of available-for-sale securities 398
Other, net -4
Net cash used in investing activities -379
Cash Flows From Financing Activities:
Proceeds from issuance of common stock 41
Proceeds from issuance of long-term debt 342
Proceeds from short-term borrowings and lines of credit -
Repayment of long-term debt and capital lease obligations -702
Repayment of short-term borrowing and lines of credit -
Construction obligation -14
Acquisition of treasury stock -82
Other, net -2
Net cash used in financing activities -417
Net (Decrease) Increase in Cash and Cash Equivalents 116
Cash and cash equivalents at beginning of period 225
Cash and cash equivalents at end of period 341
26.
27. Industry Number of firms Current PE Trailing PE Forward PE
Aggregate
Mkt Cap/
Net Income
Aggregate
Mkt Cap/
Trailing Net
Income
Expected
growth -
next 5
years PEG Ratio
Air Transport 22 47.14 28.11 14.42 14.65 10.90 34.73% 0.31
United Continental 3.51 3.37 7.18 21.74B 0.25 0.24
Year Sales Net Income EPS
Year Ended Dec 2014 38.14B 6.54B 100.97
Growth Rates -2.40% 421.20%
Business Model:
United Continental Airlines is a full service carrier. United Airlines became one of the world's largest airlines following the merger with Continental Airlines in 2010. The carrier operates an extensive domestic and regional network of services from its main domestic hubs.
Inherent Risks:
Brand reputation - branding is very important to airlines and damage to their brand through either a single event or series of events could impact customer perception and future revenue
Competition - operate in a highly competitve market
Debt funding - many airlines carry substantial debt which needs to be repaid or refinanced
Safety - safety and security of customers and employees are crutial
Fuel price and supply - fuel prices flucutates which affects profit margins
Corporate Governance:
United Continental recently changed their corporate governance guidelines. To read more go to http://ir.united.com/phoenix.zhtml?c=83680&p=irol-govguidelines
Board of Directors:
Oscar Munoz Chief Executive Officer, President (Leave of Absence), Director, Member of Executive Committee and Member of Finance Committee
Name (Connections)Type of Board Members
Henry Meyer IIIChairman of the Board
David Vitale Member of the Board of Directors
James HeppnerMember of the Board of Directors
Richard DelaneyMember of the Board of Directors
Director Compensations:
Current Ownership
Institutional Holdings 96.98% Top 3 Holders:
Total Shares Held 361560046 Vanguard Group Ince 25581907
Total Value of Holdings21881613984 JPMorgan Chase & Co 21360070
Net Activity 10,319,012.00$ Capital World Investors 21286767
Capital Structure:
Total Debt to Total Equity 1.42
Total Debt to Total Capital 0.28
Total Debt to Total Assets 0.29
Long-Term Debt to Equity 1.16
Long-Term Debt to Total Capital 2.89
Financing Method:
Reducing costs by $2 billion by 2017
United Continental: "We do not pay directors who are employees of the Company additional compensation for their services as
directors. To attract and retain the services of experienced and knowledgeable non-employee directors, the Company adopted
the 2006 Director Equity Incentive Plan, which we refer to as the DEIP. Under the DEIP, non-employee directors may receive as
compensation periodic awards, stock compensation or cash compensation. Periodic awards are equity-based awards including
28. Increasing pre-tax earnings by 2x to 4x
Generating ROIC of at least 10%
Reducing debt and generating cash to pay shareholders
Debt Analysis
Dividend Policy
Ex/Eff Date Type Cash AmountDeclaration DateRecord Date Payment Date
1/7/2008 Cash 2.15 12/6/2007 1/9/2008 1/23/2008
Stock valuation
Price/Earnings 3.4
Price/Book 9.17
Price/Sales .67
Dividend Yield n/a
Long term debt has decreased from 10,121 in 2014 to 9,910 in 2015. This shows that
United Continental Airlines is working on repaying their debts.
29. Consolidated Balance Sheets - USD ($) $ in
Millions
Sep. 30,
2015 2014
9 Months
Ended
9 Months
Ended
Current assets: Sep. 30,
2015
Sep. 30,
2015
Cash and cash equivalents $ 3,427 Operating revenue: Cash Flows from Operating Activities:
Short-term investments 2,172 Passenger-Mainline $ 20,153 Net cash provided by operating activities $ 4,877
Receivables, less allowance for doubtful
accounts (2015-$18; 2014-$22)
1,513 Passenger-Regional 4,903
Fuel hedge collateral deposits 156 Total passenger revenue 25,056 Cash Flows from Investing Activities:
Aircraft fuel, spare parts and supplies,
less obsolescence allowance (2015-$226;
2014-$169)
704 Cargo 706 Capital expenditures (1,984)
Deferred income taxes 1,306 Other operating revenue 3,066 Purchases of short-term and other investments (1,859)
Prepaid expenses and other 819 Total revenue 28,828 Proceeds from sale of short-term and other investments 2,069
Total current assets 10,097 8,138 Investment in affiliates (130)
Operating expense: Decrease in restricted cash 112
Operating property and equipment: Owned- Salaries and related costs 7,289 Proceeds from sale of property and equipment 50
Flight equipment 23,231 Aircraft fuel 5,904 Other, net 23
Other property and equipment 4,342 Regional capacity purchase 1,725 Net cash used in investing activities (1,719)
Operating property and equipment -
owned, gross
27,573
25,123
Landing fees and other rent 1,647
Less-Accumulated depreciation and
amortization
(8,038) Depreciation and amortization 1,343 Cash Flows from Financing Activities:
Operating property and equipment -
owned, net
19,535 Aircraft maintenance materials and outside repairs 1,252 Payments of long-term debt (1,528)
Purchase deposits for flight equipment 736 Distribution expenses 1,026 Repurchases of common stock (710)
Aircraft rent 580 Proceeds from issuance of long-term debt 613
Capital leases- Special charges (Note 10) 195 Principal payments under capital leases (80)
Flight equipment 1,562 Other operating expenses 3,782 Other, net (28)
Other property and equipment 331 Total operating expenses 24,743 Net cash used in financing activities (1,733)
Operating property and equipment -
capital leases, gross
1,893 Operating income 4,085 Net increase (decrease) in cash and cash equivalents 1,425
Less-Accumulated amortization (988) Cash and cash equivalents at beginning of the period 2,002
Operating property and equipment -
capital leases, net
905 Nonoperating income (expense): Cash and cash equivalents at end of the period 3,427
Total property, plant, and equipment,
net
21,176 Interest expense (504)
Interest capitalized 38 Investing and Financing Activities Not Affecting Cash:
Other assets: Interest income 16 Property and equipment acquired through the issuance of
debt
797
Goodwill 4,523 Miscellaneous, net (Note 10) (321) Operating lease conversions to capital lease 285
Statements of Consolidated Operations - USD ($) $ in
Millions
Condensed Statements of Consolidated Cash Flows - USD ($) $ in
Millions
30. Intangibles, less accumulated
amortization (2015-$1,120; 2014-
$1,049)
4,193 Total other expense (771) Airport construction financing 5
Deferred income taxes 846 Income before income taxes 3,314 Conversion of convertible notes to UAL common stock 201
Restricted cash 206 Income tax expense (benefit) (3,203)
Other, net 828 Net income $ 6,517 United Airlines, Inc.
Other assets total 10,596 Earnings per share, basic $ 17.19 Cash Flows from Operating Activities:
Total assets 41,869 Earnings per share, diluted $ 17.15 Net cash provided by operating activities 4,866
Cash Flows from Investing Activities:
Current liabilities: Capital expenditures (1,984)
Advance ticket sales 4,492 Purchases of short-term and other investments (1,859)
Frequent flyer deferred revenue 2,138 Proceeds from sale of short-term and other investments 2,069
Accounts payable 2,082 Investment in affiliates (130)
Accrued salaries and benefits 2,187 Decrease in restricted cash 112
Current maturities of long-term debt 1,312 Proceeds from sale of property and equipment 50
Current maturities of capital leases 137 Other, net 23
Fuel derivative instruments 329 Net cash used in investing activities (1,719)
Other 811
Total current liabilities 13,488 12,508 Cash Flows from Financing Activities:
Long-term debt 9,910 10,121 Payments of long-term debt (1,528)
Long-term obligations under capital
leases
762 Dividend to UAL (709)
Proceeds from issuance of long-term debt 613
Other liabilities and deferred credits: Principal payments under capital leases (80)
Frequent flyer deferred revenue 2,796 Other, net (18)
Postretirement benefit liability 1,918 Net cash used in financing activities (1,722)
Pension liability 1,511 Net increase (decrease) in cash and cash equivalents 1,425
Advanced purchase of miles 1,070 Cash and cash equivalents at beginning of the period 1,996
Deferred income taxes Cash and cash equivalents at end of the period 3,421
Lease fair value adjustment, net 380
Other 1,479 Investing and Financing Activities Not Affecting Cash:
Total Other liabilities and deferred
credits
$ 9,154 Property and equipment acquired through the issuance of
debt
797
Commitments and contingencies Operating lease conversions to capital lease 285
Airport construction financing $ 5
Stockholder's equity: Transfer of UAL subsidiaries to United
Preferred stock $ 0 Conversion of convertible notes to UAL common stock
Common stock 4
Additional capital invested 7,941
Retained earnings (deficit) 2,634
Stock held in treasury, at cost (1,090)
Accumulated other comprehensive
income (loss)
(934)
Total stockholders' equity 8,555 2,635
Total liabilities and stockholders' equity
(deficit)
41,869
31. Current Ratio 0.75 Cash flow from assets -4496.00
Quick Ratio 0.70
Cash Ratio 0.25
Operating cash flow 8631.00
Net capital spending 10488.00
Total Debt Ratio 0.80 Change in NWC 979.00
Debt-Equity Ratio 3.89 Cash flow from assets -2836.00
Equity Multiplier 4.89 =Debt equity ratio+1
Long-Term Debt Ratio 0.54
Times Interest Earned Ratio -8.11 Cash flow to creditors 715.00
Cash Coverage Ratio -10.77
Cash flow to stockholders (5,211)
Inventory Turnover (no inventory)
Days' Sales in Inventory days
Recievables Turnover 19.05 times
Days' Sales in Recievables 19.16 days
Fixed Asset Turnover 1.05 times
Total Asset Turnover 0.69 times
Profit Margin 22.6%
Return on Assets 15.6%
Return on Equity 76.2%
ROE 76.18%
PE ratio $3.51 Price Per share as of 12/8/15 $60.52
PEG ratio $4.35 EPS as of 12/8/15 17.26
Price-Sales Ratio $0.60 Expected growth rate this year 80.64%
Price-Book Ratio 2.57 Sales Per Share 100.97
III. Cash Flow to Creditors
IV. Cash Flow to Stockholders
III. Asset Management, or Turnover Ratios
IV. Profitability Ratios
V. Market Value Ratios
II. Long Term Financial Leverage Ratios
I. Short Term Liquidity Ratios I. The cash flow identity
II. Cash Flow from Assets