1. Macro Technical Analysis: Monthly Candles
Paul Allegra January 2015
RE: Equities:
Monthly Charts Point to Extreme Overbought Conditions
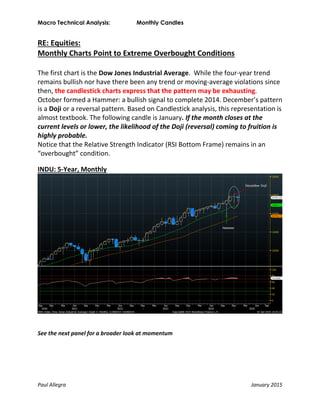
The first chart is the Dow Jones Industrial Average. While the four-year trend
remains bullish nor have there been any trend or moving-average violations since
then, the candlestick charts express that the pattern may be exhausting.
October formed a Hammer: a bullish signal to complete 2014. December’s pattern
is a Doji or a reversal pattern. Based on Candlestick analysis, this representation is
almost textbook. The following candle is January. If the month closes at the
current levels or lower, the likelihood of the Doji (reversal) coming to fruition is
highly probable.
Notice that the Relative Strength Indicator (RSI Bottom Frame) remains in an
“overbought” condition.
INDU: 5-Year, Monthly
See the next panel for a broader look at momentum
2. Macro Technical Analysis: Monthly Candles
Paul Allegra January 2015
The Nasdaq Composite shares similar qualities with regard to candlestick analysis
as the Dow Jones, however they are not quite as clear. Both indices remain in a
long-term bullish trend, but the momentum expressed in terms of Relative
Strength Indicators has the Nasdaq Composite decelerating from an extreme
overbought condition. This panel expands the lower frame to emphasize the
nature of the RSI.
The caveat: Extreme overbought conditions usually lead to a trend break and
sometimes a reversal.
CCMP: 5-Years, Monthly (RSI in Lower Frame)
The Russell 2000 has been the center of focus lately. Interesting to note: the
Russell hit an overbought momentum peak back in October. The momentum
3. Macro Technical Analysis: Monthly Candles
Paul Allegra January 2015
has been trending lower since then, but the price of the index has been trying to
move higher. Without momentum behind it, the rally will probably exhaust and
lead to a correction.
Also note: the price action of 2014 has developed a broadening formation.
RTY: 5-Years, Monthly RSI
A fine example of ignoring momentum at great risk:
In September of 2011, Gold peaked at 1921, eclipsing August’s gain by
approximately 10-points. The Momentum peaked in a severe-overbought range
4. Macro Technical Analysis: Monthly Candles
Paul Allegra January 2015
in August and abruptly shifted with September’s sell-off. 13-months later, it
appeared that gold was heading for another break-out. The momentum was still
lagging the price, and the rally deflated without the support of momentum
behind it. Gold remains in a protracted Bear Market, although we now see a
glimpse of momentum starting to turn. Ignoring the overbought condition cost
the buyer at the top to lose over 40% in three years.
GOLDS: 5-Years, Monthly (RSI) (Yellow Line represents Dow Jones)
From Extreme Overbought to Extreme Oversold:
5. Macro Technical Analysis: Monthly Candles
Paul Allegra January 2015
Oil has been under severe selling pressure since October. The momentum of that
selloff appears to be reaching an extreme phase. In June of 2008 the RSI peaked,
but the price of Oil topped out in July of 2008. Similar to the Gold example, after
the RSI peaked, Oil crashed with the global equity markets. It is interesting to note
that when Oil finally bottomed-out in December (08), January and February (09)
the RSI was not oversold. This recent sell-off registers a more severe impression
than the 2008 collapse. The Dow Jones is represented by the yellow line. The
duration of the RSI to remain oversold should be noted. Merely registering one-
month in the oversold range does not indicate that the price cannot go lower. The
RSI could recover with the price declining albeit at a slower pace.
CL1 10-Years, Monthly (RSI)