1. NFTRH 326 1
Notes From the Rabbit Hole
Alice and the characters of Wonderland, illustration by Jessie Wilcox Smith
NFTRH 326
http://www.nftrh.com
http://www.biiwii.com
January 18, 2015
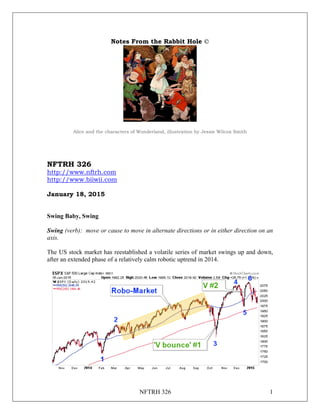
Swing Baby, Swing
Swing (verb): move or cause to move in alternate directions or in either direction on an
axis.
The US stock market has reestablished a volatile series of market swings up and down,
after an extended phase of a relatively calm robotic uptrend in 2014.
2. NFTRH 326 2
As noted on Friday in pre-market, a bounce was very possible as many indexes were at
support limit points. VIX was elevated and sentiment had lurched downward from over
bullish (graphics from Sentimentrader.com) to neutral:
So what happened last week was an elimination of the last vestiges of holiday cheer from
the Santa rally. However, with stock indexes right at critical support, it is notable that the
sentiment did not become over bearish. That works well with the view that Friday’s rally
may have started a bounce, but is not investment-worthy. Here is the daily chart of the
XLF Financials SPDR that was used in an NFTRH+ update last week to gauge a shorting
opportunity on a bounce to 23.75 to 24.25. Well, bounce in progress…
3. NFTRH 326 3
A few subscribers in essence have asked for an ‘all-clear’ to short US stock markets and
the advice about Friday’s bounce potential was more about a warning against shorting
weak markets at critical support than it was about going long the market. I have chosen
to trade swings because that is what I do. But the word “nimble” comes heavily into play
here. I do not like the stock market at all, generally speaking.
As for the chart above, it was one of the few actual breakdowns I could find and so far it
is working well. That looks like a classic shorting opportunity developing. If XLF fails
(holds below the SMA 50), it is likely that other bouncing ETFs/Indexes will fail as well.
Bottom Line
US stock market has entered a volatile phase of emotional ups and downs. Non-traders
should value cash. Those who think they can be nimble can play the jagged spikes. This
all seems a prelude to deeper correction potential. If the Financials (and the Banks for
that matter) do not fix themselves technically, they could indicate bearish coming events
for the stock market. Note to bears: Even the XLF is still on an intermediate uptrend
from 2011, bearish daily chart or not.
US Stock Market – Weekly Views
Returning to a few of the usual weekly charts, Biotech is still a-okay. It is a momentum
leader and it made new highs last week. With some initial damage in other areas, we are
looking at a bifurcated market; the bullish and the bearish. That may also be a sign of an
impending top in 2015.
4. NFTRH 326 4
For example, the Internets continue to look bad by the weekly view.
Semiconductors meanwhile are still okay above support.
5. NFTRH 326 5
Russell 2000 is still grappling with important support.
SOX leadership is still intact and Russell is still in bounce mode vs. the SPX…
6. NFTRH 326 6
The Bank Index is at critical support, as in ‘bull/ cyclical bear market decision point’.
As shown in an update on Friday, the BKX-SPX ratio is at a limit point (bottom of its
downtrend channel). This ratio usually resolves into bearish activity for the S&P 500
when it declines, but thus far the Teflon Don (SPX) has let it, among many other
indicators, roll right off its back.
7. NFTRH 326 7
What is important about the above chart is that if BKX-SPX breaks down from its modest
downtrend channel, a gently bearish indicator could become impulsively bearish. But
again, a bounce in BKX-SPX at the channel bottom could go with another stock market
bounce, as we noted on Friday morning.
Meanwhile, here are the still-intact Dow and NDX…
8. NFTRH 326 8
Market Indicators
The VIX came to a point that has limited previous bearish expressions.
LIBOR got a little peppy, but moderated and TED continues to sleepwalk along in the
gentlest of up trends.
9. NFTRH 326 9
Over in junk bond land is where we find the ongoing problems. One point to consider is
the degree to which the debt of distressed energy related companies is influencing this
picture. See the graph on page 10.
The implication thus far is that failing energy companies have not yet affected the US
economy or spread any kind of contagion-like disease into this credit market and
financial markets.
The graph below includes data to the end of November, but at that point non-energy
related high yield debt was starting to hook down as well. It is certainly not a bullish
picture at all in junk bonds, but perhaps the lack of a more pervasive distress (as with the
rhyming BKX-SPX ratio on page 6, only gently declining thus far) has allowed the stock
market to continue aloft indefinitely.
10. NFTRH 326 10
TIP-TLT meanwhile, continues to indicate a Treasury market devoid of inflationary
concerns.
Indeed, the 10yr-2yr yield spread dropped on Friday, right on cue with the market’s relief
bounce (gold bugs take note; was that a first shot across the bow or just a small setback?).
11. NFTRH 326 11
An update on what could be a developing bearish big picture scenario if the Gold-
Commodities ratio continues to have the relevance it has had in the past to the S&P 500.
12. NFTRH 326 12
Here is a better view of Gold-CCI. The weekly moving average trigger is firmer-still and
the indication is global economic contraction… unbroken on the big picture post-2008.
PALL-Gold ratio is another one we have watched since it crossed up around the time of
the Semiconductor equipment ramp up cycle (not related to the Semi’s in any way I am
aware of, but it is a fellow cyclical indicator) in early 2013. Last week it took its second
hard lunge down in the past ½ year. Consider this one also now front and center. We
have seen this movie before (hard lunge down, reversal, no moving average cross) so
let’s let it play out. But boy does it look bearish.
Indicators Bottom Line
It is a degrading global macro picture. It is also very complex with global policy makers
playing Whack-a-Mole and market perceptions hanging in the balance. For now,
confidence seems to be intact, but the picture is degrading.
13. NFTRH 326 13
Global Stock Markets
Europe held support nicely as the Euro was the winner of the Currency Devaluation
Sweepstakes last week. Why DAX is even at all time highs.
Back in Q4 2014 we noted that Germany could be a good destination for a Euro QE play.
At that point Draghi was merely jawboning QE but the point of the matter was and still is
the bearish Euro and its potentially positive effect on European exporters.
Naturally, we looked to Germany for its industrial exports. In particular we came up with
Siemens (SIEGY), a large and diversified multi-national exporter based in Munich.
Unfortunately, the weekly chart continues to be in an intermediate downtrend but does
have a couple things going for it. First, a notable support level was touched a few months
ago and second, MACD is triggered up. It’s not much but SIEGY could be a play if the
DAX’ breakout to new highs is indicative of relative strength in early 2015.
14. NFTRH 326 14
Meanwhile, the World has lost an important support level.
Emerging Markets (below) continue to try to bounce. A USD correction would be
helpful here. EM’s have gone nowhere for years now.
15. NFTRH 326 15
Canada’s real stock market continues to grapple with support while its unreal stock
market continues to try to find a bottom.
16. NFTRH 326 16
China 25 continues to look very interesting.
Nikkei and Yen. Mirror mirror on the wall…
Bottom Line
In the absence of an all out global financial market liquidation (a credible outcome given
the dynamics or stimulants in play), it appears that some global markets could be trade-
worthy in 2015 if one is willing to play the global QE Whack-a-Mole game. Examples…
Germany, a Euro-based exporter. Japan, a heavy exporter with a debased currency and
China, simply because of its relatively bullish markets, technically (SSEC in an uptrend
since the summer and FXT above trying to break long-term resistance).
But within this, one would need to be picky. Just look at MSWORLD and the TSX,
which is quite a way above strong support if it loses current support. So above I am just
interpreting some technicals. I do not generally care for stocks right now, global or US.
17. NFTRH 326 17
Commodities
Commodities remain bearish. If or when the USD corrects and commodities look to
bounce, fine, we can take a look. But taken as a basket, this is still a bearish mess.
I took a try on Crude Oil, but that is as much to hedge winter heating costs as to read a
bottom of some kind into this chart. If this is a bear flag, USO will be dumped.
18. NFTRH 326 18
Above is the bigger picture view of WTIC at its long-term trend line. We sometimes
note the rolling speculations in commodities that appear to be the result of hedge fund hot
money and black boxes set to push all trends to extremes. We have seen some massive
upside blow offs like Uranium in 2007, crude oil in 2008 and silver in 2011.
Everybody hates oil to the opposite degree they loved it in 2008. The news is now all
about rationalizing the decline, whereas 7 years ago it was all about rationalizing the rise.
The media should be tuned out because it tells stories that seem to make sense along the
way as it follows the trends. That’s media’s job; its job is not to get the markets right.
What seems to be happening now is rolling commodity speculations going the other way
as copper looks set to take the momentum from oil. As long as copper resides below the
red line, there is nothing but hot air between the good Doctor and the 2008 lows.
Commodities Bottom Line
I continue not to like them when viewed as a basket. The individual bounces can be
furious, but this is a sector in extreme dislocation.
19. NFTRH 326 19
Precious Metals
Let’s start with the ‘let’s keep our eyes open’ stuff. The first one actually appeared on
page 11 as the 10yr-2yr yield spread dropped hard on Friday. Taken in a vacuum, that is
gold unfriendly. But also, it is just one day so let’s watch it going forward.
The metals and miners are approaching resistance areas and the Commitments of Traders
data are as they tend to do during rallies, heading in a bearish direction or more
accurately, a direction toward points that often accompany negative market reactions.
20. NFTRH 326 20
For perspective on the bigger picture, here are the long-term Commercial Hedger
positions on gold and silver, respectively. The channels are bullishly aligned on the
longer-term picture, meaning that over time the Commercials are reducing their net short
positions. However, the data are approaching the channel bottoms, where negative
reactions have taken place in the past.
21. NFTRH 326 21
Gold daily broke resistance on Friday. 1260 now needs to be turned to support. The
weekly close above is notable.
The weekly chart did a lot of good last week. We had noted the up-trigger by MACD
and that turned out to be a prelude to a break above the weekly moving averages. As
noted in an update, I would now like to see 1230 hold as support. Let’s widen that to a
range of 1220-1240.
Even the ugliest chart (below) has made reparations.
22. NFTRH 326 22
Daily silver popped right up to resistance in the high 17’s we noted last week.
23. NFTRH 326 23
Silver’s first major resistance is in the high 18’s, and it is very major.
Here’s is the other weekly perspective view.
24. NFTRH 326 24
Daily HUI channel busted up and eliminated the 150’s from the discussion. That does
not mean it can not go there; it does mean however, that it probably won’t because there
is no longer a channel saying it can.
HUI-Gold ratio remains constructive.
25. NFTRH 326 25
GDXJ vs. GDX is sagging but in a short-term uptrend channel.
Weekly HUI puts perspective on the rally. There remains a lot of overhead congestion,
but the first resistance was cleared last week. That is very tentative support now. Call it
190 or so (channel top, ref. daily chart page 24). Also note the red dotted downtrend
channel top. HUI could be making a bounce to that line. Keep in mind that downtrend
channel has limited each of our Comp’s 1, 2 & 3 in the bear market.
26. NFTRH 326 26
Big picture, considering that the macro backdrop appears to be shifting favorably for this
counter-cyclical sector, here once again is the ‘risk vs. reward’ view of HUI vs. SPX.
The daily view of gold breaking upward vs. SPX helps the miners’ risk vs. reward stance.
27. NFTRH 326 27
Who needs gold? The Swiss voted it down and then freed their currency from the Euro.
One interpretation is that Switzerland has chosen a resumed deflationary phase over
being part of a failing inflation. They have chosen natural market liquidation over the
will and power of man to control markets. Gold in Francs dropped hard.
Who needs gold? Europe.
29. NFTRH 326 29
Australia?…
Interlude
Americans may not perceive a need for gold because the currency is so strong and the
economy so decent. American stock markets are near all-time highs, the currency buys
foreign goods on the cheap and its Treasury bonds are thought to be the safest on earth.
That is the fortress America has built or the moat it has surrounding it. Choose your
metaphor. On Friday consumer sentiment jumped to 98.2 from 93.6 vs. an expected 95.
It is as good as it gets in America, as we have been noting. Certain traditional indicators
are slipping a little. I suppose people can find reason to fret about hourly wages not
increasing or the small leveling in the manufacturing sector (December ISM). This
earnings season we will see how corporate America sees the near-term future.
As for the non-traditional indicators, those have been aligning against the cyclical view
for some time now. That means they have slowly been aligning for the counter-cyclical
gold stock sector. Foremost among them is the Gold-CCI ratio. We will look to the next
two upcoming Semiconductor Book-to-Bill ratios (December’s data is due shortly) and
watch the PALL-Gold ratio, which seemed to be hyper sensitive to the economic growth
phase that started Q4 2012/Q1 2013.
In general, if things continue to lurch toward the counter-cycle, compliments in no small
part to unrelenting strength in USD, we will continue to firm up bullish on the gold stock
sector; well, quality gold stocks anyway.
30. NFTRH 326 30
Updating some of the individual gold stock (plus silver miner First Majestic) charts that I
either hold or have an interest in. Again, pardon the clumsy format. In order to best
display the charts they need to be presented separately from the summaries below.
o KDX.TO (KLNDF) is becoming very over bought. A weekly view shows that it
has made new recovery highs after bottoming in early 2013. This kind of relative
strength is indicative of a quality situation. In this sector, you want to look for
relative strength because the laggards are often lagging for a reason.
o KGI.TO (KGILF) is another relative strength performer after bottoming in late
2013. By relative strength in this case we mean it did not make new lows in late
2014 with the rest of the gold sector. A modest series of higher highs and higher
lows has been in place for over a year. Solid support has been formed at 4, but
3.50 is possible if the sector gets a shake up or KGI gets negative news.
o RIOM (RIO.TO) continues to be self-explanatory.
o AR.TO (ARNGF) as well.
o MDW (MDW.TO) is one of those laggards we talked about and wouldn’t you
know they came out with a mitigating project update. It contained the phrases
“mechanical malfunction” and “our production will be constrained”… ah
mining, you’ve got to love it. I am viewing the 50 day moving average, currently
at .72 as important support.
o AAU (AMM.TO) either got pumped by somebody or it benefited from the
seasonal situation we had noted. Regardless, I sold the pump and bought it back
at 1.04 on the inevitable fallout on Friday. I perceived 1.03 to be support. There
is more at a buck.
o LSG (LSG.TO) is another pretty self-explanatory chart. I have it on watch to see
if it can be had near .70. Otherwise, there is more support at .77 or so. LSG is
another of those relative strength items that made its bottom back in 2013. Recall
we used to review several of these curious items that had not gotten the ‘gold
stocks going to crash’ memo.
o AG (FR.TO) is a quality silver stock to watch, assuming silver has legs to it. I
am more gold bull than silver bull, but added a little exposure via SLW last week
and would like to add AG as well. But again, I am not bullish on silver beyond a
continued bounce and certainly not above 25/oz or so. That is because silver is
part commodity and is more inflation sensitive than gold. Despite bounce
potential I don’t think the ‘inflation trade’ is going whip up any time soon in any
‘new bull market’ sort of way. AG does look good above 5.50 though. Supports
1, 2 & 3 are noted, with #3 not looking very likely.
35. NFTRH 326 35
Precious Metals Bottom Line
The macro appears to be shifting in favor of the gold mining sector, which could leverage
a gold rise in relation to other asset prices into bottom line fundamental improvements
across the sector.
Within this, silver can lead the initial rally but over the long-term I like gold and gold
stocks better. Even there, please do not get caught up in hype that sees gold going to
2000, 3000… $5000 an ounce. We are mainly looking at a relative performance by gold
vs. cyclical assets in a distressed global financial environment.
Gold mining can however, eventually get dynamic because miners would leverage the
gold out performance, rather than just play 1 for 1 to gold.
Short-term, the CoT data are indicating a coming negative reaction. It is up to
individuals to decide how to play it because there is a whole stew of inflammatory global
policy stuff going on now, including for the coming week. As with the broad markets, it
could get volatile.
If you make a trade you have to own it. Trade out of the sector due to profit taking and
concern about short-term risks and be ready to deal with it if the sector does not come
back to let you in. Stay in and a hard reaction comes about, be ready for the negative ‘if
only I’d have…’ stuff to crop up.
It is all psychology. The bottom line is that the macro backdrop is becoming more
positive for the counter-cyclical gold sector and that is something that – given the
unbroken NFTRH view of global economic contraction (ref. Gold-CCI ratio as the
primary indicator) – I have awaited for a long while. So I myself am going to consider
what I’ve written above about trading psychology before making reactionary decisions
(though as discussed many times in previous editions, profit taking is always a positive
thing; it is the #1 job of a speculator, either sooner or later).
NFTRH+, etc. Notes
Another report has gone into overtime and that is fine because while I bought the fear
with a few ‘bounce’ items last week, I am not bullish on the stock market. Two
NFTRH+ updates were done last week; one bullish on the GDX gold stock ETF and the
other bearish on the XLF Financials ETF. We’ll stick with that for now.
A reminder that chart based NFTRH+ updates are just trade setup ideas, which may not be revisited as the
parameters are already noted. They are meant as a starting point for further research if interested.
Fundamentals-based ideas are also provided for your further research only. I will not personally buy
every item highlighted and will sometimes sell – without prior notice (because this takes time and resource
away from NFTRH’s main functions) – any item that I do buy below target, which is something I often do
as a trader. Further, I am not a fundamental stock analyst so… caveat emptor.
36. NFTRH 326 36
Currency
USD is bullish and impulsive and Euro is very bearish. One can correct and the other
bounce (buy coming ECB news??). Bigger picture is bullish and bearish, respectively.
Commodity currencies are failing (CDW) and holding (XAD) support, respectively.
37. NFTRH 326 37
Wrap Up
The stock market bounced on Friday from critical support, as we suspected it
might. Bullish bounce players should be nimble.
We are using the Financials (XLF) as a bearish scout because it was one of the
few items that actually broke down below the December lows. If the breakdown
holds (we allow for a bounce to the SMA 50 under a bear case) it would have
bearish implications on the broad market.
But the market still has its momentum leaders (Biotechs and Semiconductors)
intact, so let’s not bury the bull just yet.
A phase of up and down volatility could continue indefinitely, but it is also like
playing Russian Roulette because one of these days it is either going to resolve in
an upside explosion or more likely, a painful downside failure.
In other words, the ‘swings’ are a sign of coming changes and given the robo
trends of the last 2 years, the bear should be given the edge.
Commodities remain due for a bounce. But what to make of Copper, which we
have noted to be bearish for years now but is only now making bearish headlines?
The target is a buck 50.
Commodities seem to be in ‘rolling speculations’ mode, only this time to the
downside.
Gold-Commodities ratios indicate a counter-cyclical environment. Recently, gold
vs. the US stock market has made good progress. While there will be volatility
along the way, considering the monthly ‘risk vs. reward’ chart of HUI-SPX on
page 26, as an intermediate uptrend becomes established a ‘buy the pullbacks’
regimen could work well now, unlike over the last few years.
There will be hype in the air. When the most cartoonish gold sector stuff starts
trumpeting it may be time to pull back and be careful. While some of the pom
pom brigade appear to be getting optimistic again, I have not noted the really
obnoxious stuff. But then again I have not really gone out looking for it.
In the meantime, while the gold sector can and will take some pretty violent hits,
the macro fundamental backdrop is improving. That is much different from so
many bear market rallies to date that came against a strong US economy and stock
market and little more than hype by promoters about how Russia’s invasion of
Ukraine was bullish for gold or similar stuff to be disregarded.
Trade as you will, but for the time being the analysis is in ‘buy the pullbacks’
mode for gold stocks. I may trade it, but slow accumulation should also work.
38. NFTRH 326 38
Trading Notes
This segment will be abbreviated simply to ‘trading notes’ during the volatile period of
potential market changes as indicated in the analysis above, as I personally plan to trade
the markets with extreme decisiveness. Normal portfolios may return* when new trends
are established that can be managed longer-term. The Speculation Portfolio (Roth IRA)
was +152% from the 9.28.08 baseline at the time tracking was suspended (4.6.14).
* This creates extra work in the form of tables and formatting and with reports that average over 30 pages,
their value to the overall service is being evaluated.
As long as a bull market is viable we’ll list some precious metals relative ‘quality’ equities defined for our
purposes, but certainly not limited to (list is altered as new information/opinion becomes available):
• Royalty: RGLD, FNV, SLW, OR.TO (OKSKF) (relative valuations an issue now)
• Established Miners: GG, GOLD, AEM, AG, AUY, EGO
• Smaller/Younger Miners: RIOM, BTG, KGI.TO (KGILF), KDX.TO (KLNDF), AR.TO
(ARNGF), LSG
• Developers, risky: AKG, MDW, GQM.TO (GQMNF), RBY
• Exploration, risky: PG.TO (PIRGF), AAU, PLG.TO
• Highest quality of all: Physical Gold
Brokerage: Cash and equiv. (FDLXX) = 81%. Holdings are AAPL (initiated),
GQM.TO (initiated), INTC (initiated), KRE (initiated), MSFT (initiated) PG.TO,
PLG.TO, SLW (initiated), TLT.V, USO (initiated) and WG.TO.
Most ‘initiated’ items represent an effort to play a bounce ‘swing’. These are day-to-day.
SLW and USO may be held longer, depending on what I see in the coming days/weeks.
The SHY ‘cash equiv.’ was dumped because I think T bonds are going to correct and this
cash equiv. provided a pretty good profit (it was a very large proportional holding). The
cash will likely go back into SHY upon correction or FDLXX or SHV (T bill funds w/ no
return). They are considered safer cash than straight money market funds.
Roth IRA: Cash = 82%. Holdings are AAU (initiated), AKG, KGILF, KLNDF, MDW,
OMED (intiated), RIOM and SIMO (initiated).
Trading: TTNP, a rank penny stock chart spec.
NFTRH is not to be distributed to third parties without prior written consent
Notes From the Rabbit Hole (NFTRH) is a weekly newsletter in which we provide analysis on financial
markets. We make every effort to provide accurate and high quality content, but this analysis ultimately
represents our opinions and these opinions are provided without warranty or guarantee of any kind. In no
event will Biiwii.com or its owner, Gary Tanashian, be liable for any decision made or action taken by you
based upon the information and/or opinion provided in NFTRH.
NFTRH.com/Biiwii.com ToS available for review here: http://nftrh.com/about-tos/terms-of-service/