SlideShare a Scribd company logo
1 of 3
Download to read offline
WESTERN AND CENTRAL AFRICA POWER MARKET DASHBOARD - 2015
Rank Country Production Transmission Distribution Consumption and Quality of Service Brief overview
1 Nigeria
Installed Capacity: 12,010 MW
Net production: 30,922 GWh
Fuel: Natural gas, hydro
Utilities: 25 power plants operated by PHCN
successors, IPP and NIPP
Peak load: 4,884 MW (23/11/2015)
Network length: 15,841 km
Lines type: 330/132 kV
Losses: 7.5 %
Number of networks: 1
Operator: TCN (State owned)
6 total and 4 partial collapses of the grid
Lines length: 356,363 km (2014)
MV: 33/11 kV
Losses: 18.5 %
Operators: 11 distribution companies
Consumption: 21,589 GWh (e)
Number of subscribers: 8,645,527 (2014)
Consumption per capita: 115 kWh
Average end-user price: 125.31 USD/MWh
Electricity access rate: 45.0 % (2014)
Regulatory agency: NERC (established in 2005)
In May 2015, process of unbundling TCN into NESO (public entity) and
TSPN (private entity) began
NERC estimates in July 2015, about 53.66 % of the customers are
either unmetered or have non-functional meters
Collection rate (62.5 %) is low compared to other WAF countries
Exports power to Togo, Benin and Niger
Gas cost: 2.6 USD/MMBTU
2 Ghana
Installed Capacity: 3.656 MW
Net production: 11,492 GWh
Fuel: Hydro, natural gas, light crude oil (LCO),
solar
Utilities: VRA, BPA (State owned) TICO, CEL,
SAPP, Ameri (IPP) and Karpower (leasing)
Peak load: 1,933 MW (29/12/2015)
Network length: 5,216 km
Lines type: 330/225/161/69 kV
Losses: 3.8 %
Number of networks: 1
Operator : GRIDCO (State Owned)
Lines length: 91,382 km
MV: 34,5/33/30/20/11 kV
Losses: 23.3 %
Operators: ECG, NEDCO (State Owned)
and EPC (Private owned)
Consumption: 8,646 GWh
Number of subscribers: 3,484,396 (e) (2014)
Consumption per capita: 315 kWh
Average end-user price: 143.45 USD/MWh
ECG SAIDI: 138 - 283 hrs per customer (2014)
ECG SAIFI: 78 - 165 per customer (2014)
Electricity access rate: 78.3 % (2014)
Regulatory agencies: PURC, EC (established in 1997)
Production fell in 2015 due to water shortages
To boost natural gas imports, Ghana leased a Golar FSRU that will be
commissioned in 2017
Two tariff increases recorded in 2015
New capacity: KTPP, Ameri, Karpower, BXC Solar
Gas cost: 8.8 USD/MMBTU|LCO cost: 60.0 USD/bbl
3
Democratic
Republic of
Congo
Installed Capacity: 2.446 MW
Net production: 8,913 GWh
Capacity factor: 37.9 %
Fuel: Hydro, Diesel
Utilities: SNEL (State owned), SINELAC
(Operator of the Ruzizi II hydrodam)
Network length: 6,215 km
Line types: 500(DC)/220/132/120/ 110/70/
66/50 kV
Operator: SNEL
Number of substations: 3,607 (2013)
Lines length: 17,771 km
MV: 30/20 kV
Losses: 10.5 % (2014)
Operator: SNEL
Electricity sales: 7,559 GWh
Billed Subscribers: 622,210
Consumption per capita: 98 kWh
Average price: 87.26 USD/MWh
Electricity access rate: 17,9 % (2014)
New law governing electricity sector was approved in 2014
SNEL revenue collection rate is low (61.2 %) compared to many
Western Africa utilities (more than 90 %)
Exported 37.4 GWh to neighbouring countries
Only 13% of residential subscribers have a metering system. The
remaining are billed on a flat rate basis
4 Ivory Coast
Installed Capacity: 1,811 MW
Net production: 8,517 GWh
Fuel: Natural gas, Hydro, fuel-oil, diesel
Utilities: CIE (15 % State owned), CIPREL,
AZITO (IPP) and AGGREKO (leased capacity)
Peak load: 1,193 MW (09/12/2015)
Network length: 4,733 km
Lines type: 225/90 kV
Losses: 6.5 %
Number of networks: 1
Operator : CIE
Lines length: 41,936 km
MV: 30/11 kV
LV: 380/220 V
Losses: 16.7 %
Operator: CIE
Electricity sales: 5,935 GWh
Number of subscribers: 1,432,779
Consumption per capita: 261 kWh
Average end-user price: 114.86 USD/MWh
SAIDI: 30 hrs per customer
SAIFI: 33 per customer
Electricity access rate: 77 %
Regulatory agency: ANARE (established in 1998)
CIE Concession Agreement expires in 2025
Tariff increased by 10 % in July 2015
CIPREL added a 111 MW Heat Recovery Steam Generator
Exported 849 GWh to Togo, Benin, Burkina, Mali and Ghana
Gas cost: 5.6 USD/MMBTU|Fuel-oil cost: 708.3 USD/MT
5 Cameroon
Installed Capacity: 1.299 MW
Net production: 6,344 GWh
Fuel: Hydro, Natural gas, fuel-oil, diesel
Utilities: ENEO (44 % State owned), KPDC,
DPDC (IPP), ALTAAQA (leased capcity)
Peak load: 764 MW
Network length: 2,232 km
Lines type: 225/110/90 kV
Losses: 5.8 %
Number of networks: 3
Operator: ENEO
Lines length: 35,155 km
MV: 30/15 kV
Losses: 30.5 %
Operator: ENEO
Electricity sales: 4,606 GWh
Number of subscribers: 1,020,362
Consumption per capita: 197 kWh
Average end-user price: 101.27 USD/MWh
Electricity access rate: 62.1 % (2014)
SAIDI: 89 hrs per customer
SAIFI: 684 per customer
Regulatory agency: ARSEL (established in 1998)
No price review since 2012
A Transmission utility was established in 2015
Self-generation was estimated at 1,637 GWh in 2014
Lom Pangar impounding dam started operations in 1Q2016
Gas cost: 3,49 USD/MMBTU
6 Senegal
Installed Capacity: 712 MW
Net production: 3,429 GWh
Fuel: Fuel-oil, hydro, diesel, natural gas
Utilities: SENELEC (State owned) KONOUNE
(IPP), AGGREKO, APR Energy (Leased
capacity), SEMAF
Peak load: 533 MW
Network length: 529 km
Lines type: 225/90 kV
Losses: 1.2 %
Number of networks: 3
Operator: SEMAF, SENELEC
Number of substations: 4,819
Lines length: 17,479 km
MV: 30/6.6 kV
Losses: 17.3 %
Operator: SENELEC
Electricity sales: 2,719 GWh
Number of Subscribers: 1,050,228 (2014)
Consumption per capita: 180 kWh
Average end-user price: 197.93 USD/MWh
Electricity access rate: 60,6 % (2014)
END: 21 GWh
Regulatory agency: CRSE
Senegal has 60 and 15 MW of dedicated capacity in Manantali and
Felou hydro dams (Mali)
CountourGlobal bought the assets of GTI Dakar and is expected to
commission a 55 MW HFO plant in 2016
Senegal imports from Mauritania started in 2015 and will ramp-up with
the commissioning of the Banda gas project
7 Gabon
Installed Capacity: 670 MW
Net production: 2,244 GWh
Fuel: Natural gas, hydro, diesel, Fuel-oil
Utilities: SEEG (51% owned by Veolia), Societe
de Patrimoine (State-owned), Aggreko (leasing)
Peak load: 369 MW
Network length: 706 km
Line types: 225/90/63 kV
Number of networks: 3
Operator: SEEG
Number of substations: 2,623
Lines length: 4,065 km
MV: 30/20/5.5 kV
Losses: 21.6 %
Operator: SEEG
Electricity sales: 1,704 GWh
Number of Subscribers: 294,559
Consumption per capita: 1,043 kWh
Average price: 160.11 USD/MWh
Electricity access rate: 89.3% (2014)
Regulatory agency: ARSEE (established in 2010)
Quaterly review of the tariffs
SEEG the historical power company was privatized in 1997
Societe de Patrimoine du Service Public operates the Alenakiri power
plant and Grand Poubara dam
In 2014, Gabon established a transmission company that was dissolved
the same year
by Patrick BABOGA, Msc. Eng .
8 Mali
Installed Capacity: 488,2 MW
Net production: 1,469 GWh
Imports: 244 GWh
Fuel: Fuel-oil, hydro, diesel
Utilities: EDM (66 % State owned), SEMAF,
SOPAM (IPP), AGGREKO, APR ENERGY (leased
capacities)
Peak load: 274 MW
Network length: 1,365 km
Line types: 225/150/66 kV
Number of network: 1
Operator: EDM
Installed Capacity: 641 MVA
Number of substations: 2,714
Lines length: 6,895 km
MV: 30/15 kV
Losses: 17.8 %
Operator: EDM
Consumption: 1,327 GWh
Number of Subscribers: 400,690
Consumption per capita: 75 kWh
Average price: 177.36 USD/MWh
Electricity access rate: 25.9 % (2014)
Regulatory agency: CREE (established in 2000)
SEMAF replaced EEM (ESKOM subsidiary) as operator of Manantali and
Felou hydro dams
Mali holds 104 and 27 MW of dedicated capacities in these dams, the
remaining being allocated to Senegal and Mauritania
Imports electricity from Ivory Coast and Mauritania
9 Burkina
Installed Capacity: 325 MW
Net production: 999 GWh
Imports: 443 GWh
Fuel: Hydro, diesel, fuel-oil
Utility: SONABEL (State-owned)
Peak load: 244 MW (07/05/2015)
Network length: 1,004 km
Line types: 225/132/90 kV
Losses: 4.1 %
Main networks: 1
Operator: SONABEL
Installed Capacity: 625 MVA (2014)
Number of substations: 3,218
Lines length: 13,367 km
MV: 33/20/15 kV
Losses: 13.2 %
Operator: SONABEL
Consumption: 1,200 GWh
Number of Subscribers: 544,825
Consumption per capita: 66 kWh
Average price: 181.84 USD/MWh
Electricity access rate: 18.8 %
Regulatory agency: ARSE (established in 2007)
No price review since 2006
APR Energy was operating power plants (30 + 31 MW) that was
dismantled in 2012.
Burkina imported 443 GWh
Fuel-oil cost: 483.0 USD/MT
Diesel cost: 827.9 USD/MT
10
Congo
Brazzaville
Installed Capacity: 592 MW
Net Production: 2,585 GWh (e)
Fuel: Hydro, natural gas, fuel-oil, gasoil
Imports: 37 GWh from DRC
Utilies: SNE (State owned), CEC (80 % State-
owned)
Network length: 1,469 km
Line types: 220/110 kV
Number of network: 1
losses: 10.1 % (2014)
Operator: SNE
MV: 35/30/20/6.6 kV
losses: 50.0 %
Operator: SNE
Electricity Sales: 1,160 GWh
Number of Subscribers: 256,903
Consumption per capita: 249 kWh
Average price: 97,31 USD/MWh
Electricity access rate: 41.8 % (2014)
Regulatory agency: ARSEL (established in 2003)
Congo and Cameroon signed a joint-development agreement for the
Chollet hydro dam (600 MW) on the Congo river
CEC operates two thermal plant of a total installed capacity of 350
MW near Pointe-Noire
Self-generation was estimated at 208 MWh in 2014
Exports small quantity of electricity to DRC
11 Togo
Local Installed Capacity: 146 MW
CEB Installed capacity: 105 MW
Net production: 361 GWh
CEET purchase from CEB: 745 GWh
Fuel: Fuel-oil, disel, Natural gas
Utilies: CEB, CEET (State owned),
ContourGlobal (IPP)
Peak load: 213 MW
Network length: 1,870 km (including HV lines
of Benin )
Line types: 330/161/63 kV
Number of network: 1
Losses: 5.2 %
Operator: CEB
Installed Capacity: 626 MW
Peak load: 172 MW
Number of substations: 1,707
Lines length: 7,209 km
MV: 34.5/33/20/5.5 kV
Losses: 16,8 %
Operator: CEET
CEET Sales: 910 GWh
Number of Subscribers: 294,639
Consumption per capita: 125 kWh
Average price: 182.56 USD/MWh
Electricity access rate: 33.0 %
Regulatory agency: ARSE (established in 2000)
CEB is a jointly incorporated company with the State of Benin that
imports electricity from Ghana, Ivory Coast and Nigeria
CEET operates under a performance agreement signed with the State
of Togo for 5 years (2014-2018)
ContourGlobal operates Lome Thermal Plant (100 MW)
Gas cost: 10.05 USD/MMBTU|Fuel-oil cost: 761.2 USD/MT
12 Benin
Installed Capacity: 114 MW
CEB installed capacity: 105 MW
SBEE Production: 134 GWh
SBEE purchase from CEB: 1,087 GWh
Fuel: Fuel-oil, natural gas
Utilities: CEB, SBEE (State owned)
Peak load: 241 MW
Network length: 1,870 km (including HV lines
of Togo)
Line types: 330/161/63 kV
Number of network: 1
Operator: CEB
Number of substations: 3,524
Lines length: 14,388 km
MV: 30/20/15/6.6 kV
losses: 23.9 %
Operator: SBEE
SBEE Sales: 844 GWh
CEB sales to industries: 59.1 GWh
Number of Subscribers: 484,486 (2013)
Consumption per capita: 78 kWh
Tariffs: 131.95 - 194.54 USD/MWh
Electricity access rate: 31.0 %
Regulatory agency: ARSE (established in 2000)
CEB sells electricity directly to the local cement plant
Adjarala hydro dam (147 MW) started construction in 2015
Gas imports have been erratic through the WAPCO, since the
commissioning of this pipeline in 2009
13 Niger
Installed Capacity: 151 MW
NIGELEC production: 156 GWh
SONICHAR production: 221 GWh
Fuel: Diesel, Coal
Imports: 782 GWh
Utilities: NIGELEC , SONICHAR, SNCA (State
owned), AGGREKO (leased engines)
Peak load: 353 MW (2014)
Network length: 706 km (2014)
Line types: 132/66 kV
Losses: 9.0 % (2014)
Operator: NIGELEC
Installed Capacity: 387 MVA (2014)
Number of substations: 2,105 (2014)
Lines length: 6,890 km (2014)
MV: 33/20 kV
Losses: 10.5 % (2014)
Operator: NIGELEC
Consumption: 769 GWh
Number of Subscribers: 253,745
Consumption per capita: 40.2 kWh
Average price: 138,26 USD/MWh
Electricity access rate: 14.6 % (2014)
Regulatory agency: ARSE (established in 2015)
SONICHAR operates a 37.6 MW coal thermal plant
No price review since 2012
Imported more than 78.2 % of its electricity needs from Nigeria
Kandadji Hydro dam (130 MW) is under construction
The Gorou Banda thermal plant (100 MW) was inaugurated in April
2017
14 Guinea
Installed Capacity: 603 GW
Net Production: 1,118 GWh
Fuel: Hydro, fuel-oil, gasoil
Utilities: EDG (State owned)
Peak load: 260 MW
Network length: 497 km
Line types: 225/110/60 kV
Number of networks: 2
Losses: 7.7 % (2013)
Operator: EDG
Installed Capacity: 428 MVA
Number of substations: 1,984
Lines length: 1,342 km
MV: 30/15/6 kV
Losses: 17 % (2013)
Operator: EDG
Electricity Sales: 758 GWh
Number of Subscribers: 277,558
Consumption per capita: 60.1 kWh
Average price: 93,25 USD/MWh
Electricity access rate: 26.4 % (2014)
Regulatory agency: ARSEE (established in 2003)
EDG and Veolia signed a management contract in 2015
Some consumers are billed on a flat rate basis
Kaleta hydro dam was completed in August 2015
Leasing of 50 MW to Aggreko was ended in June 2015
Self-generation had an installed capacity of 63.4 MW in 2014
15 Mauritania
Installed Capacity: 354 MW
Production: 908 GWh
Self-production (Mining sector): 489 GWh
Fuel: Fuel-oil, Diesel, Hydro, Wind, Solar
Utilities: SOMELEC (State owned), SNIM
Network length: 1,120 km (Connects Nouakchott
to the transmission system of Manantali and
Felou dams)
Line types: 225/90 kV
Operator: SEMAF
Number of substations: 801 (2013)
Lines length: 2,973 km (2013)
MV: 33/15 kV
losses: 27.2 %
Operator: SNIM (Zouerate and F'Derick
cities) and SOMELEC
Electricity Sales: 572 GWh
Number of subscribers: 220,000
Consumption per capita: 154 kWh
Tariff: 72.69 - 189.12 USD/MWh
Electricity access rate: 28.4 % (2013)
Regulatory agency: ARE (established in 2001)
Tullow farmed-down of the Banda license in 2014 due to falling oil
prices and Mauritania is looking for a new operator. 180 MW of this
project was commissioned with fuel-oil in 2015
Mauritania has dedicated capacities of 36 and 18 MW in Manantali and
Felou hydro dams (Mali)
Exported 104 GWh to Senegal
by Patrick BABOGA, Msc. Eng .
16
Equatorial
Guinea
Installed Capacity: 327 MW
Production: 692 GWh (e)
Fuel: Hydro, natural gas and oil
Utilies: SEGESA (State owned)
Peak Load (first 9 months 2015): 123 MW
Line types: 220/110/66 kV
Number of network: 2
Operator: SEGESA
MV: 20/15 kV
Operator: SEGESA
Electricity consumption: 568 GWh (e)
Consumption per capita: 463 kWh (e)
Tariff: 101.5 - 169.16 USD/MWh
Electricity access rate: 80.0 %
No Regulatory agency
The commissioning of the Sendje (200 MW) hydro dam is planned in
2017 and the excess production could be exported
In 2015, the government decided to convert 24 MW of the Bata
thermal plant from fuel-oil to natural gas
No tariff review since 2002
17 Gambia
Installed Capacity: 28 MW (2014)
Net Production: 293 GWh
Fuel: Fuel-oil, gasoil and Wind
Utilies: NAWEC (State owned), GAMWIND (IPP)
No existing transmission system. Electricity is
directly delivered to the distribution network
Lines length: 306 km
MV: 33/11 kV
losses: 24.0 % (2014)
Operator: NAWEC
Electricity Sales: 218 GWh (2014)
Number of Subscribers: 145,141 (2014)
Consumption per capita: 109.7 kWh
Average price: 227.59 USD/MWh (2014)
Electricity access rate: 44.5 % (2014)
Regulatory agency: PURA (established in 2001)
A 12 % Tariff increase occurred in 2015
Fuel-oil unavailability obliged NAWEC to mainly rely on dieselon
GEG handed over Brikama power plant to NAWEC in 2013
Gambia is expected to have 17 and 25 MW of dedicated capacity in
Kaleta and Sambanglou dams under OMVG
18 Chad
Installed Capacity: 192 MW
Production: 216 GWh (2014)
Fuel: fuel-oil, diesel
Utilies: SNE (State owned), Aggreko (leased
Capacity)
Line types: 90/66 kV
Number of network: 1 (Concentrated in
N'Djamena area)
Operator: SNE
MV: 15 kV
Operator: SNE
Number of Subscribers: 51,000
Tariff: 143.79 - 211.45 USD/MWh
Electricity access rate: 3.8 % (2014)
The historical utility STEE was dissolved in 2010 and SNE is now the
public utility in charge of the electricity sector
Electricity network is concentrated around N'djamena
Electricity tariff were reduced by 37 % in 2015
60 MW of Solar PV is planned to be commissioned in 2018
19 Sierra Leone
Installed Capacity: 100 MW
Net Production: 294 GWh (2016)
Fuel: Hydro, diesel, fuel-oil
Utilies: EGTC (State owned), BKPS
Line types: 161/66 kV
Number of network: 1
losses: 3.5 % (2013)
Operator: EGTC
MV: 33/11 kV
losses: 54.1 % (2013)
Operator: EDSA
Electricity Sales: 114.6 GWh (2014)
Number of Subscribers: 44,915 (2013)
Consumption per capita: 20.4 kWh (2014)
Tariff: 131.64 - 425.24 USD/MWh
Electricity access rate: 5.0 % (2013)
Regulatory agency: SLEWRC (established 2011)
NPA was unbundled into EGTC and EDSA in 2015
Phase II of the Bumbuna hydro plant (350 MW) is expected to reach
financial closing in 2017
Tariffs were increased by 15 % in September 2016
20
Central African
Republic
Installed Capacity: 36 MW (2014)
Net Production: 139 GWh (2014)
Imports: 0.2 GWh
Fuel: Hydro, diesel
Utilies: ENERCA (State owned)
Network length: 172 km (2012)
Line types: 110/63 kV
Number of network: 1
Utilies: ENERCA
Number of substations: 213 (2012)
Lines length: 585 km (2012)
MV:15/6.6/5.5 kV
Utilies: ENERCA
Electricity Sales: 38 GWh (2014)
Number of LV Subscribers: 30,003 (e) (2014)
Consumption per capita: 7.6 kWh (2014)
Electricity access rate: 2.5 % (2014)
Regulatory agency: ARSEC (established in 2005)
The Mobaye area is supplied directly from DRC
Boali 1 and 2 dams (18.4 MW) are the main generating facilities
LV consumption was reduced by from 39 GWh to 2 GWh between 2012
and 2014 due to political instability
21 Liberia
Installed Capacity: 23 MW
Net Production: 107 GWh (2016)
Fuel: Fuel-oil, diesel, Hydro
Utilies: LEC (State owned)
Peak Load: 11 MW (2014)
Line types: 66 kV
Number of network: 1
Operator: LEC
Lines length: 306 km
MV: 33/22/11 kV
losses: 25 %
Operator: LEC
Number of Subscribers: 29,900 (2014)
Average price: 490 USD/MWh
Electricity access rate: 9.9 % (2014)
Electricity system was almost totally destroyed during the war
LEC resumed activities in 2006 and in 2010 signed a 5 year
management contract with Manitoba Hydro of Canada
The end of the rehabilitation work and the commissioning of the 88
MW Mount coffee Hydro dam started in December 2016
38 MW of fuel-oil capacity commissioned in 2016
22 Guinea-Bissau
Installed Capacity: 12.5 MW (2014)
Net Production: 52.8 GWh (2014)
Fuel: Diesel
Utilies: EAGB (State owned)
No existing transmission system. Electricity is
directly delivered to the distribution network
MV: 30/10 kV
Operator: EAGB
Electricity Sales: 28.0 GWh (e) (2014)
Number of Subscribers: 31,000 (2014)
Consumption per capita: 15.2 kWh (2014)
Average price: 263,89 USD/MWh
Electricity access rate: 17.2 % (2014)
EAGB infrastructure is concentrated in Bissau
African Development Bank estimated losses of the electricity system
was 47 % and that the city of Bissau records in average 22 daily
outages per day in 2014
The production peaked in 2011 by reaching 57.7 GWh
Table 3: WCAF power markets dashboard
Sources: International Energy Agency, World Bank, Regulatory agencies, local utilities, statistical Institutes, Central Banks, author’s calculation
by Patrick BABOGA, Msc. Eng .

More Related Content

What's hot

Korea's energy policies and cooperation opportunities between Australia and K...
Korea's energy policies and cooperation opportunities between Australia and K...Korea's energy policies and cooperation opportunities between Australia and K...
Korea's energy policies and cooperation opportunities between Australia and K...Yonki Hyungkeun PARK
 
Singapores Electricity Market After Market Reform
Singapores Electricity Market After Market ReformSingapores Electricity Market After Market Reform
Singapores Electricity Market After Market Reformelectricitygovernance
 
Solar Regulations & Market Policies- YP Chawla
Solar Regulations & Market Policies- YP ChawlaSolar Regulations & Market Policies- YP Chawla
Solar Regulations & Market Policies- YP ChawlaY P Chawla
 
Wind Development in Texas: History and Future Growth
Wind Development in Texas: History and Future GrowthWind Development in Texas: History and Future Growth
Wind Development in Texas: History and Future Growthaectnet
 
Nepr As Role By Rifai
Nepr As Role By RifaiNepr As Role By Rifai
Nepr As Role By RifaiIEEEP Karachi
 
2009 Wind Technologies market report us departm
2009 Wind Technologies market report   us departm2009 Wind Technologies market report   us departm
2009 Wind Technologies market report us departmGlenn Klith Andersen
 
Presentation By N.A. Zuberi
Presentation By N.A. ZuberiPresentation By N.A. Zuberi
Presentation By N.A. ZuberiIEEEP Karachi
 
Sgcp12 marantes-ukpowernetworks
Sgcp12 marantes-ukpowernetworksSgcp12 marantes-ukpowernetworks
Sgcp12 marantes-ukpowernetworksJustin Hayward
 
John Bryan E3 2009 Impact Of Electrification
John Bryan E3 2009 Impact Of ElectrificationJohn Bryan E3 2009 Impact Of Electrification
John Bryan E3 2009 Impact Of ElectrificationJohn Bryan
 

What's hot (12)

Jim Parks - SMUD
Jim Parks - SMUDJim Parks - SMUD
Jim Parks - SMUD
 
Korea's energy policies and cooperation opportunities between Australia and K...
Korea's energy policies and cooperation opportunities between Australia and K...Korea's energy policies and cooperation opportunities between Australia and K...
Korea's energy policies and cooperation opportunities between Australia and K...
 
Singapores Electricity Market After Market Reform
Singapores Electricity Market After Market ReformSingapores Electricity Market After Market Reform
Singapores Electricity Market After Market Reform
 
Sarnia-Lambton data centre overview 2013-06
Sarnia-Lambton data centre overview 2013-06Sarnia-Lambton data centre overview 2013-06
Sarnia-Lambton data centre overview 2013-06
 
Solar Regulations & Market Policies- YP Chawla
Solar Regulations & Market Policies- YP ChawlaSolar Regulations & Market Policies- YP Chawla
Solar Regulations & Market Policies- YP Chawla
 
Wind Development in Texas: History and Future Growth
Wind Development in Texas: History and Future GrowthWind Development in Texas: History and Future Growth
Wind Development in Texas: History and Future Growth
 
Nepr As Role By Rifai
Nepr As Role By RifaiNepr As Role By Rifai
Nepr As Role By Rifai
 
2009 Wind Technologies market report us departm
2009 Wind Technologies market report   us departm2009 Wind Technologies market report   us departm
2009 Wind Technologies market report us departm
 
Presentation By N.A. Zuberi
Presentation By N.A. ZuberiPresentation By N.A. Zuberi
Presentation By N.A. Zuberi
 
1 Wartsila
1 Wartsila1 Wartsila
1 Wartsila
 
Sgcp12 marantes-ukpowernetworks
Sgcp12 marantes-ukpowernetworksSgcp12 marantes-ukpowernetworks
Sgcp12 marantes-ukpowernetworks
 
John Bryan E3 2009 Impact Of Electrification
John Bryan E3 2009 Impact Of ElectrificationJohn Bryan E3 2009 Impact Of Electrification
John Bryan E3 2009 Impact Of Electrification
 

Similar to 2015 Western and Central Africa power markets

Mohammad Hossain - Bangladesh Presentation.pdf
Mohammad Hossain - Bangladesh Presentation.pdfMohammad Hossain - Bangladesh Presentation.pdf
Mohammad Hossain - Bangladesh Presentation.pdfZahirulIslam153424
 
Kigali | Sep-15 | Uganda country view
Kigali | Sep-15 | Uganda country viewKigali | Sep-15 | Uganda country view
Kigali | Sep-15 | Uganda country viewSmart Villages
 
Pakistan 2013 - Ministry Power & Water - Roadmap to reform Power & Utility s...
Pakistan 2013 -  Ministry Power & Water - Roadmap to reform Power & Utility s...Pakistan 2013 -  Ministry Power & Water - Roadmap to reform Power & Utility s...
Pakistan 2013 - Ministry Power & Water - Roadmap to reform Power & Utility s...Atif Ahmad
 
Energy Analysis Plays an Important Role in Purchase Decisions
Energy Analysis Plays an Important Role in Purchase DecisionsEnergy Analysis Plays an Important Role in Purchase Decisions
Energy Analysis Plays an Important Role in Purchase DecisionsAvijit Choudhury
 
Fostering solar technology in the Mediterranean area - Guidelines Annex
Fostering solar technology in the Mediterranean area - Guidelines AnnexFostering solar technology in the Mediterranean area - Guidelines Annex
Fostering solar technology in the Mediterranean area - Guidelines AnnexFOSTEr in MED
 
Analysis of Electricity Tariffs in Africa
Analysis of Electricity Tariffs in AfricaAnalysis of Electricity Tariffs in Africa
Analysis of Electricity Tariffs in AfricaLeonardo ENERGY
 
COLD IRONING Ships - Alternative Maritime Power
COLD IRONING Ships - Alternative Maritime PowerCOLD IRONING Ships - Alternative Maritime Power
COLD IRONING Ships - Alternative Maritime PowerPawanexh Kohli
 
Tariff structures for sustainable electrification in Africa
Tariff structures for sustainable electrification in AfricaTariff structures for sustainable electrification in Africa
Tariff structures for sustainable electrification in AfricaLeonardo ENERGY
 
Electric vehicles as the future of personal transportation?
Electric vehicles as the future of personal transportation?Electric vehicles as the future of personal transportation?
Electric vehicles as the future of personal transportation?benboycott
 
Energy cost and energy shortage in nepal potential of solar, wind and other f...
Energy cost and energy shortage in nepal potential of solar, wind and other f...Energy cost and energy shortage in nepal potential of solar, wind and other f...
Energy cost and energy shortage in nepal potential of solar, wind and other f...SINGHZEE
 
A Sustainable Future
A Sustainable FutureA Sustainable Future
A Sustainable FutureAtul Raturi
 

Similar to 2015 Western and Central Africa power markets (20)

Mohammad Hossain - Bangladesh Presentation.pdf
Mohammad Hossain - Bangladesh Presentation.pdfMohammad Hossain - Bangladesh Presentation.pdf
Mohammad Hossain - Bangladesh Presentation.pdf
 
Corporate presentation EEB
Corporate presentation EEBCorporate presentation EEB
Corporate presentation EEB
 
Kigali | Sep-15 | Uganda country view
Kigali | Sep-15 | Uganda country viewKigali | Sep-15 | Uganda country view
Kigali | Sep-15 | Uganda country view
 
Pakistan 2013 - Ministry Power & Water - Roadmap to reform Power & Utility s...
Pakistan 2013 -  Ministry Power & Water - Roadmap to reform Power & Utility s...Pakistan 2013 -  Ministry Power & Water - Roadmap to reform Power & Utility s...
Pakistan 2013 - Ministry Power & Water - Roadmap to reform Power & Utility s...
 
Energy Analysis Plays an Important Role in Purchase Decisions
Energy Analysis Plays an Important Role in Purchase DecisionsEnergy Analysis Plays an Important Role in Purchase Decisions
Energy Analysis Plays an Important Role in Purchase Decisions
 
Pakistan Fact Sheet
Pakistan Fact SheetPakistan Fact Sheet
Pakistan Fact Sheet
 
Power sector mis
Power sector misPower sector mis
Power sector mis
 
Fostering solar technology in the Mediterranean area - Guidelines Annex
Fostering solar technology in the Mediterranean area - Guidelines AnnexFostering solar technology in the Mediterranean area - Guidelines Annex
Fostering solar technology in the Mediterranean area - Guidelines Annex
 
Corporate presentation 2 q 14 vf wa
Corporate presentation 2 q 14 vf  waCorporate presentation 2 q 14 vf  wa
Corporate presentation 2 q 14 vf wa
 
Analysis of Electricity Tariffs in Africa
Analysis of Electricity Tariffs in AfricaAnalysis of Electricity Tariffs in Africa
Analysis of Electricity Tariffs in Africa
 
COLD IRONING Ships - Alternative Maritime Power
COLD IRONING Ships - Alternative Maritime PowerCOLD IRONING Ships - Alternative Maritime Power
COLD IRONING Ships - Alternative Maritime Power
 
Corporate presentation 2 q 14 v ff sa
Corporate presentation 2 q 14 v ff saCorporate presentation 2 q 14 v ff sa
Corporate presentation 2 q 14 v ff sa
 
Tariff structures for sustainable electrification in Africa
Tariff structures for sustainable electrification in AfricaTariff structures for sustainable electrification in Africa
Tariff structures for sustainable electrification in Africa
 
EEB corporate presentation
EEB corporate presentationEEB corporate presentation
EEB corporate presentation
 
Power sector
Power sectorPower sector
Power sector
 
Lecture on Ghana re unido isec
Lecture on Ghana re unido isecLecture on Ghana re unido isec
Lecture on Ghana re unido isec
 
Electric vehicles as the future of personal transportation?
Electric vehicles as the future of personal transportation?Electric vehicles as the future of personal transportation?
Electric vehicles as the future of personal transportation?
 
Energy cost and energy shortage in nepal potential of solar, wind and other f...
Energy cost and energy shortage in nepal potential of solar, wind and other f...Energy cost and energy shortage in nepal potential of solar, wind and other f...
Energy cost and energy shortage in nepal potential of solar, wind and other f...
 
A Sustainable Future
A Sustainable FutureA Sustainable Future
A Sustainable Future
 
Argentina s12
Argentina s12Argentina s12
Argentina s12
 

Recently uploaded

Concrete Mix Design - IS 10262-2019 - .pptx
Concrete Mix Design - IS 10262-2019 - .pptxConcrete Mix Design - IS 10262-2019 - .pptx
Concrete Mix Design - IS 10262-2019 - .pptxKartikeyaDwivedi3
 
chaitra-1.pptx fake news detection using machine learning
chaitra-1.pptx  fake news detection using machine learningchaitra-1.pptx  fake news detection using machine learning
chaitra-1.pptx fake news detection using machine learningmisbanausheenparvam
 
Study on Air-Water & Water-Water Heat Exchange in a Finned Tube Exchanger
Study on Air-Water & Water-Water Heat Exchange in a Finned Tube ExchangerStudy on Air-Water & Water-Water Heat Exchange in a Finned Tube Exchanger
Study on Air-Water & Water-Water Heat Exchange in a Finned Tube ExchangerAnamika Sarkar
 
SPICE PARK APR2024 ( 6,793 SPICE Models )
SPICE PARK APR2024 ( 6,793 SPICE Models )SPICE PARK APR2024 ( 6,793 SPICE Models )
SPICE PARK APR2024 ( 6,793 SPICE Models )Tsuyoshi Horigome
 
CCS355 Neural Network & Deep Learning Unit II Notes with Question bank .pdf
CCS355 Neural Network & Deep Learning Unit II Notes with Question bank .pdfCCS355 Neural Network & Deep Learning Unit II Notes with Question bank .pdf
CCS355 Neural Network & Deep Learning Unit II Notes with Question bank .pdfAsst.prof M.Gokilavani
 
GDSC ASEB Gen AI study jams presentation
GDSC ASEB Gen AI study jams presentationGDSC ASEB Gen AI study jams presentation
GDSC ASEB Gen AI study jams presentationGDSCAESB
 
Current Transformer Drawing and GTP for MSETCL
Current Transformer Drawing and GTP for MSETCLCurrent Transformer Drawing and GTP for MSETCL
Current Transformer Drawing and GTP for MSETCLDeelipZope
 
Microscopic Analysis of Ceramic Materials.pptx
Microscopic Analysis of Ceramic Materials.pptxMicroscopic Analysis of Ceramic Materials.pptx
Microscopic Analysis of Ceramic Materials.pptxpurnimasatapathy1234
 
Gurgaon ✡️9711147426✨Call In girls Gurgaon Sector 51 escort service
Gurgaon ✡️9711147426✨Call In girls Gurgaon Sector 51 escort serviceGurgaon ✡️9711147426✨Call In girls Gurgaon Sector 51 escort service
Gurgaon ✡️9711147426✨Call In girls Gurgaon Sector 51 escort servicejennyeacort
 
Heart Disease Prediction using machine learning.pptx
Heart Disease Prediction using machine learning.pptxHeart Disease Prediction using machine learning.pptx
Heart Disease Prediction using machine learning.pptxPoojaBan
 
HARMONY IN THE HUMAN BEING - Unit-II UHV-2
HARMONY IN THE HUMAN BEING - Unit-II UHV-2HARMONY IN THE HUMAN BEING - Unit-II UHV-2
HARMONY IN THE HUMAN BEING - Unit-II UHV-2RajaP95
 
What are the advantages and disadvantages of membrane structures.pptx
What are the advantages and disadvantages of membrane structures.pptxWhat are the advantages and disadvantages of membrane structures.pptx
What are the advantages and disadvantages of membrane structures.pptxwendy cai
 
main PPT.pptx of girls hostel security using rfid
main PPT.pptx of girls hostel security using rfidmain PPT.pptx of girls hostel security using rfid
main PPT.pptx of girls hostel security using rfidNikhilNagaraju
 
Application of Residue Theorem to evaluate real integrations.pptx
Application of Residue Theorem to evaluate real integrations.pptxApplication of Residue Theorem to evaluate real integrations.pptx
Application of Residue Theorem to evaluate real integrations.pptx959SahilShah
 
complete construction, environmental and economics information of biomass com...
complete construction, environmental and economics information of biomass com...complete construction, environmental and economics information of biomass com...
complete construction, environmental and economics information of biomass com...asadnawaz62
 
power system scada applications and uses
power system scada applications and usespower system scada applications and uses
power system scada applications and usesDevarapalliHaritha
 
INFLUENCE OF NANOSILICA ON THE PROPERTIES OF CONCRETE
INFLUENCE OF NANOSILICA ON THE PROPERTIES OF CONCRETEINFLUENCE OF NANOSILICA ON THE PROPERTIES OF CONCRETE
INFLUENCE OF NANOSILICA ON THE PROPERTIES OF CONCRETEroselinkalist12
 

Recently uploaded (20)

Concrete Mix Design - IS 10262-2019 - .pptx
Concrete Mix Design - IS 10262-2019 - .pptxConcrete Mix Design - IS 10262-2019 - .pptx
Concrete Mix Design - IS 10262-2019 - .pptx
 
chaitra-1.pptx fake news detection using machine learning
chaitra-1.pptx  fake news detection using machine learningchaitra-1.pptx  fake news detection using machine learning
chaitra-1.pptx fake news detection using machine learning
 
Study on Air-Water & Water-Water Heat Exchange in a Finned Tube Exchanger
Study on Air-Water & Water-Water Heat Exchange in a Finned Tube ExchangerStudy on Air-Water & Water-Water Heat Exchange in a Finned Tube Exchanger
Study on Air-Water & Water-Water Heat Exchange in a Finned Tube Exchanger
 
young call girls in Green Park🔝 9953056974 🔝 escort Service
young call girls in Green Park🔝 9953056974 🔝 escort Serviceyoung call girls in Green Park🔝 9953056974 🔝 escort Service
young call girls in Green Park🔝 9953056974 🔝 escort Service
 
SPICE PARK APR2024 ( 6,793 SPICE Models )
SPICE PARK APR2024 ( 6,793 SPICE Models )SPICE PARK APR2024 ( 6,793 SPICE Models )
SPICE PARK APR2024 ( 6,793 SPICE Models )
 
CCS355 Neural Network & Deep Learning Unit II Notes with Question bank .pdf
CCS355 Neural Network & Deep Learning Unit II Notes with Question bank .pdfCCS355 Neural Network & Deep Learning Unit II Notes with Question bank .pdf
CCS355 Neural Network & Deep Learning Unit II Notes with Question bank .pdf
 
GDSC ASEB Gen AI study jams presentation
GDSC ASEB Gen AI study jams presentationGDSC ASEB Gen AI study jams presentation
GDSC ASEB Gen AI study jams presentation
 
Current Transformer Drawing and GTP for MSETCL
Current Transformer Drawing and GTP for MSETCLCurrent Transformer Drawing and GTP for MSETCL
Current Transformer Drawing and GTP for MSETCL
 
Microscopic Analysis of Ceramic Materials.pptx
Microscopic Analysis of Ceramic Materials.pptxMicroscopic Analysis of Ceramic Materials.pptx
Microscopic Analysis of Ceramic Materials.pptx
 
Gurgaon ✡️9711147426✨Call In girls Gurgaon Sector 51 escort service
Gurgaon ✡️9711147426✨Call In girls Gurgaon Sector 51 escort serviceGurgaon ✡️9711147426✨Call In girls Gurgaon Sector 51 escort service
Gurgaon ✡️9711147426✨Call In girls Gurgaon Sector 51 escort service
 
Heart Disease Prediction using machine learning.pptx
Heart Disease Prediction using machine learning.pptxHeart Disease Prediction using machine learning.pptx
Heart Disease Prediction using machine learning.pptx
 
HARMONY IN THE HUMAN BEING - Unit-II UHV-2
HARMONY IN THE HUMAN BEING - Unit-II UHV-2HARMONY IN THE HUMAN BEING - Unit-II UHV-2
HARMONY IN THE HUMAN BEING - Unit-II UHV-2
 
What are the advantages and disadvantages of membrane structures.pptx
What are the advantages and disadvantages of membrane structures.pptxWhat are the advantages and disadvantages of membrane structures.pptx
What are the advantages and disadvantages of membrane structures.pptx
 
Design and analysis of solar grass cutter.pdf
Design and analysis of solar grass cutter.pdfDesign and analysis of solar grass cutter.pdf
Design and analysis of solar grass cutter.pdf
 
main PPT.pptx of girls hostel security using rfid
main PPT.pptx of girls hostel security using rfidmain PPT.pptx of girls hostel security using rfid
main PPT.pptx of girls hostel security using rfid
 
Application of Residue Theorem to evaluate real integrations.pptx
Application of Residue Theorem to evaluate real integrations.pptxApplication of Residue Theorem to evaluate real integrations.pptx
Application of Residue Theorem to evaluate real integrations.pptx
 
complete construction, environmental and economics information of biomass com...
complete construction, environmental and economics information of biomass com...complete construction, environmental and economics information of biomass com...
complete construction, environmental and economics information of biomass com...
 
power system scada applications and uses
power system scada applications and usespower system scada applications and uses
power system scada applications and uses
 
POWER SYSTEMS-1 Complete notes examples
POWER SYSTEMS-1 Complete notes  examplesPOWER SYSTEMS-1 Complete notes  examples
POWER SYSTEMS-1 Complete notes examples
 
INFLUENCE OF NANOSILICA ON THE PROPERTIES OF CONCRETE
INFLUENCE OF NANOSILICA ON THE PROPERTIES OF CONCRETEINFLUENCE OF NANOSILICA ON THE PROPERTIES OF CONCRETE
INFLUENCE OF NANOSILICA ON THE PROPERTIES OF CONCRETE
 

2015 Western and Central Africa power markets

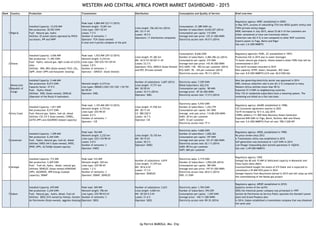
  • 1. WESTERN AND CENTRAL AFRICA POWER MARKET DASHBOARD - 2015 Rank Country Production Transmission Distribution Consumption and Quality of Service Brief overview 1 Nigeria Installed Capacity: 12,010 MW Net production: 30,922 GWh Fuel: Natural gas, hydro Utilities: 25 power plants operated by PHCN successors, IPP and NIPP Peak load: 4,884 MW (23/11/2015) Network length: 15,841 km Lines type: 330/132 kV Losses: 7.5 % Number of networks: 1 Operator: TCN (State owned) 6 total and 4 partial collapses of the grid Lines length: 356,363 km (2014) MV: 33/11 kV Losses: 18.5 % Operators: 11 distribution companies Consumption: 21,589 GWh (e) Number of subscribers: 8,645,527 (2014) Consumption per capita: 115 kWh Average end-user price: 125.31 USD/MWh Electricity access rate: 45.0 % (2014) Regulatory agency: NERC (established in 2005) In May 2015, process of unbundling TCN into NESO (public entity) and TSPN (private entity) began NERC estimates in July 2015, about 53.66 % of the customers are either unmetered or have non-functional meters Collection rate (62.5 %) is low compared to other WAF countries Exports power to Togo, Benin and Niger Gas cost: 2.6 USD/MMBTU 2 Ghana Installed Capacity: 3.656 MW Net production: 11,492 GWh Fuel: Hydro, natural gas, light crude oil (LCO), solar Utilities: VRA, BPA (State owned) TICO, CEL, SAPP, Ameri (IPP) and Karpower (leasing) Peak load: 1,933 MW (29/12/2015) Network length: 5,216 km Lines type: 330/225/161/69 kV Losses: 3.8 % Number of networks: 1 Operator : GRIDCO (State Owned) Lines length: 91,382 km MV: 34,5/33/30/20/11 kV Losses: 23.3 % Operators: ECG, NEDCO (State Owned) and EPC (Private owned) Consumption: 8,646 GWh Number of subscribers: 3,484,396 (e) (2014) Consumption per capita: 315 kWh Average end-user price: 143.45 USD/MWh ECG SAIDI: 138 - 283 hrs per customer (2014) ECG SAIFI: 78 - 165 per customer (2014) Electricity access rate: 78.3 % (2014) Regulatory agencies: PURC, EC (established in 1997) Production fell in 2015 due to water shortages To boost natural gas imports, Ghana leased a Golar FSRU that will be commissioned in 2017 Two tariff increases recorded in 2015 New capacity: KTPP, Ameri, Karpower, BXC Solar Gas cost: 8.8 USD/MMBTU|LCO cost: 60.0 USD/bbl 3 Democratic Republic of Congo Installed Capacity: 2.446 MW Net production: 8,913 GWh Capacity factor: 37.9 % Fuel: Hydro, Diesel Utilities: SNEL (State owned), SINELAC (Operator of the Ruzizi II hydrodam) Network length: 6,215 km Line types: 500(DC)/220/132/120/ 110/70/ 66/50 kV Operator: SNEL Number of substations: 3,607 (2013) Lines length: 17,771 km MV: 30/20 kV Losses: 10.5 % (2014) Operator: SNEL Electricity sales: 7,559 GWh Billed Subscribers: 622,210 Consumption per capita: 98 kWh Average price: 87.26 USD/MWh Electricity access rate: 17,9 % (2014) New law governing electricity sector was approved in 2014 SNEL revenue collection rate is low (61.2 %) compared to many Western Africa utilities (more than 90 %) Exported 37.4 GWh to neighbouring countries Only 13% of residential subscribers have a metering system. The remaining are billed on a flat rate basis 4 Ivory Coast Installed Capacity: 1,811 MW Net production: 8,517 GWh Fuel: Natural gas, Hydro, fuel-oil, diesel Utilities: CIE (15 % State owned), CIPREL, AZITO (IPP) and AGGREKO (leased capacity) Peak load: 1,193 MW (09/12/2015) Network length: 4,733 km Lines type: 225/90 kV Losses: 6.5 % Number of networks: 1 Operator : CIE Lines length: 41,936 km MV: 30/11 kV LV: 380/220 V Losses: 16.7 % Operator: CIE Electricity sales: 5,935 GWh Number of subscribers: 1,432,779 Consumption per capita: 261 kWh Average end-user price: 114.86 USD/MWh SAIDI: 30 hrs per customer SAIFI: 33 per customer Electricity access rate: 77 % Regulatory agency: ANARE (established in 1998) CIE Concession Agreement expires in 2025 Tariff increased by 10 % in July 2015 CIPREL added a 111 MW Heat Recovery Steam Generator Exported 849 GWh to Togo, Benin, Burkina, Mali and Ghana Gas cost: 5.6 USD/MMBTU|Fuel-oil cost: 708.3 USD/MT 5 Cameroon Installed Capacity: 1.299 MW Net production: 6,344 GWh Fuel: Hydro, Natural gas, fuel-oil, diesel Utilities: ENEO (44 % State owned), KPDC, DPDC (IPP), ALTAAQA (leased capcity) Peak load: 764 MW Network length: 2,232 km Lines type: 225/110/90 kV Losses: 5.8 % Number of networks: 3 Operator: ENEO Lines length: 35,155 km MV: 30/15 kV Losses: 30.5 % Operator: ENEO Electricity sales: 4,606 GWh Number of subscribers: 1,020,362 Consumption per capita: 197 kWh Average end-user price: 101.27 USD/MWh Electricity access rate: 62.1 % (2014) SAIDI: 89 hrs per customer SAIFI: 684 per customer Regulatory agency: ARSEL (established in 1998) No price review since 2012 A Transmission utility was established in 2015 Self-generation was estimated at 1,637 GWh in 2014 Lom Pangar impounding dam started operations in 1Q2016 Gas cost: 3,49 USD/MMBTU 6 Senegal Installed Capacity: 712 MW Net production: 3,429 GWh Fuel: Fuel-oil, hydro, diesel, natural gas Utilities: SENELEC (State owned) KONOUNE (IPP), AGGREKO, APR Energy (Leased capacity), SEMAF Peak load: 533 MW Network length: 529 km Lines type: 225/90 kV Losses: 1.2 % Number of networks: 3 Operator: SEMAF, SENELEC Number of substations: 4,819 Lines length: 17,479 km MV: 30/6.6 kV Losses: 17.3 % Operator: SENELEC Electricity sales: 2,719 GWh Number of Subscribers: 1,050,228 (2014) Consumption per capita: 180 kWh Average end-user price: 197.93 USD/MWh Electricity access rate: 60,6 % (2014) END: 21 GWh Regulatory agency: CRSE Senegal has 60 and 15 MW of dedicated capacity in Manantali and Felou hydro dams (Mali) CountourGlobal bought the assets of GTI Dakar and is expected to commission a 55 MW HFO plant in 2016 Senegal imports from Mauritania started in 2015 and will ramp-up with the commissioning of the Banda gas project 7 Gabon Installed Capacity: 670 MW Net production: 2,244 GWh Fuel: Natural gas, hydro, diesel, Fuel-oil Utilities: SEEG (51% owned by Veolia), Societe de Patrimoine (State-owned), Aggreko (leasing) Peak load: 369 MW Network length: 706 km Line types: 225/90/63 kV Number of networks: 3 Operator: SEEG Number of substations: 2,623 Lines length: 4,065 km MV: 30/20/5.5 kV Losses: 21.6 % Operator: SEEG Electricity sales: 1,704 GWh Number of Subscribers: 294,559 Consumption per capita: 1,043 kWh Average price: 160.11 USD/MWh Electricity access rate: 89.3% (2014) Regulatory agency: ARSEE (established in 2010) Quaterly review of the tariffs SEEG the historical power company was privatized in 1997 Societe de Patrimoine du Service Public operates the Alenakiri power plant and Grand Poubara dam In 2014, Gabon established a transmission company that was dissolved the same year by Patrick BABOGA, Msc. Eng .
  • 2. 8 Mali Installed Capacity: 488,2 MW Net production: 1,469 GWh Imports: 244 GWh Fuel: Fuel-oil, hydro, diesel Utilities: EDM (66 % State owned), SEMAF, SOPAM (IPP), AGGREKO, APR ENERGY (leased capacities) Peak load: 274 MW Network length: 1,365 km Line types: 225/150/66 kV Number of network: 1 Operator: EDM Installed Capacity: 641 MVA Number of substations: 2,714 Lines length: 6,895 km MV: 30/15 kV Losses: 17.8 % Operator: EDM Consumption: 1,327 GWh Number of Subscribers: 400,690 Consumption per capita: 75 kWh Average price: 177.36 USD/MWh Electricity access rate: 25.9 % (2014) Regulatory agency: CREE (established in 2000) SEMAF replaced EEM (ESKOM subsidiary) as operator of Manantali and Felou hydro dams Mali holds 104 and 27 MW of dedicated capacities in these dams, the remaining being allocated to Senegal and Mauritania Imports electricity from Ivory Coast and Mauritania 9 Burkina Installed Capacity: 325 MW Net production: 999 GWh Imports: 443 GWh Fuel: Hydro, diesel, fuel-oil Utility: SONABEL (State-owned) Peak load: 244 MW (07/05/2015) Network length: 1,004 km Line types: 225/132/90 kV Losses: 4.1 % Main networks: 1 Operator: SONABEL Installed Capacity: 625 MVA (2014) Number of substations: 3,218 Lines length: 13,367 km MV: 33/20/15 kV Losses: 13.2 % Operator: SONABEL Consumption: 1,200 GWh Number of Subscribers: 544,825 Consumption per capita: 66 kWh Average price: 181.84 USD/MWh Electricity access rate: 18.8 % Regulatory agency: ARSE (established in 2007) No price review since 2006 APR Energy was operating power plants (30 + 31 MW) that was dismantled in 2012. Burkina imported 443 GWh Fuel-oil cost: 483.0 USD/MT Diesel cost: 827.9 USD/MT 10 Congo Brazzaville Installed Capacity: 592 MW Net Production: 2,585 GWh (e) Fuel: Hydro, natural gas, fuel-oil, gasoil Imports: 37 GWh from DRC Utilies: SNE (State owned), CEC (80 % State- owned) Network length: 1,469 km Line types: 220/110 kV Number of network: 1 losses: 10.1 % (2014) Operator: SNE MV: 35/30/20/6.6 kV losses: 50.0 % Operator: SNE Electricity Sales: 1,160 GWh Number of Subscribers: 256,903 Consumption per capita: 249 kWh Average price: 97,31 USD/MWh Electricity access rate: 41.8 % (2014) Regulatory agency: ARSEL (established in 2003) Congo and Cameroon signed a joint-development agreement for the Chollet hydro dam (600 MW) on the Congo river CEC operates two thermal plant of a total installed capacity of 350 MW near Pointe-Noire Self-generation was estimated at 208 MWh in 2014 Exports small quantity of electricity to DRC 11 Togo Local Installed Capacity: 146 MW CEB Installed capacity: 105 MW Net production: 361 GWh CEET purchase from CEB: 745 GWh Fuel: Fuel-oil, disel, Natural gas Utilies: CEB, CEET (State owned), ContourGlobal (IPP) Peak load: 213 MW Network length: 1,870 km (including HV lines of Benin ) Line types: 330/161/63 kV Number of network: 1 Losses: 5.2 % Operator: CEB Installed Capacity: 626 MW Peak load: 172 MW Number of substations: 1,707 Lines length: 7,209 km MV: 34.5/33/20/5.5 kV Losses: 16,8 % Operator: CEET CEET Sales: 910 GWh Number of Subscribers: 294,639 Consumption per capita: 125 kWh Average price: 182.56 USD/MWh Electricity access rate: 33.0 % Regulatory agency: ARSE (established in 2000) CEB is a jointly incorporated company with the State of Benin that imports electricity from Ghana, Ivory Coast and Nigeria CEET operates under a performance agreement signed with the State of Togo for 5 years (2014-2018) ContourGlobal operates Lome Thermal Plant (100 MW) Gas cost: 10.05 USD/MMBTU|Fuel-oil cost: 761.2 USD/MT 12 Benin Installed Capacity: 114 MW CEB installed capacity: 105 MW SBEE Production: 134 GWh SBEE purchase from CEB: 1,087 GWh Fuel: Fuel-oil, natural gas Utilities: CEB, SBEE (State owned) Peak load: 241 MW Network length: 1,870 km (including HV lines of Togo) Line types: 330/161/63 kV Number of network: 1 Operator: CEB Number of substations: 3,524 Lines length: 14,388 km MV: 30/20/15/6.6 kV losses: 23.9 % Operator: SBEE SBEE Sales: 844 GWh CEB sales to industries: 59.1 GWh Number of Subscribers: 484,486 (2013) Consumption per capita: 78 kWh Tariffs: 131.95 - 194.54 USD/MWh Electricity access rate: 31.0 % Regulatory agency: ARSE (established in 2000) CEB sells electricity directly to the local cement plant Adjarala hydro dam (147 MW) started construction in 2015 Gas imports have been erratic through the WAPCO, since the commissioning of this pipeline in 2009 13 Niger Installed Capacity: 151 MW NIGELEC production: 156 GWh SONICHAR production: 221 GWh Fuel: Diesel, Coal Imports: 782 GWh Utilities: NIGELEC , SONICHAR, SNCA (State owned), AGGREKO (leased engines) Peak load: 353 MW (2014) Network length: 706 km (2014) Line types: 132/66 kV Losses: 9.0 % (2014) Operator: NIGELEC Installed Capacity: 387 MVA (2014) Number of substations: 2,105 (2014) Lines length: 6,890 km (2014) MV: 33/20 kV Losses: 10.5 % (2014) Operator: NIGELEC Consumption: 769 GWh Number of Subscribers: 253,745 Consumption per capita: 40.2 kWh Average price: 138,26 USD/MWh Electricity access rate: 14.6 % (2014) Regulatory agency: ARSE (established in 2015) SONICHAR operates a 37.6 MW coal thermal plant No price review since 2012 Imported more than 78.2 % of its electricity needs from Nigeria Kandadji Hydro dam (130 MW) is under construction The Gorou Banda thermal plant (100 MW) was inaugurated in April 2017 14 Guinea Installed Capacity: 603 GW Net Production: 1,118 GWh Fuel: Hydro, fuel-oil, gasoil Utilities: EDG (State owned) Peak load: 260 MW Network length: 497 km Line types: 225/110/60 kV Number of networks: 2 Losses: 7.7 % (2013) Operator: EDG Installed Capacity: 428 MVA Number of substations: 1,984 Lines length: 1,342 km MV: 30/15/6 kV Losses: 17 % (2013) Operator: EDG Electricity Sales: 758 GWh Number of Subscribers: 277,558 Consumption per capita: 60.1 kWh Average price: 93,25 USD/MWh Electricity access rate: 26.4 % (2014) Regulatory agency: ARSEE (established in 2003) EDG and Veolia signed a management contract in 2015 Some consumers are billed on a flat rate basis Kaleta hydro dam was completed in August 2015 Leasing of 50 MW to Aggreko was ended in June 2015 Self-generation had an installed capacity of 63.4 MW in 2014 15 Mauritania Installed Capacity: 354 MW Production: 908 GWh Self-production (Mining sector): 489 GWh Fuel: Fuel-oil, Diesel, Hydro, Wind, Solar Utilities: SOMELEC (State owned), SNIM Network length: 1,120 km (Connects Nouakchott to the transmission system of Manantali and Felou dams) Line types: 225/90 kV Operator: SEMAF Number of substations: 801 (2013) Lines length: 2,973 km (2013) MV: 33/15 kV losses: 27.2 % Operator: SNIM (Zouerate and F'Derick cities) and SOMELEC Electricity Sales: 572 GWh Number of subscribers: 220,000 Consumption per capita: 154 kWh Tariff: 72.69 - 189.12 USD/MWh Electricity access rate: 28.4 % (2013) Regulatory agency: ARE (established in 2001) Tullow farmed-down of the Banda license in 2014 due to falling oil prices and Mauritania is looking for a new operator. 180 MW of this project was commissioned with fuel-oil in 2015 Mauritania has dedicated capacities of 36 and 18 MW in Manantali and Felou hydro dams (Mali) Exported 104 GWh to Senegal by Patrick BABOGA, Msc. Eng .
  • 3. 16 Equatorial Guinea Installed Capacity: 327 MW Production: 692 GWh (e) Fuel: Hydro, natural gas and oil Utilies: SEGESA (State owned) Peak Load (first 9 months 2015): 123 MW Line types: 220/110/66 kV Number of network: 2 Operator: SEGESA MV: 20/15 kV Operator: SEGESA Electricity consumption: 568 GWh (e) Consumption per capita: 463 kWh (e) Tariff: 101.5 - 169.16 USD/MWh Electricity access rate: 80.0 % No Regulatory agency The commissioning of the Sendje (200 MW) hydro dam is planned in 2017 and the excess production could be exported In 2015, the government decided to convert 24 MW of the Bata thermal plant from fuel-oil to natural gas No tariff review since 2002 17 Gambia Installed Capacity: 28 MW (2014) Net Production: 293 GWh Fuel: Fuel-oil, gasoil and Wind Utilies: NAWEC (State owned), GAMWIND (IPP) No existing transmission system. Electricity is directly delivered to the distribution network Lines length: 306 km MV: 33/11 kV losses: 24.0 % (2014) Operator: NAWEC Electricity Sales: 218 GWh (2014) Number of Subscribers: 145,141 (2014) Consumption per capita: 109.7 kWh Average price: 227.59 USD/MWh (2014) Electricity access rate: 44.5 % (2014) Regulatory agency: PURA (established in 2001) A 12 % Tariff increase occurred in 2015 Fuel-oil unavailability obliged NAWEC to mainly rely on dieselon GEG handed over Brikama power plant to NAWEC in 2013 Gambia is expected to have 17 and 25 MW of dedicated capacity in Kaleta and Sambanglou dams under OMVG 18 Chad Installed Capacity: 192 MW Production: 216 GWh (2014) Fuel: fuel-oil, diesel Utilies: SNE (State owned), Aggreko (leased Capacity) Line types: 90/66 kV Number of network: 1 (Concentrated in N'Djamena area) Operator: SNE MV: 15 kV Operator: SNE Number of Subscribers: 51,000 Tariff: 143.79 - 211.45 USD/MWh Electricity access rate: 3.8 % (2014) The historical utility STEE was dissolved in 2010 and SNE is now the public utility in charge of the electricity sector Electricity network is concentrated around N'djamena Electricity tariff were reduced by 37 % in 2015 60 MW of Solar PV is planned to be commissioned in 2018 19 Sierra Leone Installed Capacity: 100 MW Net Production: 294 GWh (2016) Fuel: Hydro, diesel, fuel-oil Utilies: EGTC (State owned), BKPS Line types: 161/66 kV Number of network: 1 losses: 3.5 % (2013) Operator: EGTC MV: 33/11 kV losses: 54.1 % (2013) Operator: EDSA Electricity Sales: 114.6 GWh (2014) Number of Subscribers: 44,915 (2013) Consumption per capita: 20.4 kWh (2014) Tariff: 131.64 - 425.24 USD/MWh Electricity access rate: 5.0 % (2013) Regulatory agency: SLEWRC (established 2011) NPA was unbundled into EGTC and EDSA in 2015 Phase II of the Bumbuna hydro plant (350 MW) is expected to reach financial closing in 2017 Tariffs were increased by 15 % in September 2016 20 Central African Republic Installed Capacity: 36 MW (2014) Net Production: 139 GWh (2014) Imports: 0.2 GWh Fuel: Hydro, diesel Utilies: ENERCA (State owned) Network length: 172 km (2012) Line types: 110/63 kV Number of network: 1 Utilies: ENERCA Number of substations: 213 (2012) Lines length: 585 km (2012) MV:15/6.6/5.5 kV Utilies: ENERCA Electricity Sales: 38 GWh (2014) Number of LV Subscribers: 30,003 (e) (2014) Consumption per capita: 7.6 kWh (2014) Electricity access rate: 2.5 % (2014) Regulatory agency: ARSEC (established in 2005) The Mobaye area is supplied directly from DRC Boali 1 and 2 dams (18.4 MW) are the main generating facilities LV consumption was reduced by from 39 GWh to 2 GWh between 2012 and 2014 due to political instability 21 Liberia Installed Capacity: 23 MW Net Production: 107 GWh (2016) Fuel: Fuel-oil, diesel, Hydro Utilies: LEC (State owned) Peak Load: 11 MW (2014) Line types: 66 kV Number of network: 1 Operator: LEC Lines length: 306 km MV: 33/22/11 kV losses: 25 % Operator: LEC Number of Subscribers: 29,900 (2014) Average price: 490 USD/MWh Electricity access rate: 9.9 % (2014) Electricity system was almost totally destroyed during the war LEC resumed activities in 2006 and in 2010 signed a 5 year management contract with Manitoba Hydro of Canada The end of the rehabilitation work and the commissioning of the 88 MW Mount coffee Hydro dam started in December 2016 38 MW of fuel-oil capacity commissioned in 2016 22 Guinea-Bissau Installed Capacity: 12.5 MW (2014) Net Production: 52.8 GWh (2014) Fuel: Diesel Utilies: EAGB (State owned) No existing transmission system. Electricity is directly delivered to the distribution network MV: 30/10 kV Operator: EAGB Electricity Sales: 28.0 GWh (e) (2014) Number of Subscribers: 31,000 (2014) Consumption per capita: 15.2 kWh (2014) Average price: 263,89 USD/MWh Electricity access rate: 17.2 % (2014) EAGB infrastructure is concentrated in Bissau African Development Bank estimated losses of the electricity system was 47 % and that the city of Bissau records in average 22 daily outages per day in 2014 The production peaked in 2011 by reaching 57.7 GWh Table 3: WCAF power markets dashboard Sources: International Energy Agency, World Bank, Regulatory agencies, local utilities, statistical Institutes, Central Banks, author’s calculation by Patrick BABOGA, Msc. Eng .