Power BI Dashboards For Manufacturing
•
0 likes•94 views

Learn how Power BI Dashboards can help in gaining insights on Production and Test Data easily. Read the case study to know more.

Recommended
Recommended
More Related Content
What's hot
What's hot (20)
Similar to Power BI Dashboards For Manufacturing
Similar to Power BI Dashboards For Manufacturing (20)
More from Parag Rege
More from Parag Rege (9)
Recently uploaded
Recently uploaded (20)
Power BI Dashboards For Manufacturing
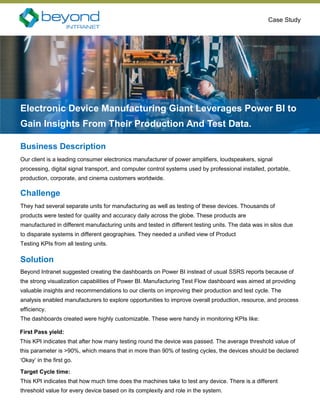
- 1. Case Study Business Description Our client is a leading consumer electronics manufacturer of power amplifiers, loudspeakers, signal processing, digital signal transport, and computer control systems used by professional installed, portable, production, corporate, and cinema customers worldwide. Electronic Device Manufacturing Giant Leverages Power BI to Gain Insights From Their Production And Test Data. Challenge They had several separate units for manufacturing as well as testing of these devices. Thousands of products were tested for quality and accuracy daily across the globe. These products are manufactured in different manufacturing units and tested in different testing units. The data was in silos due to disparate systems in different geographies. They needed a unified view of Product Testing KPIs from all testing units. Solution Beyond Intranet suggested creating the dashboards on Power BI instead of usual SSRS reports because of the strong visualization capabilities of Power BI. Manufacturing Test Flow dashboard was aimed at providing valuable insights and recommendations to our clients on improving their production and test cycle. The analysis enabled manufacturers to explore opportunities to improve overall production, resource, and process efficiency. The dashboards created were highly customizable. These were handy in monitoring KPIs like: First Pass yield: This KPI indicates that after how many testing round the device was passed. The average threshold value of this parameter is >90%, which means that in more than 90% of testing cycles, the devices should be declared ‘Okay’ in the first go. Target Cycle time: This KPI indicates that how much time does the machines take to test any device. There is a different threshold value for every device based on its complexity and role in the system.
- 2. Benefits Manufacturing Test Flow dashboard helped users to gain new insights from their device manufacturing and testing data. The client was able to get highly customizable dashboards with strong visualization capabilities. The visual dashboard could identify whether the main issue was in manufacturing or testing. It was then possible to determine which manufacturing or testing unit produced the defective components/devices. Helped them Identify challenges in testing methodology versus human error. Determine where to improve the existing training methodology. Their key stakeholders were able to now drill down and get Granular reports on the entire production and test process. They also achieved resource optimization with these reports. Finally, they were able to achieve faster go-to-market with improved accuracy of their products. 1- Manufacturing Test Flow Dashboard
- 3. 2- Location-wise summary dashboard www.beyondintranet.com l contact@beyondintranet.com l +1-954.317.3944 A Company