This document discusses normal features and variants of the alpha rhythm seen on EEG. Key points include:
- Alpha rhythm is an 8-13 Hz rhythm seen over the occipital regions with eyes closed that attenuates with eye opening.
- Features like frequency, voltage, regulation, distribution and asymmetry are described for normal alpha rhythm in children and adults.
- Variants including central/temporal alpha and prominent frontal alpha are discussed.
- Parameters outside of normal ranges like abnormal frequency, low voltage, and persistent asymmetry are considered abnormal.


![1
1 Normal and Benign Variants 123
References
1. Storm V, Bekkering D. Some results obtained with the
EEG-spectrograph. Electroencephalogr Clin Neurophysiol.
1958;10(3):563.
2. Gloor P. Contributions of electroencephalography and
electrocorticography to the neurosurgical treatment of
the epilepsies. Adv Neurol. 1975;8:59.
3. Sperling M. Intracranial electroencephalography. In:
Ebersole J, Pedley T, eds. Current Practice of Clinical
Electroencephalography. Philadelphia: Lippincott
Williams & Wilkins. 2003
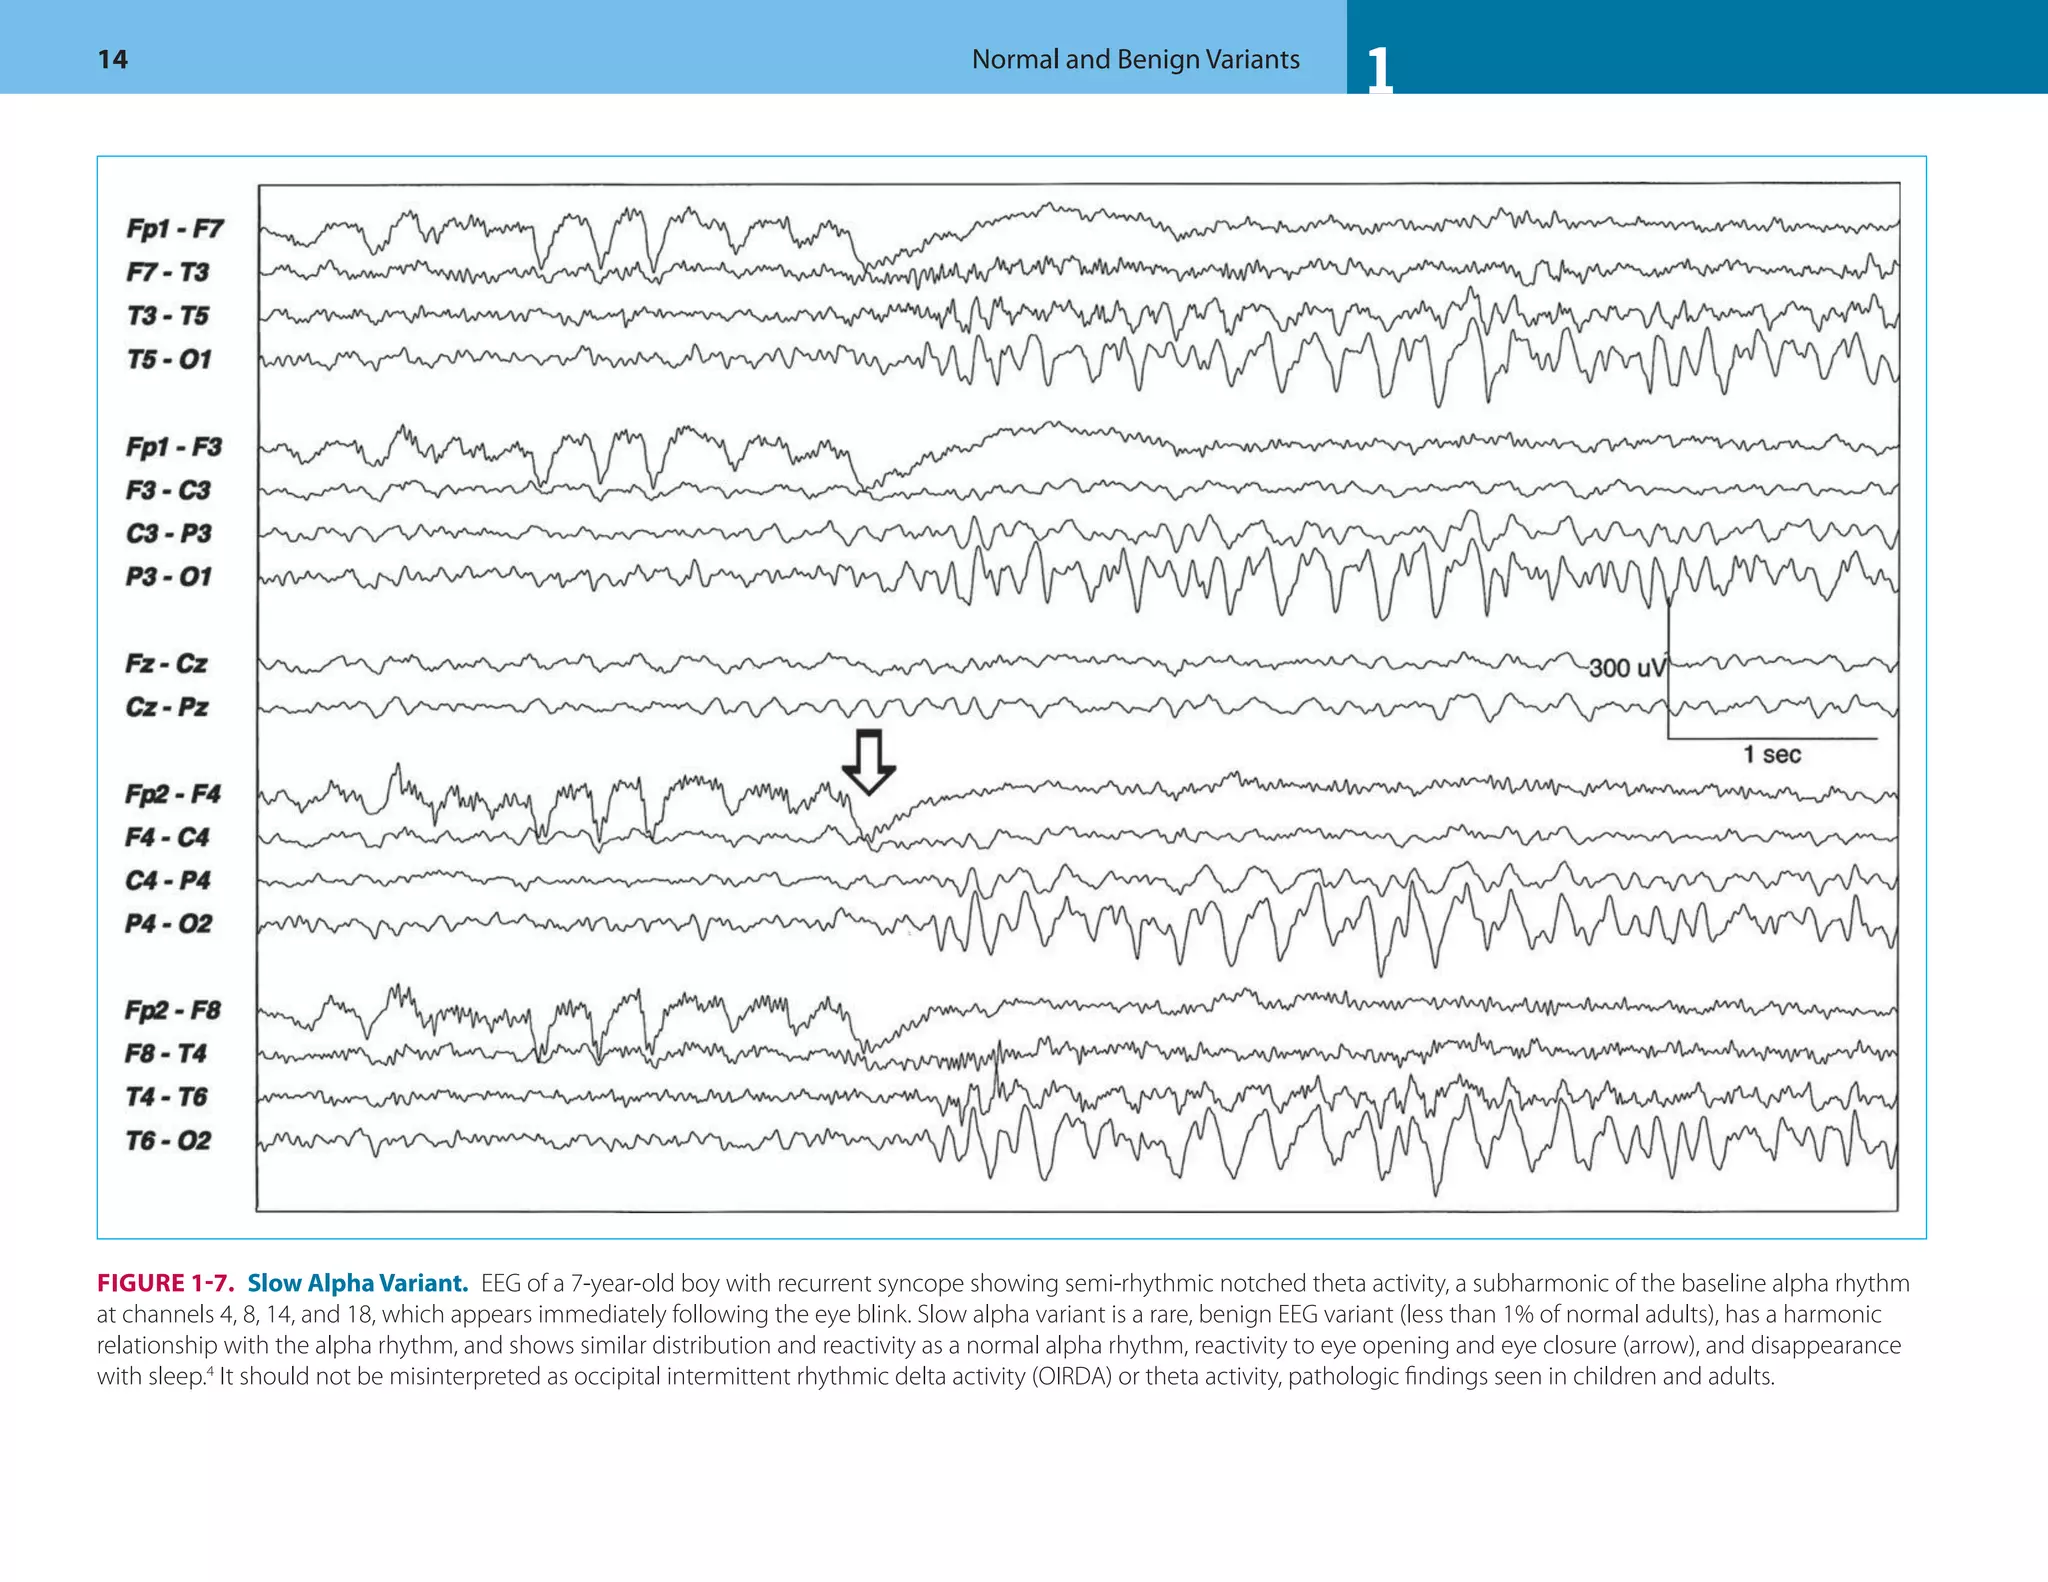
4. Goodwin J. The significance of alpha variants in the
EEG, and their relationship to an epileptiform syndrome.
Am J Psychiatry. 1947;104(6):369–379.
5. Aird RB, Gastaut Y. Occipital and posterior
electroencephalographic rhythms. Electroencephalogr
Clin Neurophysiol. 1959;11:637–756.
6. Chatrian GE (Chairman), Bergamini L, Dondey M,
Klass DW, Lennox-Buchthal M and Petersén I. A
glossary of terms most commonly used by clinical
electroencephalographers. Electroencephalogr Clin
Neurophysiol. 1974;37:538–548.
7. Adams A. Studies on the flat electroencephalogram
in man. Electroencephalogr Clin Neurophysiol.
1959;11(1):35–41.
8. Gibbs FA, Gibbs EL. Atlas of Electroencephalography.
Cambridge, MA: Addison Wesley; 1950.
9. Niedermeyer E. The normal EEG of the waking
adult. In: Niedermeyer E, Da Silva F, eds.
Electroencephalography: Basic Principles, Clinical
Applications, and Related Fields. Philadelphia:
Lippincott Williams & Wilkins. 2005.
10. Eeg-Olofsson O, Petersen I, Sellden U. The development
of the electroencephalogram in normal children from
the age of 1 through 15 years. Paroxysmal activity.
Neuropadiatrie. 1971;2(4):375–404.
11. Petersen I, Eeg-Olofsson O. The development of the
electroencephalogram in normal children from the
age of 1 through 15 years. Non-paroxysmal activity.
Neuropadiatrie. 1971;2(3):247–304.
12. Kellaway P. Overly approach to visual analysis: Element
of the normal EEG and their characteristics in children
and adults. In: Ebersole JS, Pedley TA (eds) Current
Practice of Clinical Electroencephalography. 3rd ed.
Lippincott Williams & Wilkins, Philadelphia, USA,
2003;100–159.
13. Sunku A, Donat JF, Johnston JA, et al. Occipital
responses to visual pattern stimulation: B104. J Clin
Neurophysiol. 1996;13(5):438.
14. Westmoreland B. Electroencephalography: adult, normal,
and benign variants. Clin Neurophysiol. 2009;4(1):119.
15. Fisch BJ. Fisch and Spehlmann's EEG Primer: Basic
Principles of Digital and Analog EEG. New Orleans:
Elsevier Science Health Science Divison. 1999
16. Gronseth G, Greenberg M. The utility of the
electroencephalogram in the evaluation of patients
presenting with headache: a review of the literature.
Neurology. 1995;45(7):1263.
17. Raieli V, Puma D, Brighina F. Role of neurophysiology
in the clinical practice of primary pediatric headaches.
Drug Dev Res. 2007;68(7).
18. Grey Walter W, Shipton H. A new toposcopic display
system. Electroencephalogr Clin Neurophysiol.
1951;3(3):281–292.
19. Gibbs EL, Gibbs FA. [Electroencephalogram in
congenital anophthalmia (author's transl)]. EEG EMG
Z Elektroenzephalogr Elektromyogr Verwandte Geb.
1981;12(4):171–173.
20. Niedermeyer E. Sleep and EEG. In: Niedermeyer E,
Da Silva F, eds. Electroencephalography: Basic Principles,
Clinical Applications, and Related Fields. 5th ed.
Philadelphia: Lippincott Williams & Wilkins. 2005;
193–207.
21. Hughes J. EEG in Clinical Practice. Burlington, MA,
USA: Butterworth-Heinemann; 1994.
22. Dan B, Boyd SG. A neurophysiological perspective
on sleep and its maturation. Dev Med Child Neurol.
2006;48(09):773–779.
23. Hughes JR. Sleep spindles revisited. J Clin Neurophysiol.
1985;2(1):37–44.
24. Hess R. The electroencephalogram in sleep.
Electroencephalogr Clin Neurophysiol. 1964;16(1):44–55.
25. Dreyfus-Brisac and Curzi-Dascalova, 1975. Dreyfus-
Brisac C and Curzi-Dascalova L, The EEG during the
first year of life. In: G.C. Lairy, Editor, Handbook of
electroencephalography and clinical neurophysiology,
Elsevier, Amsterdam (1975), pp. 6–23.
26. Tharp B, Aminoff M. Electrodiagnosis in Clinical
Neurology. New York: Churchill Livingstone; 1980.
27. Fois A. The electroencephalogram of the normal child.
Springfield: Thomas; 1961:111.
28. Brandt S, Brandt H. The electroencephalographic
patterns in young healthy children from 0 to five
years of age; their practical use in daily clinical
electroencephalography. Acta Psychiatrica et Neurologica
Scandinavica. 1955;30(1–2):77.
29. Gibbs F, Gibbs E. Atlas of Electroencephalography.
Cambridge, MA: Addison Wesley, 1952.
30. Oswald I. Sudden bodily jerks on falling asleep. Brain.
1959;82(1):92–103.
31. Fusco L, Pachatz C, Cusmai R, Vigevano F. Repetitive
sleep starts in neurologically impaired children: an
unusual non-epileptic manifestation in otherwise
epileptic subjects. Epileptic Disord. 1999;1:63–67.
32. Fusco L, Specchio N. Non-epileptic paroxysmal
manifestations during sleep in infancy and childhood.
Neurol Sci. 2005;26:205–209.
33. Schwartz S, Gallagher R, Berkson G. Normal repetitive
and abnormal stereotyped behavior of nonretarded
infants and young mentally retarded children. Am J Ment
Def. 1986;90(6):625.
34. Sheldon S. Parasomnias in childhood. Pediatr Clin North
Am. 2004;51(1):69–88.
35. Westmoreland B. Benign electroencephalographic
variants and patterns of uncertain clinical significance.
In: Ebersole JS, Pedley TA (eds) Current Practice of
Clinical Electroencephalography. 3rd ed. Philadelphia:
Lippincott Williams & Wilkins, USA, 2003
36. Eeg-Olofsson O. The development of the
electroencephalogram in normal adolescents from the age
of 16 through 21 years. Neuropadiatrie. 1971;3(1):11–45.
37. Cavazzuti G, Cappella L, Nalin A. Longitudinal study of
epileptiform EEG patterns in normal children. Epilepsia.
2007;21(1):43–55.
38. Heijbel J, Blom S, Rasmuson M. Benign epilepsy of
childhood with centrotemporal EEG foci: a genetic study.
Epilepsia. 200;16(2):285–293.
39. Degen R, Degen H. Some genetic aspects of rolandic
epilepsy: waking and sleep EEGs in siblings. Epilepsia.
2007;31(6):795–801.
40. Dalla Bernardina B, Beghini G, Tassinari C. Rolandic
spikes in children with and without epilepsy (20 subjects
polygraphically studied during sleep). Epilepsia.
2007;17(2):161–167.
41. American Psychiatric Association. Diagnostic and
statistical manual of mental disorders. 4th ed. Washington
(DC): American Psychiatric Association; 1994.
42. The, M., A 14-month randomised clinical trial of
treatment strategies for attention-deficit/hyperactivity
disorder. Arch Gen Psychiatry. 1999;56:1073–1086.](https://image.slidesharecdn.com/atlasofpediatriceeg-230702062942-5219ce2c/75/Atlas-of-Pediatric-EEG-pdf-136-2048.jpg)


![4 Focal Nonepileptoform Activity 387
41. Lewis D. Febrile convulsions and mesial temporal
sclerosis. Curr Opin Neurol. 1999;12(2):197.
42. Raymond AA, Fish DR, Sisodiya SM, Alsanjari N,
Stevens JM, Shorvon SD. Abnormalities of gyration,
heterotopias, tuberous sclerosis, focal cortical dysplasia,
microdysgenesis, dysembryoplastic neuroepithelial
tumour and dysgenesis of the archicortex in epilepsy:
clinical, EEG and neuroimaging features in 100 adult
patients [Review]. Brain. 1995a;118:629–660.
43. Raymond AA, Fish DR. EEG features of focal
malformations of cortical development. J Clin
Neurophysiol. 1996;13:495–506.
44. Pesola GR, Westfal RE. New-onset generalized seizures
in patients with AIDS presenting to an emergency
department. Acad Emerg Med. 1998;5(9):905–911.
45. Gabuzda DH, Levy SR, Chiappa KH.
Electroencephalography in AIDS and AIDS-related
complex. Clin Electroencephalogr. 1988;19(1):1–6.
46. Frantzen E, Lennox-Buchthal M, Nygaard A.
Longitudinal EEG and clinical study of children with
febrile convulsions. Electroencephalogr Clin Neurophysiol.
1968;24(3):197.
47. Blume WT, Kaibara M. Atlas of Pediatric
Encephalography. Philadelphia (PA): Lippincott-
Raven; 1999.
48. Wang PJ, Hwu WL, Shen YZ. Epileptic seizures
and electroencephalographic evolution in genetic
leukodystrophies. J Clin Neurophysiol. 2001;18(1):
25–32.
49. Pampiglione G, Lehovsky M. The evolution of EEG
features in 26 children with proven neuronal lipidosis.
Electroencephalogr Clin Neurophysiol. 1968;25(5):509.
50. Dumermuth G, Walz W, Scollo-Lavizzari G, Kleiner B.
Spectral analysis of EEG activity in different sleep stages
in normal adults. Eur Neurol. 1972;7(5):265–296.
51. Balslev T, et al. Recurrent seizures in metachromatic
leukodystrophy. Pediatr Neurol. 1997;17(2):150.
52. Marchioni E, et al. Familial hemiplegic migraine versus
migraine with prolonged aura: an uncertain diagnosis in
a family report. Neurology. 1995;45(1):33–37.
53. Farkas V, et al. The EEG background activity in children
with migraine. Cephalalgia. 1987;7(suppl 6):59–64.
54. Sand T. EEG in migraine: a review of the literature. Funct
Neurol. 1991;6(1):7–22.
55. Gastaut JL, Yermenos E, Bonnefoy M, Cros D. Familial
hemiplegic migraine: EEG and CT scan study of two
cases. Ann Neurol. 1981;10:392–395.
56. Schoenen J. Clinical neurophysiology of headache.
Neurol Clin. 1997;15(1):85–105.
57. Beaumanoir A, Jekiel M. Electrographic Observations
during Attacks of Classical Migraine. Migraine and
Epilepsy. London: Butterworth Heinemann; 1987.
11: p. 163–80.
58. Gorman MJ, Welch KMA. Cerebral blood flow and
migraine. 1993, The Regulation of Cerebral Blood Flow.
Boca Raton, FL: CRC Press.
59. Niedermeyer E. The EEG in patients with migraine and
other forms of headache. In: Niedermeyer EdS, Fernando
Lopes, eds. Electroencephalography: Basic principles,
Clinical Applications, and Related fields. Philadelphia:
Lippincott Williams & Wilkins; 2005:631–638.
60. Vahedi K, Denier C, Ducros A, Bousson V, Levy C,
Chabriat H, Haguenau M, Tournier-Lasserve E, Bousser
MG: CACNA1A gene de novo mutation causing
hemiplegic migraine, coma, and cerebellar atrophy.
Neurology 2000;55:1040–1042.
61. Spadaro M, et al. A G301R Na+/K+-ATPase mutation
causes familial hemiplegic migraine type 2 with
cerebellar signs. Neurogenetics. 2004;5(3):177–185.
62. Cevoli S, et al. Familial hemiplegic migraine: clinical
features and probable linkage to chromosome 1 in an
Italian family. Neurol Sci. 2002;23(1):7–10.
63. Carrera P, Piatti M, Stenirri S, et al. Genetic heterogeneity
in Italian families with familial hemiplegic migraine.
Neurology. 1999;53:26–33.
64. O'Brien MJ, Lems YL, Prechtl HF. Transient flattenings
in the EEG of newborns––a benign variation.
Electroencephalogr Clin Neurophysiol. 1987;67(1):16–26.
65. Challamel MJ, Isnard H, Brunon AM, Revol M.
Transitory EEG asymmetry at the start of quiet sleep
in the newborn infant: 75 cases. Rev Electroencephalogr
Neurophysiol Clin. 1984;14(1):17–23.
66. Hrachovy RA, Mizrahi EM, Kellaway P.
Electroencephalography of the newborn. In:
Daly D, Pedley T, eds. Current Practice of Clinical
Electroencephalography. New York: Lippincott Williams
& Wilkins; 1990:201.
67. Lagerlund TD, Daube JR, Rubin DI. Volume conduction.
In: Daube JRR, Devon I, eds. Clinical Neurophysiology.
New York: Oxford University Press; 2009:33–52.
68. Markand ON, Pearls, perils, and pitfalls in the use of
the electroencephalogram. Semin Neurol. 2003;23(1):7–46.
69. Barkovich AJ, Norman D. Absence of the septum
pellucidum: a useful sign in the diagnosis of
congenital brain malformations. Am J Roentgenol.
1989;152(2):353–360.
70. Iinuma K, Handa I, Kojima A, Hayamizu S, Karahashi
M. Hydranencephaly and maximal hydrocephalus:
usefulness of electrophysiological studies for their
differentiation. J Child Neurol. 1989;4:114–117.
71. Tayama M, Hashimoto T, Mori K, Miyazaki M,
Hamaguchi H, Kuroda Y, et al. Electrophysiological study
on hydranencephaly. Brain Dev. 1992;14(3):185.
72. Lott IT, McPherson DL, Starr A. Cerebral cortical
contributions to sensory evoked potentials:
hydranencephaly. Electroencephalogr Clinl Neurophysiol.
1986;64(3):218–223.
73. Neville BGR. The origin of infantile spasms: evidence
from a case of hydranencephaly. Dev Med Child Neurol.
1972;14(5):644–647.
74. Ferguson JH, Levinsohn MW, Derakshan I. Brainstem
seizures in hydranencephaly. Neurology. 1974;24(12):1152.
75. Velasco M, Velasco F, Gardea G, Gordillo F, Diaz de
Leon AE. Polygraphic characterization of the sleep-
epilepsy patterns in a hydranencephalic child with severe
generalized seizures of the Lennox-Gastaut syndrome.
Arch Med Res. 1997;28:297–302.
76. Chatrian GE, Shaw CM, Leffman H. The significance
of periodic lateralized epileptiform discharges in EEG:
an electrographic, clinical and pathological study.
Electroencephalogr Clin Neurophysiol. 1964;17:177–193.
77. Hughes JR. EEG in Clinical Practice. Burlington, MA:
Butterworth-Heinemann Boston; 1994.
78. Raroque HG, Jr., Purdy P. Lesion localization in periodic
lateralized epileptiform discharges: gray or white matter.
Epilepsia. 1995;36(1):58–62.
79. Westmoreland BF, Klass DW, Sharbrough FW. Chronic
periodic lateralized epileptiform discharges. Arch Neurol.
1986;43(5):494–496.
80. Garcia-Morales I, Garcia MT, Galan-Davila L, Gomez-
Escalonilla C, Saiz-Diaz R, Martinez-Salio A, de la
Pena P, Tejerina JA. Periodic lateralized epileptiform
discharges: etiology, clinical aspects, seizures, and
evolution in 130 patients. J Clin Neurophysiol.
2002;19:172–177.
81. Fitzpatrick W, Lowry N. PLEDs: clinical correlates.
Can J Neurol Sci. 2007;34(4):443–450.
82. Gross DW, Gotman J, Quesney LF, Dubeau F, Olivier A.
Intracranial EEG with very low frequency activity fails to
demonstrate an advantage over conventional recordings.
Epilepsia. 1999; 40: 891–898.](https://image.slidesharecdn.com/atlasofpediatriceeg-230702062942-5219ce2c/75/Atlas-of-Pediatric-EEG-pdf-400-2048.jpg)
![4
388 Focal Nonepileptoform Activity
83. Garcia-Morales I, Garcia MT, Galan-Davila L, Gomez-
Escalonilla C, Saiz-Diaz R, Martinez-Salio A, de la
Pena P, Tejerina JA. Periodic lateralized epileptiform
discharges: etiology, clinical aspects, seizures, and
evolution in 130 patients. J Clin Neurophysiol.
2002;19:172–177.
84. Noetzel M, Blake J. Seizures in children with congenital
hydrocephalus: long-term outcome. Neurology.
1992;42(7):1277.
85. Graebner R, Celesia G. EEG findings in hydrocephalus
and their relation to shunting procedures.
Electroencephalogr Clin Neurophysiol. 1973;35(5):517.
86. Liguori G, Abate S, Buono S. Pittore L. EEG findings in
shunted hydrocephalic patients with epileptic seizures.
Ital J Neurol Sci. 1986;7(2):243–247.
87. Veggiotti P, Beccaria F, Guerrini R, Capovilla G,
Lanzi G. Continuous spike-and-wave activity during
slow-wavesleep: syndrome or EEG pattern? Epilepsia.
1999;40:1593–601.
88. Sato O, Yamaguchi T, Kittaka M, Toyama H,
Hydrocephalus and epilepsy. Childs Nerv Syst.
2001;17:76–86
89. Klepper J, Buesse M, Strassburg HM, et al: Epilepsy
in shunt treated hydrocephalus. Dev Med Child
Neurol 1998;40:731–736.
90. Arzimanoglou AA, Andermann F, Aicardi J, Sainte-
Rose C, Beaulieu MA, Villemure JG, et al. Sturge-Weber
syndrome: indications and results of surgery in 20
patients. Neurology. 2000;55:1472–1479.
91. Jan MM, Sadler M, Rahey SR. Lateralized postictal
EEG delta predicts the side of seizure surgery in
temporal lobe epilepsy. Epilepsia. 2001;42(3):402–405.
92. Menkes J, Maria B. Neurocutaneous syndromes. In:
Menkes J, Maria B, Sarnat HB, eds. Child Neurology. 7th ed.
Philadelphia: Lippincot Williams-Wilkins; 2006:803–828.
93. Chien LT, Boehm RM, Robinson H, et al. Characteristic
early electroencephalographic changes in herpes simplex
encephalitis, Arch Neurol. 1977;34:361–364.
94. Lai CW, Gragasin ME. Electroencephalography in
herpes simplex encephalitis. J Clin Neurophysiol.
1988;5(1):87.
95. Westmoreland BF. The EEG in cerebral in ammatory
processes. In: Niedermeyer E, Da Silva F, eds.
Electroencephalography: Basic Principles, Clinical
Applications, and Related Fields. Philadelphia: Lippincott
Williams & Wilkins; 2005.
96. Whitley R, Kimberlin D. Viral encephalitis. Pediatr Rev.
1999;20(6):192–198.
97. Whitley R, Kimberlin D. Herpes Simplex: Encephalitis
Children and Adolescents. Elsevier; 2005.
98. Arfel G, Fischgold H. EEG-signs in tumours of the
brain. Electroencephalogr Clin Neurophysiol. 1961;19:
36–50.
99. Goldensohn ES (1979a): Use of EEG for evaluation of
focal intracranial lesions. In: Klass DW, Daly DD, eds.
Current Practice of Clinical Electroencephalography.
New York: Raven Press; 1979a:307–341.
100. Raymond AA, Fish DR, Boyd SG, Smith SJ, Pitt MC,
Kendall B. Cortical dysgenesis: serial EEG findings
in children and adults. Electroencephalogr Clin
Neurophysiol. 1995b;94:389–397.
101. Gloor P, Ball G, Schaul N. Brain lesions that produce
delta waves in the EEG. Neurology. 1977;27(4):
326–333.
102. Sharbrough FW, Nonspecific abnormal EEG patterns. In:
Niedermeyer E, Da Silva F, eds. Electroencephalography:
Basic Principles, Clinical Applications, and Related Fields.
Philadelphia: Lippincott Williams & Wilkins; 2005:
235–254.
103. Di Gennaro G, Quarato PP, Onorati P, Colazza GB,
Mari F, Grammaldo LG, Ciccarelli O, et al. Localizing
significance of temporal intermittent rhythmic delta
activity (TIRDA) in drug-resistant focal epilepsy. Clin
Neurophysiol. 2003 114:70–78.
104. Geyer JD, Bilir E, Faught RE, et al. Significance of
interictal temporal lobe delta activity for localization
of the primary epileptogenic region [see comment].
Neurology. 1999;52:202–205.
105. Normand MM, Wszolek ZK, Klass DW.
Temporal intermittent rhythmic delta activity
in electroencephalograms. J Clin Neurophysiol.
1995;12(3):280–284.
106. Reiher J, Beaudry M, Leduc CP. Temporal intermittent
rhythmic delta activity (TIRDA) in the diagnosis of
complex partial epilepsy: sensitivity, specificity and
predictive value. Can J Neurol Sci. 1989;16(4):
398–401.
107. Cobb WA, Guiloff RJ, Cast J. Breach rhythm: the
EEG related to skull defects. Electroencephalogr Clin
Neurophysiol. 1979;47(3):251–271.
108. Jaffe R, Jacobs L. The beta focus: it's nature and
significance. Acta Neurol Scand. 1972;48(2):191–203.
109. Kershman J, Conde A, Gibson WC.
Electroencephalography in differential diagnosis
of supratentorial tumors. Arch Neurol Psychiatry.
1949;62(3):255.
110. Palmini A, Gambardella A, Andermann F, et al. Intrinsic
epileptogenicity of human dysplastic cortex as suggested
by corticography and surgical results. Ann Neurol.
1995;37:476–487.
111. Taylor DFM, Bruton C, Corsellis J. Focal dysplasia of the
cerebral cortex in epilepsy. J Neurol Neurosurg Psychiatry.
1971;34:369–387.
112. Quirk JA, Kendall B, Kingsley DPE, et al. EEG features
of cortical dysplasia in children. Neuropediatrics.
1993;24:193–199.
113. Blume WT, David RB, Gomez MR. Generalized
sharp and slow wave complexes. Associated clinical
features and long-term follow-up. Brain. 1973;96(2):
289–306.
114. Green RL, Wilson WP. Asymmetries of beta activity
in epilepsy, brain tumor, and cerebrovascular
disease. Electroencephalogr Clin Neurophysiol.
1961;13:75–78.
115. Barkovich A, Kuzniecky R, Bollen A, Grant P. Focal
transmantle dysplasia: a specific malformation of cortical
development. Neurology. 1997;49:1148–1152.
116. Sullivan LR, Kull LL, Sweeney DB, Davis CP.
Cortical dysplasia: zones of epileptogenesis. Am J
Electroneurodiagnostic Technol. 2005;45:49–60.
117. Ambrosetto G. Treatable partial epilepsy and unilateral
opercular neuronal migration disorder. Epilepsia.
1993;34:604–608.](https://image.slidesharecdn.com/atlasofpediatriceeg-230702062942-5219ce2c/75/Atlas-of-Pediatric-EEG-pdf-401-2048.jpg)


![5
5 Generalized Nonepileptiform Activity 467
References
1. Van Cott A, Brenner R. Drug effects and toxic
encephalopathy. In: Ebersole JS, Pedley TA, eds. Current
Practice of Clinical Electroencephalography. Philadelphia:
Lippincott Williams & Wilkins; 2003:463–482.
2. Blume WT. Drug effects on EEG. J Clin Neurophysiol.
2006;23(4):306–311.
3. Bauer G, B.R., EEG, drug effects, and central nervous
system poisoning. In: Niedermeyer E, Da Silva FHL,
eds. Electroencephalography: Basic Principles, Clinical
Applications, and Related Fields. Amsterdams: Lippincott
Williams & Wilkins. 2005.
4. Kato M, Dobyns W. Lissencephaly and the molecular
basis of neuronal migration. Hum Mol Genet. 2003.
12(90001):89–96.
5. Osborn AG. Diagnostic Imaging: Brain. Salt Lake City,
UT: Amirsys. 2004.
6. Singh R, Gardner RJM, Crossland, KM, et al.
Chromosomal abnormalities and epilepsy: a review
for clinicians and gene hunters. Epilepsia. 2002;43:
127–140.
7. Gastaut H, Pinsard N, Raybaud C, et al. Lissencephaly
(agyria-pachygyria): clinical findings and serial EEG
studies. Dev Med Child Neurol. 1987;29:167–180.
8. Worle H, Keimer R, B. Kohler B. [Miller-Dieker syndrome
(type I lissencephaly) with specific EEG changes].
Monatsschr Kinderheilkd. 1990;138(9):615–618.
9. De Rijk-van Andel JF, Arts WF, De Weerd AW. EEG
and evoked potentials in a series of 21 patients with
lissencephaly type I. Neuropediatrics. 1992;23(1):4–9.
10. Barkovich A, Lindan C. Congenital cytomegalovirus
infection of the brain: imaging analysis and embryologic
considerations. Am J Neuroradiol. 1994;15(4):703–715.
11. Pilz DT, Matsumoto N, Minnerath S, et al. LIS1 and XLIS
(DCX) mutations cause most classical lissencephaly,
but different patterns of malformation. Hum Mol Genet.
1998;7:2029–2037.
12. Dobyns, W.B. et al. Differences in the gyral pattern
distinguish chromosome 17-linked and X-linked
lissencephaly. Neurology. 1999;53:270−277.
13. Guerrini R, Marini C (2006) Genetic malformations of
cortical development. Exp Brain Res 173:322–333
14. Hodgkins PR, Kriss A, Boyd S et al. A study of EEG,
electroretinogram, visual evoked potential, and eye
movements in classical lissencephaly. Dev Med Child
Neurol. 2000;42:48–52.
15. Quirk JA, Kendall B, Kingsley DPE, et al. EEG features
of cortical dysplasia in children. Neuropediatrics.
1993;24:193–199.
16. Bode H, Bubl R. EEG changes in type 1 and type 2
lissencephaly. Klin Pediatr. 1994;206:12–17.
17. Mori K, Hashimoto T, Tayama M, et al. Serial EEG and
sleep polygraphic studies on lissencephaly (agyria–
pachygyria). Brain Dev. 1994;16:365–373.
18. Majkowski J, Lee MH, Kozlowski PB, Haddad R. EEG
and seizure threshold in normal and lissencephalic
ferrets. Brain Res. 1984;307:29–38.
19. Kurlemann G, Schuierer G, Kuchelmeister K, Kleine M,
Weg-lage J, Palm DG. Lissencephaly syndromes: clinical
aspects. Childs Nerv Syst. 1993;9:380–386.
20. De Rijk-van Andel J, Arts W, De Weerd A. EEG
and evoked potentials in a series of 21 patients with
lissencephaly type I. Neuropediatrics. 1992;23(1):4–9.
21. Hakamada S, Watanabe K, Hara K, Miyazaki S. The
evolution of electroencephalographic features in
lissencephaly syndrome. Brain Dev. 1979;4:277–283.
22. Raieli V, Puma D, Brighina F. Role of neurophysiology
in the clinical practice of primary pediatric headaches.
Drug Dev Res. 2007;68(7):389–396.
23. Gronseth GS, Greenberg MK. The utility of the
electroencephalogram in the evaluation of patients
presenting with headache: a review of the literature.
Neurology. 1995;45(7):1263–1267.
24. Doose H. EEG in childhood epilepsy. 1st ed. Montrouge-
France: John Libbey Eurotext. 2003:410.
25. Neubauer BA, Hahn A, Doose H, Tuxhorn I. (2005)
Myoclonic-astatic epilepsy of early childhood—definition,
course, nosography, and genetics. Adv Neurol 95:
147–155.
26. Foletti G, Volanschi D. Influence of lamotrigine addition
on computerized background EEG parameters in
severe epileptogenic encephalopathies. Eur Neurol.
1994;34(1):87–89.
27. Glaze DG. Neurophysiology of Rett syndrome. J Child
Neurol. 2005;20(9):740–746.
28. Niedermeyer E, Rett A, Renner H, Murphy M, Naidu S.
Rett syndrome and the electroencephalogram. Am J Med
Genet Suppl. 1986;1:195–199
29. Walser H, Isler H. Frontal intermittent rhythmic delta
activity, impairment of consciousness and migraine.
Headache J Head Face Pain. 1982;22(2):74–80.
30. Pietrini V, Terzano MG, D’andrea G, Parrino L, Cananzi
AR, Ferro–Milone F. Acute confusional migraine: clinical
and electroencephalographic aspects. Cephalalgia.
1987;7:29–37.6.
31. Gladstein J. Headache in pediatric patients:
diagnosis and treatment. Top Pain Manag. 2007.
22(11):1.
32. Frequin S, Linssen WHJP.1, Pasman JW, Hommes
OR, Merx HL. Recurrent prolonged coma due to basilar
artery migraine. A case report. Headache J Head Face
Pain. 1991;31(2):75–81.
33. Muellbacher W, Mamoli B. Prolonged impaired
consciousness in basilar artery migraine. Headache
J Head Face Pain. 1994;34(5):282–285.
34. Alehan F, Watemberg N. Clinical and laboratory
correlates of frontal intermittent rhythmic delta
activity (FIRDA). Dementia. 2001;9:13.2.
35. Tan HJ, Suganthi C, Dhachayani S, et al. The coexistence
of anxiety and depressive personality traits in migraine.
Singapore Med J. 2007;48:307–310.
36. Fisch BJ. Fisch and Spehlmann's EEG Primer: Basic
Principles of Digital and Analog EEG. Amsterdams:
Elsevier Science Health Science Division. 1999.
37. Sharbrough FW, Nonspecific abnormal EEG
patterns. In: Niedermeyer E, Fernando LDS, eds.
Electroencephalography: Basic Principles, Clinical
Applications, and Related Fields. Lippincott Williams &
Wilkins; 2005:235–254.
38. Di Gennaro G, Quarato PP, Onorati P, et al. Localizing
significance of temporal intermittent rhythmic delta
activity (TIRDA) in drug-resistant focal epilepsy. Clin
Neurophysiol. 2003;114:70–78
39. Gullapalli D, Fountain NB. Clinical correlation of
occipital intermittent rhythmic delta activity. J Clin
Neurophysiol. 2003. 20(1):35–41.
40. Riviello J, Foley C. The epileptiform significance of
intermittent rhythmic delta activity in childhood.
J Child Neurol. 1992;7(2):156.
41. Watemberg N, Linder I, Dabby R, Blumkin L, Lerman-
Sagie T. Clinical correlates of occipital intermittent
rhythmic delta activity (OIRDA) in children. Epilepsia.
2007;48:330–334.
42. Belsh J, Chokroverty S, Barabas G. Posterior
rhythmic slow activity in EEG after eye closure.
Electroencephalogr Clin Neurophysiol. 1983;56(6):
562–568.
43. Riviello JJ, Jr., Foley CM. The epileptiform significance
of intermittent rhythmic delta activity in childhood.
J Child Neurol. 1992;7(2):156–160.](https://image.slidesharecdn.com/atlasofpediatriceeg-230702062942-5219ce2c/75/Atlas-of-Pediatric-EEG-pdf-480-2048.jpg)


![7 Epileptic Encephalopathy 609
using subdural EEG in neocortical epilepsy. Epilepsia.
2006;47:1953–1957.
45. Kobayashi K, Oka M, Akiyama T, et al. Very fast
rhythmic activity on scalp EEG associated with epileptic
spasms. Epilepsia. 2004;45:488–496.
46. Jacobs J, et al. Interictal high-frequency oscillations
(80 500 Hz) are an indicator of seizure onset areas
independent of spikes in the human epileptic brain.
Epilepsia. 2008;49:1893–1907.
47. Bragin A, Jando G, Nadasdy Z, Hetke J, Wise K, Buzsaki
G. Gamma (40–100 Hz) oscillations in the hippocampus
of the behaving rat. J Neurosci. 1995;15:47–60.
48. Staba RJ, Wilson CL, Bragin A, Jhung D, Fried I, Engel
J Jr. High frequency oscillations recorded in human
medial temporal lobe during sleep. Ann Neurol.
2004;56:108–115.
49. Bragin A, Wilson CL, Almajano J, Mody I, Engel J Jr.
High-frequency oscillations after status epilepticus:
epileptogenesis and seizure genesis. Epilepsia.
2004;45:1017–1023.
50. Le Van Quyen M, Khalilov I, Ben-Ari Y. The dark side
of high-frequency oscillations in the developing brain.
Trends Neurosci. 2006;29(7):419–427.
51. Curio G, Mackert BM, Burghoff M, Koetitz R, Abraham-
Fuchs K, Harer W. Localization of evoked neuromagnetic
600-Hz activity in the cerebral somatosensory system.
Electroencephalogr Clin Neurophysiol. 1994;91:483–487.
52. Jones MS, MacDonald KD, Choi B, Dudek FE, Barth
DS. Intracellular correlates of fast (>200 Hz) electrical
oscillations in rat somatosensory cortex. J Neurophysiol.
2000;84:1505–1518.
53. Ikeda H, Wang Y, Okada Y. Origins of the somatic
N20 and high-frequency oscillations evoked by
trigeminal stimulation in the piglets. Clin Neurophysiol.
2005;116(4):827–841.
54. Gobbele R, Waberski TD, Simon H, et al. Different
origins of low- and high-frequency components
(600 Hz) of human somatosensory evoked potentials.
Clin Neurophysiol. 2004;115:927–937.
55. Curio G, Mackert BM, Burghoff M, et al. Somatotopic
source arrangement of 600 Hz oscillatory magnetic
fields at the human primary somatosensory hand cortex.
Neurosci Lett. 1997;234:131–134.
56. Staba RJ, Wilson CL, Bragin A, Fried I, Engel J Jr.
Quantitative analysis of high frequency oscillations
(80–500 Hz) recorded in human epileptic hippocampus
and entorhinal cortex. J Neurophysiol. 2002a;88:1743–1752.
57. Jirsch JD, Urrestarazu E, LeVan P, Olivier A, Dubeau F,
Gotman J. High-frequency oscillations during human
focal seizures. Brain. 2006;129:1593–1608.
58. Urrestarazu E, Jirsch JD, LeVan P, Hall J, Avoli M,
Dubeau F, et al. Highfrequency intracerebral EEG activity
(100-500 Hz) following interictal spikes. Epilepsia.
2006;47:1465–1476.
59. Ruggieri M, Iannetti P, Clementi M, et al. Neurofi
bromatosis type 1 and infantile spasms. Childs Nerv Syst.
2009;25(2):211–216.
60. Diebler C, Dulac O. Pediatric Neuroradiology: Cerebral
and Cranial Diseases. , New York, NY: Springer-Verlag
New York Inc. 1987.
61. Eeg-Olofsson O. The genetics of benign childhood
epilepsy with centro-temporal spikes. In: Berkovic SF,
Genton P, Hirsch E, et al., eds. Genetics of Focal Epilepsies:
Clinical Aspects and Molecular Biology. London: John
Libbey; 1999:35.
62. Huson S,Harper P, Compston D. Von Recklinghausen
neurofibromatosis: a clinical and population study in
south-east Wales. Brain. 1988;111(6):1355.
63. Fois A, Tiné A, Pavone L. Infantile spasms in patients
with neurofibromatosis type 1. Childs Nerv Syst.
1994;10(3):176–179.
64. Chugani HT, Shields WD, Shewmon DA, Olson DM,
Phelps ME, Peacock WJ. Infantile spasms: I. PET
identifies focal cortical dysgenesis in cryptogenic cases
for surgical treatment. Ann Neurol. 1990;27:406–413.
65. Chugani HT, Shewmon DA, Shields WD, et al.
Surgery for intractable infantile spasms: neuroimaging
perspectives. Epilepsia. 1993;34:764–771.
66. Wyllie E, Comair YG, Kotagal P, Raja S, Ruggieri P.
Epilepsy surgery in infants. Epilepsia. 1996a;37:
625–637.
67. Kresk P, Tichy M, Belsan T, Zamencnik J, Paulas L,
Faladova L, et al. Lifesaving epilepsy surgery for status
epilepticus caused by cortical dysplasia. Epileptic Disord.
2002;4:203–208.
68. Asano E, Juhasz C, Shah A, et al. Origin and propagation
of epileptic spasms delineated on electrocorticography.
Epilepsia 2005;46:1086–1097.
69. Haginoya K, Kon K, Takayanagi M, et al. Heterogeneity
of ictal SPECT findings in nine cases of West syndrome.
Epilepsia. 1998;39(suppl 5):26–29.
70. Lee CL, Frost JD, Jr., Swann JW, Hrachovy RA. A new
animal model of infantile spasms with unprovoked
persistent seizures. Epilepsia. 2008;49:298–307.
71. Mori K, Toda Y, Hashimoto T, Miyazaki M, Saijo T,
Ito H, Fujii E, Yamaue T, Kuroda Y. Patients with West
syndrome whose ICTAL SPECT showed focal cortical
hyperperfusion. Brain Dev. 2007;29:202–209.
72. Kramer U, Sue W, Mikati M. Focal features in West
syndrome indicating candidacy for surgery. Pediatr
Neurol. 1997;16(3):213–217.
73. Cusmai R, Ricci S, Pinard JM, Plouin P, Fariello G, Dulac
O. West syndrome due to perinatal insults. Epilepsia.
1993;34:738–742.
74. Okumura A, Hayakawa F, Kuno K, Watanabe K.
Periventricular leukomalacia and WEST syndrome. Dev
Med Child Neurol. 1996;38:13–18.
75. Ozawa H, Hashimoto T, Endo T, Kato T, Furusho J, Suzuki
Y, Takada E, Ogawa Y, Takashima S. West syndrome with
periventricular leukomalacia: a morphometric MRI study.
Pediatr Neurol. 1998;19:358–363.
76. Riikonen R. Infantile spasms: infectious disorders.
Neuropediatrics. 1993;24(5):274–280.
77. Mailles A, Vaillant V, Stahl JP. [Infectious encephalitis
in France from 2000 to 2002: the hospital database
is a valuable but limited source of information for
epidemiological studies]. Med Mal Infect. 2007;37(2):
95–102.
78. Misra UK, Tan CT, Kalita J. Viral encephalitis and
epilepsy. Epilepsia. 2008;49 Suppl 6:13–18.
79. Halász P, Janszky J, Barcs G, Szucs A. Generalised
paroxysmal fast activity (GPFA) is not always a sign of
malignant epileptic encephalopathy. Seizure Eur J Epilepsy.
2004;13(4): 270–276.
80. Steriade M, and Contreras D. Spike-wave complexes
and fast components of cortically generated seizures.
I. Role of neocortex and thalamus. J Neurophysiol.
1998;80:1439–1455.
81. Cats EA, Kho KH, Van Nieuwenhuizen O, Van Veelen
CW, Gosselaar PH, and PC Van Rijen PC: Seizure
freedom after functional hemispherectomy and a
possible role for the insular cortex: the Dutch experience.
J Neurosurg. 2007;107(4 suppl):275–280.
82. Mittal S, Farmer JP, Rosenblatt B, et al. Intractable
epilepsy after a functional hemispherectomy: important
lessons from an unusual case: case report. J Neurosurg.
2001;43:510–514.
83. Viani F, Romeo A, Mastrangelo M, Viri M. Infantile
spasms combined with partial seizures: electroclinical
study of eleven cases. Ital J Neurol Sci. 1994;15:
463–471.](https://image.slidesharecdn.com/atlasofpediatriceeg-230702062942-5219ce2c/75/Atlas-of-Pediatric-EEG-pdf-622-2048.jpg)
![7
610 Epileptic Encephalopathy
84. Ikeda A, Ohara S, Matsumoto R, Kunieda T, Nagamine T,
Miyamoto S, et al. Role of primary sensorimotor cortices
in generating inhibitory motor response in humans.
Brain. 2000;123:1710–1721.
85. Mader E, Jr, Fisch BJ, Carey ME, Villemarette-Pittman
NR. Ictal onset slow potential shifts recorded with
hippocampal depth electrodes. Neurol Clin Neurophysiol.
2005;4:1–12.
86. Ikeda A, Taki W, Kunieda T, Terada K, Mikuni N,
Nagamine T, et al. Focal ictal direct current shifts
in human epilepsy as studied by subdural and scalp
recording. Brain. 1999a;122:827–838.
87. Rodin E, Modur P. Ictal intracranial infraslow
EEG activity. Clin Neurophysiol. 2008;119(10):
2188–2200.
88. Rodin E, Constantino T, vanOrman C, et al. EEG
Infraslow activity in absence and partial seizures.
Clin EEG Neurosci. 2008a;39:12–19.
89. Rodin E, Constantino T, Rampp S, Modur P. Seizure
onset determination. J Clin Neurophysiol. 2009;26:1–12.
90. Ikeda A, Yazawa S, Kunieda T, Araki K, Aoki T, Hattori
H, Taki W, Shibasaki H. Scalp-recorded, ictal focal
DC shift in a patient with tonic seizure. Epilepsia.
1997;38:1350—1354.
91. Vanhatalo S, Holmes M, Tallgren P, et al. Very slow
EEG responses lateralize temporal lobe seizures.
An evaluation of non-invasive DC-EEG. Neurology.
2003;60(7):1098–1104.
92. Ikeda A. DC recordings to localize the ictal onset zone.
In: Luders H, ed. Textbook of Epilepsy Surgery. London:
Informa; 2008:695–666.
93. Hrachovy RA, Frost JD Jr, Kellaway P, et al. A controlled
study of prednisone therapy in infantile spasms. Epilepsia.
1979;20:403–477.
94. Li LM, Dubeau F, Andermann F, Fish DR, Watson C,
Cascino GD, et al. Periventricular nodular heterotopia
and intractable temporal lobe epilepsy: poor outcome
after temporal lobe resection. Ann Neurol. 1997;41:
662–668.
95. d’Orsi G, Tinuper P, Bisulli F, Zaniboni A, Bernardi B,
Rubboli G, et al. Clinical features and long term outcome
of epilepsy in periventricular nodular heterotopia. Simple
compared with plus forms. J Neurol Neurosurg Psychiatry.
2004;75:873–878.
96. Battaglia G, Franceschetti S, Chiapparini L, Freri
E, Bassanini S, Giavazzi A, Finardi A, Taroni F,
Granata T. Electroencephalographic recordings of
focal seizures in patients affected by periventricular
nodular heterotopia: role of the heterotopic nodules
in the genesis of epileptic discharges. J Child Neurol.
2005;20:369–377.
97. Dubeau F, Tampieri D, Lee N, Andermann E, Carpeneter
S, LeBlanc R, et al. Periventricular and subcortical
nodular heterotopia. A study of 33 patients. Brain.
1995;118:1273–1287.
98. Aghakhani Y, Kinay D, Gotman J, Soualmi L,
Andermann F, Olivier A, et al. The role of periventricular
nodular heterotopia in epileptogenesis. Brain.
2005;128:641–651.
99. Kobayashi K, Oka M, Akiyama T, et al. Very fast
rhythmic activity on scalp EEG associated with epileptic
spasms. Epilepsia. 2004;45:488–496.
100. Watanabe K. Recent advances and some problems in
the delineation of epileptic syndromes in children.
Brain Dev. 1996;18(6):423–437.
101. Watanabe K, Negoro T, Okumura A. Symptomatology of
infantile spasms. Brain Dev. 2001;23(7):453–466.
102. So N. Mesial frontal epilepsy. Epilepsia. 2007;39(s4):
S49–S61.
103. Arzimanoglou A, French J, Blume WT, Cross JH, Ernst
JP, Feucht M, Genton P, Guerrini R, Kluger G, Pellock
JM, Perucca E, Wheless JW. Lennox-Gastaut syndrome:
a consensus approach on diagnosis, assessment,
management, and trial methodology. Lancet Neurol.
2009;8:82–93.
104. Blume WT, David RB, Gomez MR. Generalized
sharp and slow wave complexes. Associated clinical
features and long-term follow-up. Brain. 1973;96(2):
289–306.
105. Markand ON. Slow spike-wave activity in EEG and
associated clinical features: often called 'Lennox' or
'Lennox-Gastaut' syndrome. Neurology. 1977;27(8):
746–757.
106. Markand O. Lennox-Gastaut syndrome (childhood
epileptic encephalopathy). J Clin Neurophysiol.
2003;20(6):426.
107. Niedemeyer E. Epileptic seizure disorders. In:
Niedermeyer E, Da Silva F, eds. Electroencephalography:
Basic Principles, Clinical Applications, and Related Fields.
Amsterdams: Lippincott Williams & Wilkins; 2005.
108. C.A. Tassinari and G. Ambrosetto, Tonic seizures in the
Lennox-Gastaut syndrome: semiology and differential
diagnosis. In: Degan R, ed. The Lennox-Gastaut
Syndrome. New York: Alan R. Liss; 1988:109–124.
109. Beaumanoir A. The Lennox-Gastaut syndrome: a
personal study. Electroencephalogr Clin Neurophysiol
Suppl. 1982;35:85–99.
110. Gabor A, Seyal M. Effect of sleep on the electrographic
manifestations of epilepsy. J Clin Neurophysiol.
1986;3(1):23.
111. Brenner RP, Atkinson R. Generalized paroxysmal fast
activity: electroencephalographic and clinical features.
Ann Neurol. 1982;11(4):386–390.
112. Brenner R, Atkinson R. Generalized paroxysmal fast
activity: electroencephalographic and clinical features.
Ann Neurol. 2004;11(4):386–390.
113. Halász P, Janszky J, Barcs G, Szucs A. Generalised
paroxysmal fast activity (GPFA) is not always a sign
of malignant epileptic encephalopathy. Seizure Eur J
Epilepsy. 2004;13(4):270–276.
114. Markand ON. Lennox-Gastaut syndrome (childhood
epileptic encephalopathy). J Clin Neurophysiol.
2003;20(6):426–441.
115. Brenner RP, Atkinson R. Generalized paroxysmal fast
activity: electroencephalographic and clinical features.
Ann Neurol. 1982;11:386–390.
116. Hrachovy RA, Frost JD, Jr. The EEG in selected
generalized seizures. J Clin Neurophysiol. 2006;23(4):312.
117. Horita H, Kumagai K, Maekawa K. Overnight
polygraphic study of Lennox-Gastaut syndrome. Brain
Dev. 1987;9(6):627.
118. Gastaut H, Tassinari CA. (1975) Epilepsies. In: Remond
A, ed. Handbook of electroencephalography and clinical
neurophysiology, vol. 13A. Amsterdam: Elsevier, 39–45.
119. Angelini L, Broggi G, Riva D and Solero CL, A case
of Lennox–Gastaut syndrome successfully treated by
removal of a parieto-temporal astrocytoma. Epilepsia.
1979;20:665–669.
120. Ishikawa T, Yamada K, Kanayama M. A case of Lennox-
Gastaut syndrome improved remarkably by surgical
treatment of a porencephalic cyst: a consideration on the
generalized corticoreticular epilepsy [Japanese]. No To
Hattatsu. 1983;9:356–365.
121. Quarato PP, Gennaro GD, Manfredi M, Esposito V:
Atypical Lennox-Gastaut syndrome successfully treated
with removal of a parietal dysembryoplastic tumour.
Seizure. 2002;11:325–329.
122. Beaumanoir A, Blume WT. The Lennox-Gastaut
syndrome. In: Beaumanoir A, Dravet C, eds. Epileptic
Syndromes in Infancy, Childhood and Adolescence.
Montrouge, France: John Libbey Eurotext. 2005:125–148.](https://image.slidesharecdn.com/atlasofpediatriceeg-230702062942-5219ce2c/75/Atlas-of-Pediatric-EEG-pdf-623-2048.jpg)


![8
674 Generalized Epilepsy
41. Doose H. EEG in Childhood Epilepsy. 1st ed. Montrouge,
France; John Libbey; 2003 Eurotext.
42. Gastaut H, Regis H. On the subject of Lennox's"
akinetic" petit mal. in memory of WG Lennox. Epilepsia.
1961;2:298.
43. Guerrini R, Parmeggiani L, Bonanni P, Kaminska
A, Dulac O. Myoclonic astatic epilepsy. In: Roger J,
Bureau M, Dravet C, Genton P, Tassinari CA, Wolf
P, eds. Epilepsy Syndromes in Infancy, Childhood and
Adolescence. Montrouge: John Libbey Eurotext Ltd;
2005:115–124.
44. Ohtahara S, Yamatogi Y. Epilepsy with myoclonic-astatic
seizures. Epilepsies. 2000:223.
45. Dravet C, Bureau M, Oguni H, Fukuyama Y, Cokar O.
(2005) Severe myoclonic epilepsy in infancy (Dravet
syndrome). In: Roger J, Bureau M, Dravet C, Genton P,
Tassinari CA, Wolf P, eds. Epileptic Syndromes In Infancy,
Childhood and AdolescenceMountrouge: John Libbey
Eurotext Ltd; 2005:89–113.
46. Guerrini R, Aicardi J. Epileptic encephalopathies with
myoclonic seizures in infants and children (severe
myoclonic epilepsy and myoclonic-astatic epilepsy).
J Clin Neurophysiol. 2003;20(6):449.
47. Laan LA, Vein AA. Angelman syndrome: is there a
characteristic EEG? Brain Dev. 2005;27(2):80–87.
48. Williams CA., Beaudet AL, Clayton-Smith J, Knoll JH,
Kyllerman M, Laan LA, Magenis RE, Moncla A, Schinzel
AA, Summers JA, et al. Angelman syndrome 2005:
updated consensus for diagnostic criteria. Am J Med
Genet A. 2006;140:413–418.
49. Korff C, Kelley K, Nordli Jr D. Notched delta, phenotype,
and Angelman syndrome. J Clin Neurophysiol.
2005;22(4):238.
50. Guerrini R, Carrozzo R, Rinaldi R, Bonanni P. Angelman
syndrome: etiology, clinical features, diagnosis, and
management of symptoms. Pediatr Drugs. 2003;5:647–661.
51. Glaze DG. Neurophysiology of Rett syndrome. J Child
Neurol. 2005;20(9):740–746.
52. Niedermeyer E, Rett A, Renner H, Murphy M, Naidu S
Rett syndrome and the electroencephalogram. Am J Med
Genet Suppl. 1986;1:195–199.
53. Palmini A, Andermann F, Olivier A, Tampieri D,
Robitaille Y. Focal neuronal migration disorders and
intractable partial epilepsy: results of surgical treatment.
Ann Neurol. 1991;30:750–757.
54. Granata T, Battaglia G, D'Incerti L, et al. Double cortex
syndrome: electroclinical study of three cases. Ital J
Neurol Sci. 1994;15(1):15–23.
55. Grant AC, Rho JM. Ictal EEG patterns in band
heterotopia. Epilepsia. 2002;43(4):403–407.
56. Kato M, Dobyns W. Lissencephaly and the molecular
basis of neuronal migration. Hum Mol Genet.
2003;12(Rev 1):R89.
57. Gastaut H, Pinsard M, Raybaud O, et al. Lissencephaly
(agyria-pachygyria): clinical fi ndings and serial
EEG studies. Dev Med Child Neurol. 1987;29(2):
167–180.
58. Worle H, Keimer R, Kohler B. [Miller-Dieker syndrome
(type I lissencephaly) with specific EEG changes].
Monatsschr Kinderheilkd. 1990;138(9):615–618.
59. De Rijk-van Andel J, Arts W, De Weerd A. EEG
and evoked potentials in a series of 21 patients with
lissencephaly type I. Neuropediatrics. 1992;23(1):4–9.
60. Canafoglia L, Franceschetti S, Antozzi C, Carrara
F, Farina L, Granata T, et al. Epileptic phenotypes
associated with mitochondrial disorders. Neurology.
2001;56:1340–1346.
61. Acharya J, Satishchandra P, Shankar S. Familial
progressive myoclonus epilepsy: clinical and
electrophysiologic observations. Epilepsia.
1995;36(5):429–434.
62. Noachtar S, Arnold S eds. Clonic seizures. In: Lüders
H, Noachtar S, eds. Epileptic Seizures: Pathophysiology
and Clinical Semiology. Churchill Livingstone
Philadelphia: Saunders; 2000.
63. Nabbout R, Soufflet C, Plouin P, Dulac O. Pyridoxine
dependent-epilepsy: a suggestive electroclinical pattern.
Arch Dis Child Fetal Neonatal Ed. 1999;81:F125–F129.
64. Mikati M, Trevathan E, Krishnamoorthy K, et al.
Pyridoxine dependent epilepsy: EEG investigations
and long-term follow-up. EEG Clin Neurophysiol.
1991;78:215–221.
65. Pampiglione G, Harden A. So-called neuronal ceroid
lipofuscinosis. Neurophysiological studies in 60 children.
J Neurol Neurosurg Psychiatry. 1977;40(4):323–330.
66. Blume W, Kaibara M. Atlas of Pediatric Encephalography.
Philadelphia, PA: Lippincott-Raven; 1999.
67. Remler, Bradley W. Falls and drop attacks. In: Bradley
W, ed. Neurology in Clinical Practice. Churchill
Livingstone Philadelphia: Taylor & Francis; 1996.
68. Raieli V, Puma D, Brighina F. Role of neurophysiology
in the clinical practice of primary pediatric headaches.
Drug Dev Res. 2007;68(7).
69. Pavese N, Canapicchi R, Nuti A, et al. White matter
MRI hyperintensities in a hundred and twenty-nine
consecutive migraine patients. Cephalalgia. 1994;14:
312–345.
70. DiMario Jr F. Breath-holding spells in childhood. Arch
Pediatr Adolesc Med. 1992;146(1):125.
71. Low N, Gibbs E, Gibbs F. Electroencephalographic
findings in breath holding spells. Pediatrics.
1955;15(5):595.
72. Gastaut H, Fischer-Williams M. Electro-
encephalographic study of syncope; its differentiation
from epilepsy. Lancet. 1957;273(7004):1018.
73. Brenner R. Electroencephalography in syncope. J Clin
Neurophysiol. 1997;14(3):197.
74. Emery ES. Status epilepticus secondary to breath-holding
and pallid syncopal spells. Neurology. 1990;40:859.
75. Moorjani B, Rothner A, Kotagal P. Breath-holding spells
and prolonged seizures. Ann Neurol. 1995;38:512–513.
76. Stephenson JBP. Fits and Faints. London: Mac Keith
Press; 1990.
77. Breningstall G. Breath-holding spells. Pediatr Neurol.
1996;14(2):91–97.
78. Fogoros R. Cardiac arrhythmias. Syncope and stroke.
Neurologic Clinics. 1993;11(2):375.
79. Kapoor W, Hanusa B. Is syncope a risk factor for poor
outcomes? Comparison of patients with and without
syncope. Am J Med. 1996;100(6):646–655.
80. Morrell M. Differential diagnosis of seizures. Neurologic
Clinics. 1993;11(4):737.
81. Abboud F. Neurocardiogenic syncope. N Engl J Med.
1993;328(15):1117.
82. Schott G, McLeod A, Jewitt D. Cardiac arrhythmias
that masquerade as epilepsy. BMJ. 1977;1(6074):1454.
83. Ballardie F, Murphy R, Davis J. Epilepsy: a presentation
of the Romano-Ward syndrome. BMJ. 1983;287(6396):896.
84. Blumhardt L. Ambulatory ECG and EEG monitoring of
patients with blackouts. Br J Hosp Med. 1986;36(5):354.
85. Jennett B, Gleave J, Wilson P. Brain death in three
neurosurgical units. BMJ. 1981;282(6263):533.
86. Maulsby R, Kellaway P. Transient hypoxic crises in
children. In: Neurological and Electroencephalographic
Correlative Studies in Infancy. 1964:349–360.](https://image.slidesharecdn.com/atlasofpediatriceeg-230702062942-5219ce2c/75/Atlas-of-Pediatric-EEG-pdf-687-2048.jpg)
![675
Focal Epilepsy
Interictal epileptiform discharges
(IEDs) associated with epilepsy
With clinical correlation, the high sensitivity and the
䡲
specificity of IEDs for seizure disorders support the
use of IEDs as the electrophysiological signature
of an epileptogenic brain.
IEDs represent the macroscopic field created by
䡲
the summation of potentials from pathologically
synchronized bursting neurons.
Common types of IEDs
Spikes, polyspikes,
䡲 sharp waves, and spike-and-
slow-wave complexes, which can be either focal or
generalized.
The main types of generalized IED patterns are:
䡲
3-Hz spike and slow wave
䊳
Sharp and slow wave
䊳
Atypical repetitive spike and slow wave
䊳
Multiple spike and slow wave
䊳
Paroxysmal fast activity (PFA)
䊳
Definition of IEDs and features
The epileptiform sharp waves and spikes are:
䡲
Transient waveforms that may repeat, and arise
䊳
abruptly out of the EEG background activity.
The waveforms are asymmetric with more than
䊳
one phase (usually two or three). In contrast,
nonepileptiform, sharply contoured transients such
as wicket waves are often approximately symmetric.
The epileptiform spikes and sharp waves are often
䡲
followed by a smoothly contoured slow wave
(spike-and-slow-wave complexes), which disrupts
the ongoing EEG background rhythm.
The sharp wave or spike is produced by an abrupt
䡲
change in voltage polarity that occurs over several
milliseconds. The duration of an epileptiform sharp
wave is between 70 and 200 msec, and the duration
of spikes is less than 70 msec, although the distinction
is of unclear clinical importance.
The epileptiform discharge should have a physiologic
䡲
field and not be confined to a single electrode except
in newborn.
Besides interictal epileptiform spikes and sharp waves,
䡲
intermittent rhythmic delta activity over the temporal
region (TIRDA) has similar specificity for temporal lobe
epilepsy.
There are also
䡲 localized, periodic patterns of IEDs that
are associated with seizures. These periodic patterns
of IEDs can be lateralized to one hemisphere, as seen
in periodic lateralized epileptiform discharges (PLEDs),
or can be bilateral or multifocal (BiPLEDs).
Types of interictal EEG patterns
Spikes, spike-wave discharges, polyspikes, or sharp
䡲
waves (interictal epileptiform discharges [IEDs]).
Broad
䡲 sharp or polyphasic sharp waves (duration >
200 msec).
Periodic lateralized epileptiform activity (PLEDs) or
䡲
bilateral independent periodic lateralized epileptiform
activity (BiPLEDs) in an acute/subacute cerebral insult.
Paroxysmal fast activity (PFA)
䡲 —most commonly in
Lennox-Gastaut syndrome.
Hypsarrhythmia in infantile spasm (hemihypsarrhythmia
䡲
in focal, symptomatic infantile spasm).
Temporal intermittent rhythmic delta activity (TIRDA)
䡲
in mesial temporal epilepsy.
Occipital intermittent rhythmic delta activity (OIRDA)
䡲
in generalized epilepsy, especially absence epilepsy.
Frontal intermittent rhythmic delta activity
䡲
(FIRDA) rarely represents IED.
Continuous, near-continuous, or long trains of
䡲
localized spikes or rhythmic sharp waves (intrinsic
epileptogenicity) in structural abnormalities,
especially focal cortical dysplasia (FCD).
Regional polyspikes (especially in extratemporal
䡲
region) are highly associated with FCD (80%).
Focal low-voltage fast activity or electrodecrement
䡲
in scalp EEG corresponding to high-frequency
oscillation (HFO) in intracranial EEG.
9](https://image.slidesharecdn.com/atlasofpediatriceeg-230702062942-5219ce2c/75/Atlas-of-Pediatric-EEG-pdf-688-2048.jpg)


![Pediatric neurology, a color handbook bale jr., james f. [srg]](https://cdn.slidesharecdn.com/ss_thumbnails/pediatricneurologyacolorhandbook-balejr-150430011139-conversion-gate01-thumbnail.jpg?width=640&height=640&fit=bounds)


