Downloaded 521 times


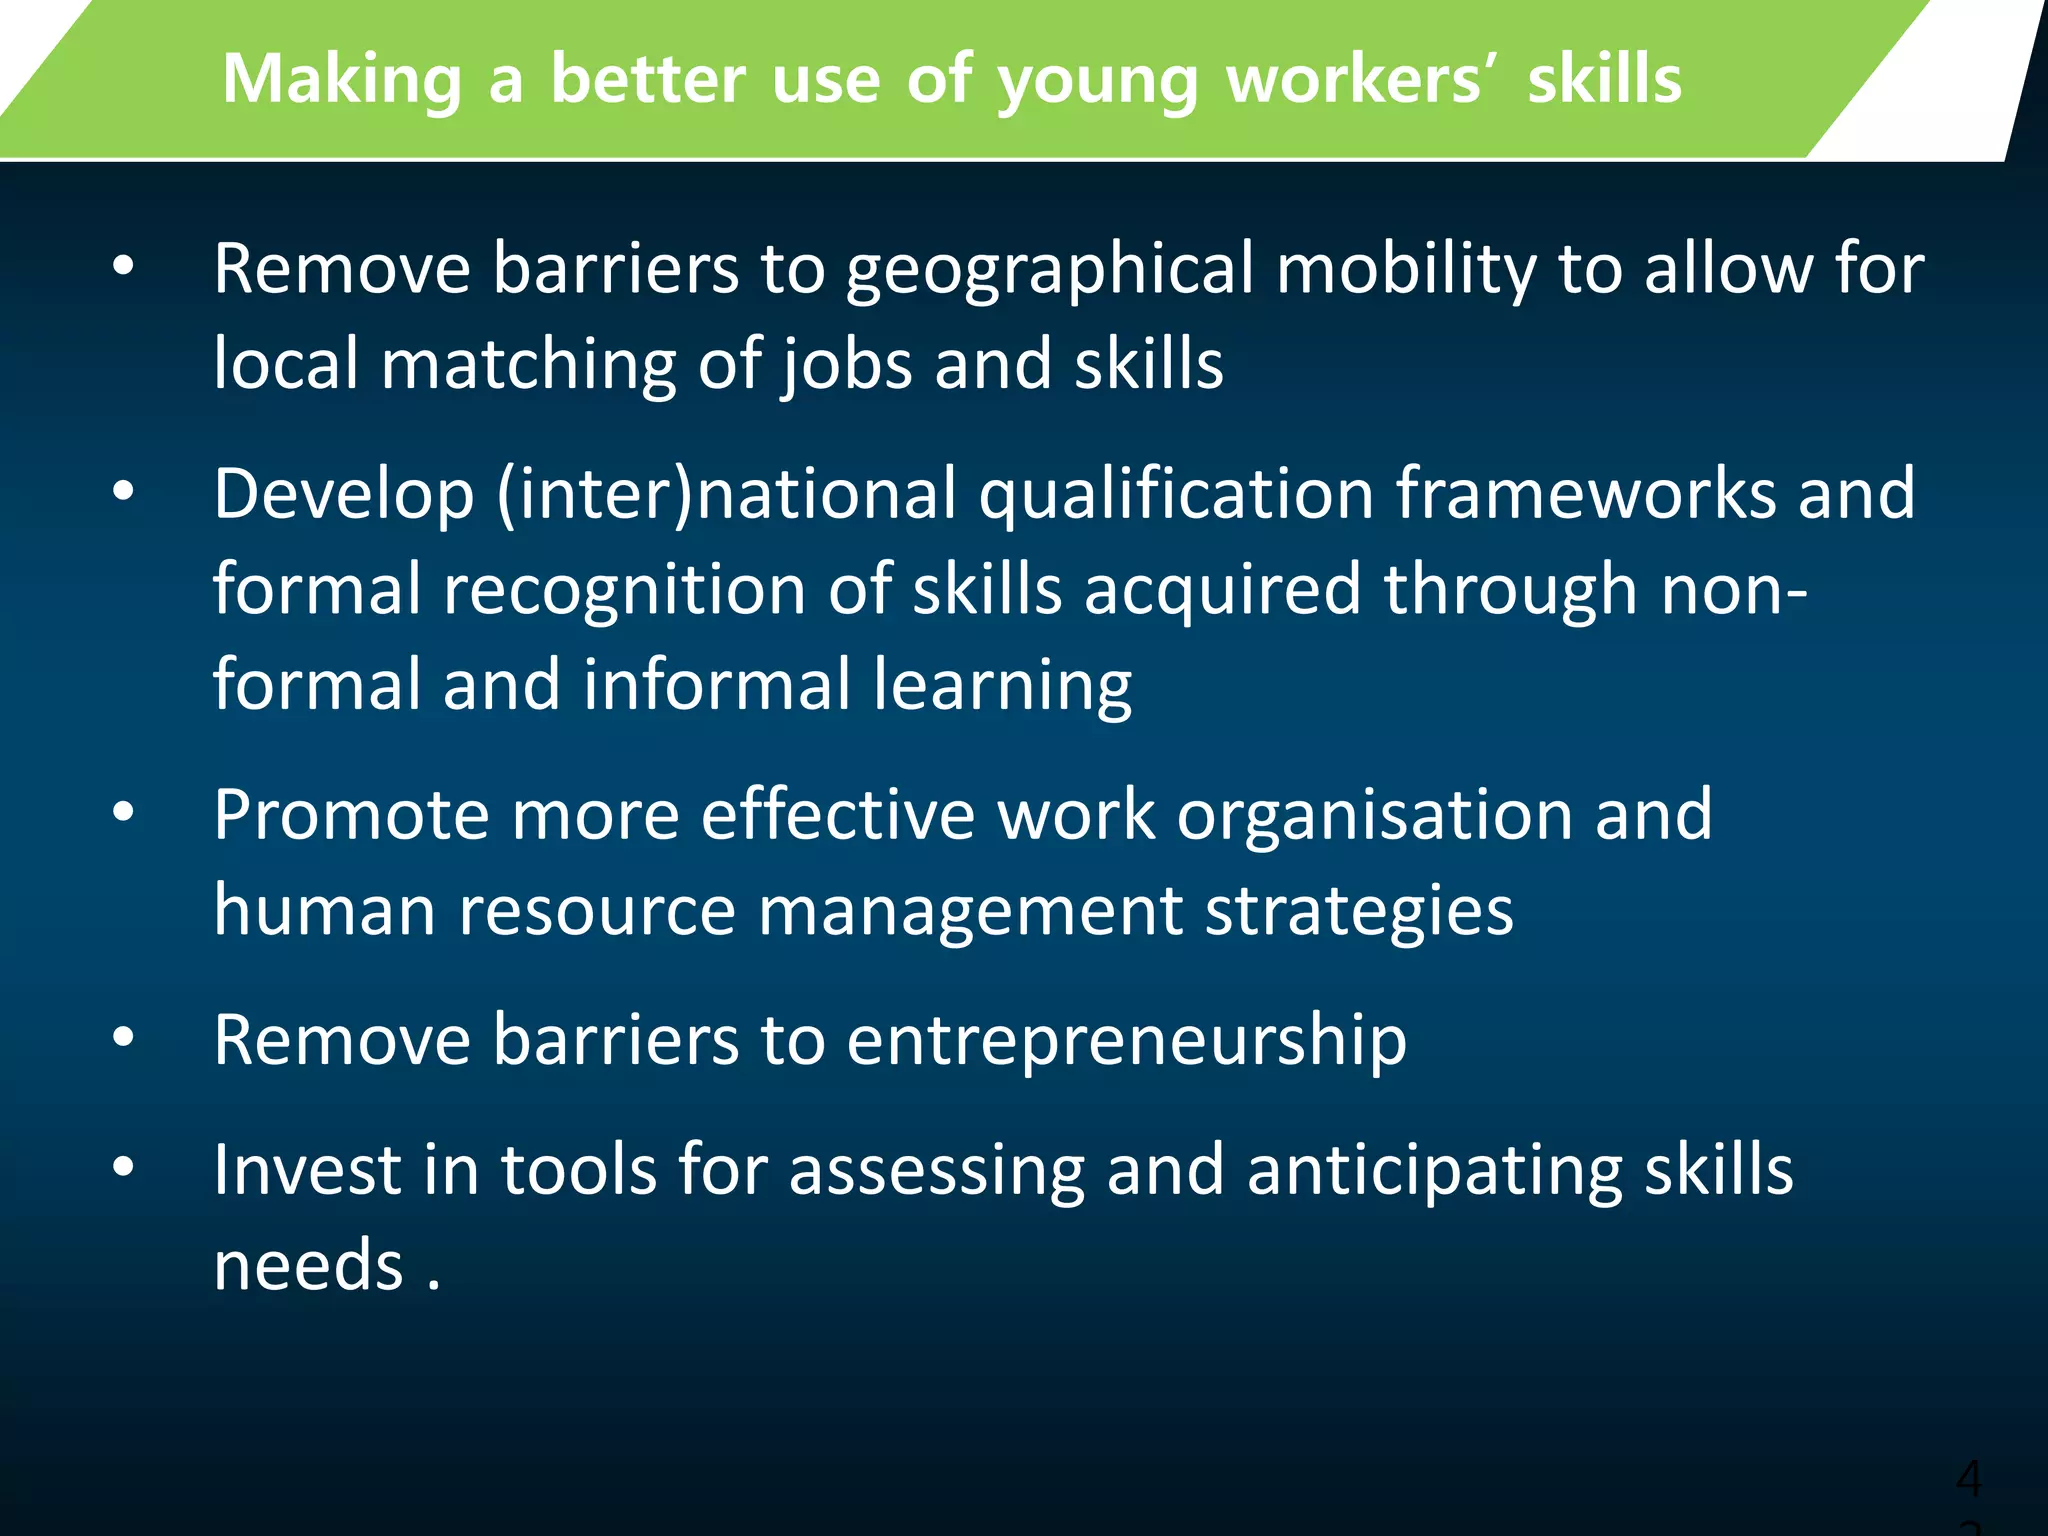

The OECD's Skills Outlook 2015 report highlights the challenges young people face in transitioning to the labor market, particularly those who are NEET (Not in Education, Employment, or Training). It emphasizes the need for improved education and skills training, integration into the labor market, and tailored support for disengaged youth, while also advocating for the involvement of employers in the educational process. The report concludes by suggesting removing barriers to employment and enhancing the use of young workers' skills to better match labor market demands.


