Download to read offline


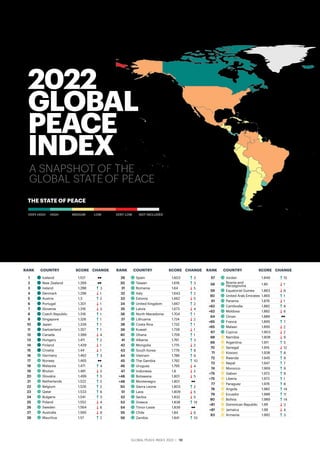


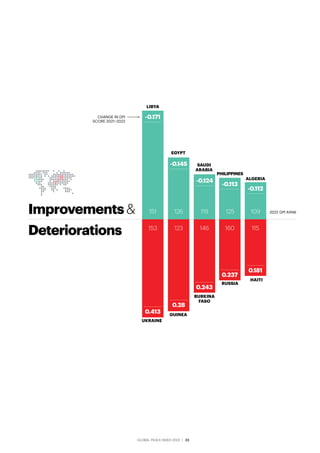
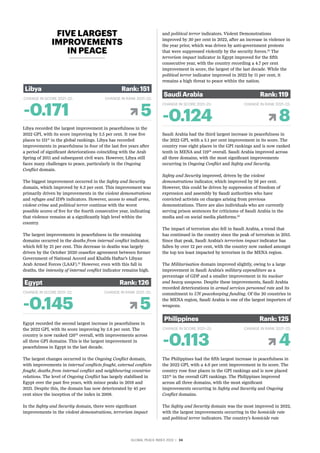


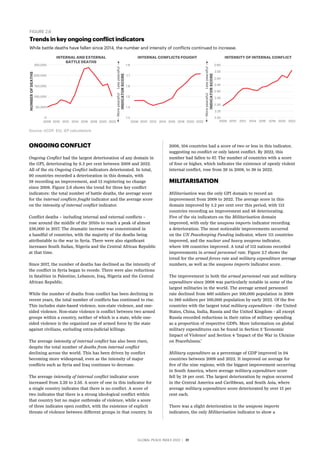


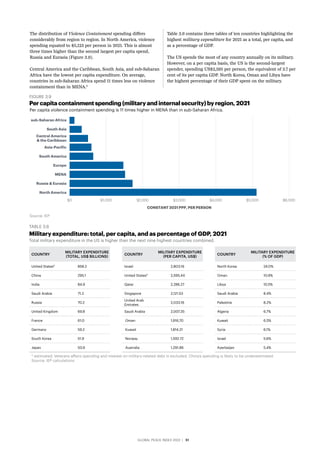


The 2022 Global Peace Index report found that average global peacefulness deteriorated for the eleventh time in the past fourteen years. Iceland remained the most peaceful country while Afghanistan was the least peaceful for the fifth consecutive year. Russia and Ukraine experienced the largest deteriorations in peacefulness due to conflict. Five of the nine regions became more peaceful, led by improvements in South Asia and the Middle East & North Africa. However, the conflict between Russia and Ukraine caused the largest regional deterioration in Russia & Eurasia. The economic impact of violence increased to $16.5 trillion in 2021, equivalent to 10% of global GDP.


![[Ms. Schippa] What We Can Learn From Measuring Peace](https://cdn.slidesharecdn.com/ss_thumbnails/measuringpeacecschippakualalumpur-131218140300-phpapp02-thumbnail.jpg?width=640&height=640&fit=bounds)


![[DSC Europe 25] Mijat Kustudic - Building Financial Intelligence with AI Agen...](https://cdn.slidesharecdn.com/ss_thumbnails/38y2lb5lse6wstegtvas-3-mijat-kustudic-building-financial-intelligence-with-ai-agents-260114111931-1a4783ce-thumbnail.jpg?width=640&height=640&fit=bounds)


![[DSC Europe 25] Slobodan Dolinic - Smart and Intelligent Green Region.pptx](https://cdn.slidesharecdn.com/ss_thumbnails/0bribinjsp6ghwtvsvor-2-sigre-slobodan-dolinic-260115093812-c9c10e90-thumbnail.jpg?width=640&height=640&fit=bounds)
![[DSC Europe 25] Ivica Milaric - The Future of Gaming and AI Tools.pptx](https://cdn.slidesharecdn.com/ss_thumbnails/tijgzsmgse2kj2y5pzzp-5-ivica-milaric-the-future-of-gaming-x-ai-tools-260114111931-87c2b3ac-thumbnail.jpg?width=640&height=640&fit=bounds)

