MSC White Paper Madison Monthly Solar Resource 1997 to 2014
1. Madison Solar Consulting Solar Brief
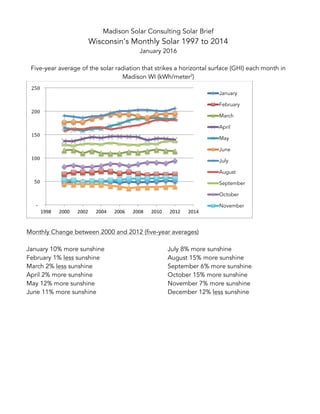
Wisconsin’s Monthly Solar 1997 to 2014
January 2016
Five-year average of the solar radiation that strikes a horizontal surface (GHI) each month in
Madison WI (kWh/meter2
)
Monthly Change between 2000 and 2012 (five-year averages)
January 10% more sunshine
February 1% less sunshine
March 2% less sunshine
April 2% more sunshine
May 12% more sunshine
June 11% more sunshine
July 8% more sunshine
August 15% more sunshine
September 6% more sunshine
October 15% more sunshine
November 7% more sunshine
December 12% less sunshine
-‐
50
100
150
200
250
1998
2000
2002
2004
2006
2008
2010
2012
2014
January
February
March
April
May
June
July
August
September
October
November
2. The annual solar resource increased by 7% between 2000 and 2012.
Conclusions
• It is getting sunnier
• The monthly change is very variable
o February, March are getting a little cloudier and December is getting very
much cloudier
o August and October are much sunnier, as are May and June
§ Annual utility peak demands are often in June and August
• Is this what climate change looks like?
• How long will this trend continue?
About the Global Horizontal Irradiance (GHI) Data
• The five-year average uses data from the year noted, the two years before and
the two years after, to smooth out the annual variation
• Data is from NREL
• GHI is modeled from collected data, observations and assumptions
• The Madison Airport has one of the highest quality data sets in the country
o The 1991 to 2010 data (and I assume 2011 to 2014 data) is considered to
be of the highest quality; having “low uncertainty”
• Global Horizontal Irradiance (GHI) units of watts per meter2
. The amount of solar
(direct and diffuse) radiation that strikes a one-meter square horizontal surface.
o There is no direct correlation between GHI and PV system output (it
depends on the orientation of the array, the temperature of the modules,
etc.)
1,340
1,360
1,380
1,400
1,420
1,440
1,460
1,480
1998
2000
2002
2004
2006
2008
2010
2012
2014
Five-Year Average Annual GHI Madison WI
(kWh/meter2)
3. Monthly Data (not averaged)
The solar radiation that strikes a horizontal surface (GHI) each month in Madison WI
1998 to 2014
(kWh/meter2
)
Niels Wolter
Madison Solar Consulting
Madison.solar@me.com
608.216.4452
Helping get solar installed including:
• Feasibility studies
• Grant writing
• Site assessment
• Grant review
• Economic analysis
• Electric rate analysis
• Environmental analysis
• Solar radiation analysis
• Managing RFP process
• Marketing support
• Owners agent
• Project management
• Solar policy
• Incentive program operations
-‐
50
100
150
200
250
1996
1998
2000
2002
2004
2006
2008
2010
2012
2014
2016
January
February
March
April
May
June
July
August
September
October
November
December