
Recommended
More Related Content
What's hot
What's hot (20)
Similar to ML whitepaper v0.2
Similar to ML whitepaper v0.2 (20)
More from Nathaniel Shimoni
More from Nathaniel Shimoni (6)
Recently uploaded
Recently uploaded (20)
ML whitepaper v0.2
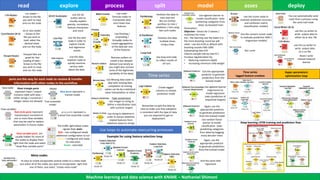
- 1. Use loops to automate reoccurring processes exploreread process split model asses deploy csv reader – brows to the file you wish to read and run the node xls or xlsx reader – brows to the file you wish to read, select the desired sheet and run the node Parquet files are great for fast loading of data – brows to the file you wish to read, and run the node The traffic light below nodes signals their state : Red – not configured needs additional configuration to run Yellow – configured and ready for execution Green - executed Use 2D-3D scatter plot to visually explore sparsity, correlation, feature-interaction and more Use the line plot node in order to explore trends and regression results Use the data explorer node to quickly examine various stats about the data Use math formula nodes to manipulate data and create new features Use Pivoting / Unpivoting / GroupBy nodes to create aggregations of the data per one of the features Remove outliers to create a less skewed dataset (use wisely as you might also remove some of the legitimate variability of the data) Use Missing data node to deal with missing data completion of missing values can be by a statistical value interpolation or other Type conversions: Use integer to string to define a classification task with numeric targets Partition the data to train and test We can further partition to train / validation / test using two such nodes Partition the data multiple times using a loop Use xgboost learner to model classification tasks (predicting categories from data) by boosted trees Parameters: Objective – binary for 2 classes / multiclass for more Eta – the learning rate the lower it is the more boosting round we will need – use eta=0.05 as default with boosting rounds=500-1000 Subsampling rate=0.8 Column sample rate by tree=0.7 Increase regularization by: • Reducing maximum depth • Increasing minimum child weight Use xgboost learner (regression) to model regression tasks (prediction of sequential targets) And the same with regression ports are the way for each node to receive & transfer information with other nodes in the workflow Use the scorer node to evaluate prediction accuracy and confusion matrix (classification models) Roc curve You can automatically send mails from a process using the send mail node use the csv writer to write output data to a csv file Meta nodes Use loop end node to collect results of all runs Use the appropriate predictor to generate predictions from the trained model Use string to datetime in order to extract datetime related features from datetime saved as strings Again, use the appropriate predictor to generate predictions from the trained model Use random forest learner to model classification tasks (predicting categories from data) by bagging many decision trees Again, use the appropriate predictor to generate predictions from the trained model Data table Flow variables Model Tree ensemble model Black triangle ports represent Input / output Contains table with data – either strings / numerical / integer values are allowed Red circle ports represent Input/output consisted of one or more flow variables that may be used to replace parameters in future nodes Blue ports represent a trained model grey ports represent a trained tree ensemble model Flow variable ports are usually hidden for most of the nodes to display them right click the node and select “show flow variable ports” use the csv writer to write output data to either xls or xlsx file Example for using feature selection loop Use the numeric scorer node to evaluate prediction MAE / (regression models) Its easy to create encapsulate several nodes to a meta-node Just select all of the nodes you want to encapsulate, right click one of them, and select “create meta-node” Time series Create lagged columns to imitate prediction mode Remember to split the data by time to make sure that validation is consistent with the type of data you are expected to get on deployment Read / write trained network learner Time series lagged feature creation Deep learning LSTM training and prediction flow Machine learning and data science with KNIME – Nathaniel Shimoni Hyper-parameters optimization loop