Denodo DataFest 2016: Comparing and Contrasting Data Virtualization With Data...
progress_DBBI-infographic_01-01
1. EXCEL FILES
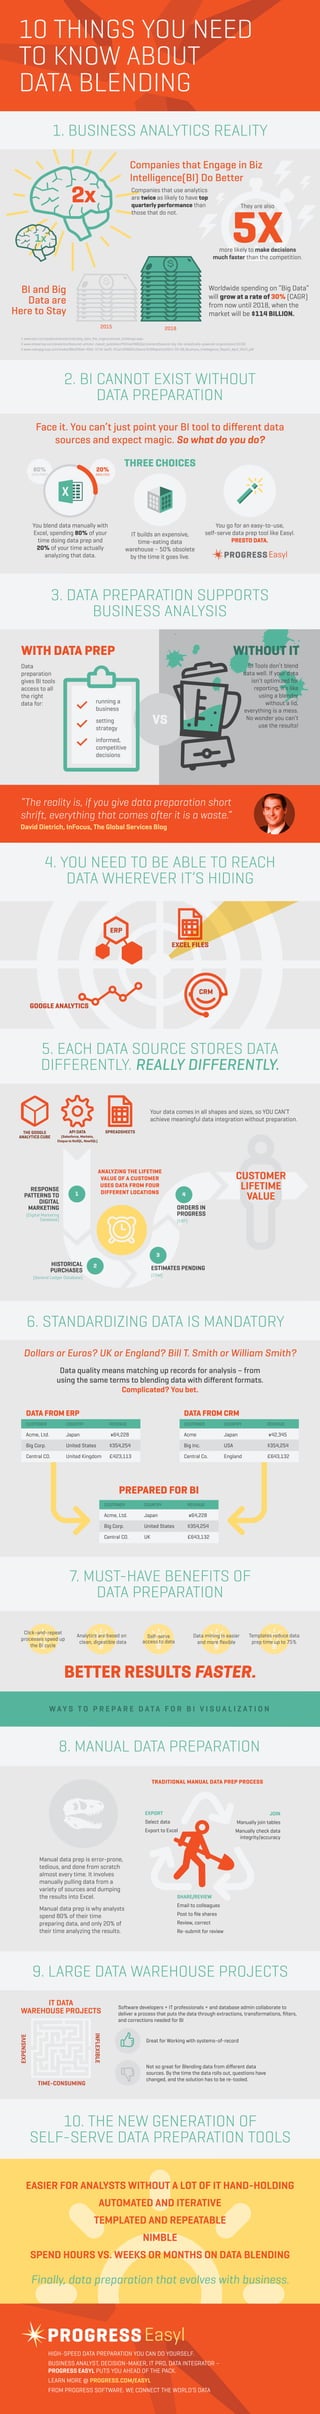
10 THINGS YOU NEED
TO KNOW ABOUT
DATA BLENDING
1. BUSINESS ANALYTICS REALITY
2. BI CANNOT EXIST WITHOUT
DATA PREPARATION
3. DATA PREPARATION SUPPORTS
BUSINESS ANALYSIS
4. YOU NEED TO BE ABLE TO REACH
DATA WHEREVER IT’S HIDING
5. EACH DATA SOURCE STORES DATA
DIFFERENTLY. REALLY DIFFERENTLY.
6. STANDARDIZING DATA IS MANDATORY
7. MUST-HAVE BENEFITS OF
DATA PREPARATION
8. MANUAL DATA PREPARATION
W A Y S T O P R E P A R E D ATA F O R B I V I S U A L I Z AT I O N
9. LARGE DATA WAREHOUSE PROJECTS
10. THE NEW GENERATION OF
SELF-SERVE DATA PREPARATION TOOLS
1 www.bain.com/publications/articles/big_data_the_organizational_challenge.aspx
2 www.atkearney.com/analytics/featured-article/-/asset_publisher/FNSUwH9BGQyt/content/beyond-big-the-analytically-powered-organization/10192
3 www.redcapgroup.com/media/98e342dd-420c-4716-be25-f21a14f46691/Sector%20Reports/2014-04-09_Business_Intellegence_Report_April_2014_pdf
Face it. You can’t just point your BI tool to different data
sources and expect magic. So what do you do?
You blend data manually with
Excel, spending 80% of your
time doing data prep and
20% of your time actually
analyzing that data.
IT builds an expensive,
time-eating data
warehouse – 50% obsolete
by the time it goes live.
You go for an easy-to-use,
self-serve data prep tool like Easyl.
PRESTO DATA.
WITH DATA PREP
Data
preparation
gives BI tools
access to all
the right
data for:
Your data comes in all shapes and sizes, so YOU CAN’T
achieve meaningful data integration without preparation.
Dollars or Euros? UK or England? Bill T. Smith or William Smith?
Data quality means matching up records for analysis – from
using the same terms to blending data with different formats.
Complicated? You bet.
EXPORT
Select data
Export to Excel
JOIN
Manually join tables
Manually check data
integrity/accuracy
SHARE/REVIEW
Email to colleagues
Post to file shares
Review, correct
Re-submit for review
Manual data prep is error-prone,
tedious, and done from scratch
almost every time. It involves
manually pulling data from a
variety of sources and dumping
the results into Excel.
Manual data prep is why analysts
spend 80% of their time
preparing data, and only 20% of
their time analyzing the results.
Software developers + IT professionals + and database admin collaborate to
deliver a process that puts the data through extractions, transformations, filters,
and corrections needed for BI
Great for Working with systems-of-record
Not so great for Blending data from different data
sources. By the time the data rolls out, questions have
changed, and the solution has to be re-tooled.
EASIER FOR ANALYSTS WITHOUT A LOT OF IT HAND-HOLDING
AUTOMATED AND ITERATIVE
TEMPLATED AND REPEATABLE
NIMBLE
SPEND HOURS VS. WEEKS OR MONTHS ON DATA BLENDING
Finally, data preparation that evolves with business.
FOOTER
2015 2018
2x
1x
Companies that Engage in Biz
Intelligence(BI) Do Better
Companies that use analytics
are twice as likely to have top
quarterly performance than
those that do not.
BI and Big
Data are
Here to Stay
Worldwide spending on “Big Data”
will grow at a rate of 30% (CAGR)
from now until 2018, when the
market will be $114 BILLION.
5Xmore likely to make decisions
much faster than the competition.
They are also
THREE CHOICES80%
DATA PREP
20%
ANALYSIS
Easyl
running a
business
setting
strategy
informed,
competitive
decisions
“The reality is, if you give data preparation short
shrift, everything that comes after it is a waste.”
David Dietrich, InFocus, The Global Services Blog
VS
WITHOUT IT
BI Tools don’t blend
data well. If your data
isn’t optimized for
reporting, it’s like
using a blender
without a lid,
everything is a mess.
No wonder you can’t
use the results!
CRM
ERP
GOOGLE ANALYTICS
BETTER RESULTS FASTER.
Click-and-repeat
processes speed up
the BI cycle
Analytics are based on
clean, digestible data
Templates reduce data
prep time up to 75%
Self-serve
access to data
Data mining is easier
and more flexible
THE GOOGLE
ANALYTICS CUBE
API DATA
(Salesforce, Marketo,
Eloqua to NoSQL, NewSQL)
SPREADSHEETS
ANALYZING THE LIFETIME
VALUE OF A CUSTOMER
USES DATA FROM FOUR
DIFFERENT LOCATIONS1
RESPONSE
PATTERNS TO
DIGITAL
MARKETING
(Digital Marketing
Database)
HISTORICAL
PURCHASES
(General Ledger Database)
ESTIMATES PENDING
(CRM)
2
3
ORDERS IN
PROGRESS
(ERP)
4
CUSTOMER
LIFETIME
VALUE
DATA FROM ERP
CUSTOMER COUNTRY REVENUE
Acme, Ltd. Japan ¥64,228
Big Corp. United States $354,254
Central CO. United Kingdom £423,113
DATA FROM CRM
CUSTOMER COUNTRY REVENUE
Acme Japan ¥42,345
Big Inc. USA $354,254
Central Co. England £643,132
CUSTOMER COUNTRY REVENUE
Acme, Ltd. Japan ¥64,228
Big Corp. United States $354,254
Central CO. UK £643,132
PREPARED FOR BI
TRADITIONAL MANUAL DATA PREP PROCESS
INFLEXIBLE
IT DATA
WAREHOUSE PROJECTS
EXPENSIVE
TIME-CONSUMING
HIGH-SPEED DATA PREPARATION YOU CAN DO YOURSELF.
BUSINESS ANALYST, DECISION-MAKER, IT PRO, DATA INTEGRATOR –
PROGRESS EASYL PUTS YOU AHEAD OF THE PACK.
LEARN MORE @ PROGRESS.COM/EASYL
FROM PROGRESS SOFTWARE. WE CONNECT THE WORLD’S DATA
Easyl