SlideShare a Scribd company logo
1 of 44
Download to read offline
№70/2021
Norwegian Journal of development of the International Science
ISSN 3453-9875
VOL.2
It was established in November 2016 with support from the Norwegian Academy of Science.
DESCRIPTION
The Scientific journal “Norwegian Journal of development of the International Science” is issued 24 times a year
and is a scientific publication on topical problems of science.
Editor in chief – Karin Kristiansen (University of Oslo, Norway)
The assistant of theeditor in chief – Olof Hansen
• James Smith (University of Birmingham, UK)
• Kristian Nilsen (University Centre in Svalbard, Norway)
• Arne Jensen (Norwegian University of Science and Technology, Norway)
• Sander Svein (University of Tromsø, Norway)
• Lena Meyer (University of Gothenburg, Sweden)
• Hans Rasmussen (University of Southern Denmark, Denmark)
• Chantal Girard (ESC Rennes School of Business, France)
• Ann Claes (University of Groningen, Netherlands)
• Ingrid Karlsen (University of Oslo, Norway)
• Terje Gruterson (Norwegian Institute of Public Health, Norway)
• Sander Langfjord (University Hospital, Norway)
• Fredrik Mardosas (Oslo and Akershus University College, Norway)
• Emil Berger (Ministry of Agriculture and Food, Norway)
• Sofie Olsen (BioFokus, Norway)
• Rolf Ulrich Becker (University of Duisburg-Essen, Germany)
• Lutz Jäncke (University of Zürich, Switzerland)
• Elizabeth Davies (University of Glasgow, UK)
• Chan Jiang(Peking University, China) and other independent experts
1000 copies
Norwegian Journal of development of the International Science
Iduns gate 4A, 0178, Oslo, Norway
email: publish@njd-iscience.com
site: http://www.njd-iscience.com
CONTENT
BIOLOGICAL SCIENCES
Novikova A., Ivanov E.,
Kurguzova N., Akzhigitov R., Bozhkov A.
COLOSTRUM COMPONENTS INVOLVED IN
REGULATING THE NUMBER OF IMMUNOCOMPETENT
CELLS IN ANIMALS WITH LIVER FIBROSIS....................3
ECONOMIC SCIENCES
Tarko A.
RESULTS OF THE DEVELOPMENT OF THE COUNTRIES
THAT CAME OUT OF 1991.........................................12
HISTORICAL SCIENCES
Shutova M.
"HONEST MIRROR OF YOUTH" AS THE MAIN SOURCE
OF EDUCATION OF THE YOUNGER GENERATION OF
PETER'S RUSSIA .........................................................33
PHILOLOGICAL SCIENCES
Amanov A.
MEANS OF CONNECTING THE COMPONENTS OF THE
TEXT IN UZBEK LITERARY LANGUAGE .......................36
SOCIAL SCIENCES
Synchak B., Koval A.
RECOMMENDATIONS FOR BRIDGING THE GAP
BETWEEN THEORY AND PRACTICE IN JOURNALISM.39
Norwegian Journal of development of the International Science No 70/2021 3
BIOLOGICAL SCIENCES
COLOSTRUM COMPONENTS INVOLVED IN REGULATING THE NUMBER OF
IMMUNOCOMPETENT CELLS IN ANIMALS WITH LIVER FIBROSIS
Novikova A.,
postgraduate student of the Department of Molecular Biology and Biotechnology V.N. Karazin Kharkov
National University, Kharkov
Ivanov E.,
PhD, Associate Professor of the Department of Molecular Biology and Biotechnology V.N. Karazin Khar-
kov National University, Kharkov
Kurguzova N.,
Senior Lecturer of the Department of Molecular Biology and Biotechnology V.N. Karazin Kharkov National
University, Kharkov
Akzhigitov R.,
postgraduate student of the Department of Molecular Biology and Biotechnology V.N. Karazin Kharkov
National University, Kharkov
Bozhkov A.
Doctor of Biological Sciences, Professor of the Department of Molecular Biology and Biotechnology V.N.
Karazin Kharkov National University, Kharkov
DOI: 10.24412/3453-9875-2021-70-2-3-11
Abstract
Two different fractions were prepared from whole colostrum: defatted colostrum (DC) and low molecular
weight components of colostrum (LMC), and their effect on the growth dynamics of Wistar rats, in which liver
fibrosis was induced, and the content of erythrocytes, platelets, and immunocompetent cells (leukocytes, lympho-
cytes, granulocytes, monocytes). To induce liver fibrosis, rats were injected three times with copper sulfate at a
dose of 1 mg /100 g of body weight with an interval of 48 hours between injections. 24 hours after the last admin-
istration of copper, the development of the initial stage of fibrosis was observed according to histology data, and
this was accompanied by an inhibition of the rate of growth in the body weight of the animals. Hematological
parameters were determined on an automatic analyzer Mindray BC - 2008 Vet, (USA). It was found that in animals
with fibrosis the number of platelets was increased by 2 times in comparison with the control, other types of cells,
in particular immunocompetent cells, remained within the normal range. If animals with Cu-induced fibrosis were
injected with OM and NCM at a dose of 0.1 mg /100 g of body weight daily for 6 days, then there was a significant
increase in the number of immunocompetent cells in the bloodstream (leukocytes by 80% with OM and 59 % for
NCM; lymphocytes by 68% and 30%, respectively; monocytes by 82% for OM and 160% for NCM; granulocytes
by 218% and 223%, respectively), with a decrease in the number of platelets compared to animals with fibrosis.
It has been suggested that the components of colostrum have a stimulating effect on the functional activity of
bone marrow cells, which can contribute to the elimination of liver fibrosis. DC and LMC had different effects on
the content of different types of bone marrow cells.
Keywords: defatted colostrum, low molecular weight components of colostrum, immunocompetent cells,
Cu-induced liver fibrosis.
Introduction.
It is known that liver fibrosis, the process of re-
placing liver cells with connective tissue, is a universal
response of the body to damage. [1] Damage in liver
tissue can be caused by a variety of factors: toxic chem-
icals in water, food or air, microorganisms, or physical
factors. [2, 3] Fibrosis of the liver is dangerous because
it can lead to the development of cirrhosis, which is an
irreversible chronic severe condition. [4]
At the same time, in the early stages of develop-
ment, fibrosis can be eliminated and the impaired liver
function restored. Currently, there is an active search
for natural compounds that can normalize liver function
in fibrosis. [5]
Earlier it was shown that repeated sequential ad-
ministration of copper sulfate in a dose of 1 mg /100 g
of body weight to experimental animals was accompa-
nied by the induction of liver fibrosis. [6, 7]
It is known that colostrum is a natural component,
which includes a large number of biologically active
compounds, such as immunoglobulins IgA, IgG, IgD,
IgE, IgM, cytokines and related interferon, various
growth factors - insulin-like factors, platelet, epithelial
factors and including the transfer factor. [8, 9, 10]
Transfer factor has a wide spectrum of action on bio-
logical systems and can normalize liver dysfunction
against the background of fibrosis. [11] Isolation of the
transfer factor is associated with a fine purification sys-
tem, which requires expensive equipment on the one
hand, and on the other hand, with such a purification
system, a number of other biologically active com-
pounds can be removed. It is of interest to separate co-
lostrum into a number of components, in particular, the
removal of lipid components and the removal of high
molecular weight proteins, to obtain low molecular
weight components of colostrum, which also include a
transfer factor. With this approach, relatively simple
4 Norwegian Journal of development of the International Science No 70/2021
fractionation methods can be used while maintaining
the biologically active properties of the materials.
In this regard, in our work, we investigated the ef-
fect of whole skim colostrum and low molecular weight
components of colostrum (which also includes a trans-
fer factor) on the growth dynamics and hematological
parameters of animals with Cu-induced liver fibrosis.
Materials and methods.
The experiments were carried out on three-month-
old male Wistar rats. The animals were kept under
standard vivarium conditions. To simulate fibrotic
changes in the liver of rats, a solution of copper sulfate
was used, which was administered to rats intraperitone-
ally three times with an interval of 48 hours between
injections at a concentration of 1 mg Cu /100 g of body
weight, as described earlier. [6, 7, 12]
For fractionation, colostrum was obtained from
the Alpha farm (Ukraine), from Ukrainian dairy cows -
pockmarked, the second milk yield after calving. Fat
was removed by centrifugation of whole colostrum at
3000 g for 20 min at room temperature. After removing
the fats, the resulting colostrum was used as defatted
colostrum (DC). When obtaining low molecular weight
components (LMC), colostrum was passed through
membrane filters with a pore diameter of 10 nm, which
made it possible to remove proteins with a high molec-
ular weight of more than 10 kd (Fig. 1)
Fig.1. A. Protein composition of skim colostrum as determined by mass spectrometry. B. Composition of
proteins included in the fraction of low molecular weight components of colostrum.
Intensity,
conventional
units
Intensity,
conventional
units
А
В
Norwegian Journal of development of the International Science No 70/2021 5
The obtained fractions of DC and LMC were dried
in a rotary evaporator and stored dry samples at a tem-
perature of minus 15 ºС without access to air.
To study the effect of DC and LMC, animals with
induced liver fibrosis with copper sulfate (Cu - ind.fi-
brosis) were injected per os with aqueous solutions of
DC and LMC at a dose of 0.1mg/100 g of body weight
6 times every 24 hours (Fig. 3). When working with
animals, all recommendations for bioethical standards
were observed.
Fig.2. Scheme showing experimental groups of animals, which were sequentially injected with copper sulfate at
a dose of 1 mg/100 g for the induction of fibrosis, followed by the administration of DC and LMC. The control
variant was not subjected to any additional influences.
The body weight of the animals was determined
daily, and after decapitation of the animals, which was
carried out under ether anesthesia, blood was collected
in tubes with K3 EDTA (3-substituted potassium salt of
ethylenediaminetetraacetic acid) for further studies of
hematological parameters on an automatic analyzer
Mindray BC - 2008 Vet, (USA). The absolute content
of leukocytes, lymphocytes, monocytes, granulocytes,
erythrocytes, platelets, hemoglobin content, hemato-
crit, average volume of erythrocytes, erythrocyte aniso-
cytosis, average concentration of hemoglobin in one
erythrocyte, relative width of platelet distribution, av-
erage platelet volume and platelet volume were deter-
mined.
Each experimental group consisted of 6 rats. The
results obtained were subjected to statistical analysis
using the Exel program. Data in the work are presented
as mean (x) and standard error (SE).
Research results.
Influence of exogenous copper ions on the mor-
phology and growth dynamics of rats. Three-time se-
quential administration of copper sulfate to experi-
mental animals at a dose of 1 mg / 100 g of body weight
was accompanied by morphological changes in the
liver tissue, which is characteristic of toxic liver dam-
age, in particular: acute coagulation necrosis of hepato-
cytes in the perilobilar zones, apoptosis of some
hepatocytes, dystrophic changes in hepatocytes (pro-
tein fatty degeneration). Intoxication with copper ions
led to venous hyperemia, the presence of erythrocyte
accumulations (aggregates) (Fig. 3 Aa, Ab).
Previously, it was shown that the intoxication of
animals with copper sulfate was accompanied by a 30%
increase in collagen content and the growth of connec-
tive tissue in the liver. [13]
Dysfunction of the liver was accompanied by a
loss or delay in the growth of the body weight of the
animals. So, if the body weight of the control group of
animals increased almost linearly from 1 to 13 days of
observation and at the end of the experiment it in-
creased by 25 - 30% of the initial (Fig. 3B, curve 1),
then in animals with Cu - induced liver fibrosis by at
the end of the experiment, it remained at the level of the
initial values (Fig. 3B, curve 2).
In the event that animals with Cu-induced liver fi-
brosis received DC per os at a dose of 0.1 mg / 100 g
of body weight, then after growth retardation, from day
5 to 13, they slowly, but gained body weight, and by
the end of observations, it increased by 10 - 15% of the
initial one (Fig. 3 B, curve 3). If animals with Cu-in-
duced liver fibrosis received LMC, then they increased
their body weight with a higher rate, although they
lagged behind the control group (Fig. 3B, curve 4).
6 Norwegian Journal of development of the International Science No 70/2021
Fig. 3. A. Micrographs of histological liver samples from control animals (a) and animals that were injected
three times with copper sulfate at a dose of 1 mg / 100 g of body weight with an interval of 48 hours between
injections (b). Magnification x 400 s. B. The dynamics of the body weight of control animals (1), animals with
Cu - induced liver fibrosis (2), as well as animals with Cu - induced liver fibrosis, who received defatted
colostrum at a dose of 0.1 mg / 100 g of body weight (3) and the group animals with fibrosis who received low
molecular weight components of colostrum daily at a dose of 0.1 mg / 100 g of body weight for 6 days with an
interval of 24 hours (4). Mean values from 6 animals in each experimental group are shown.
* - differences were noted between the experimental groups in comparison with the control group for which p
<0.05.
Consequently, colostrum intake partially restores
body weight growth in experimental animals with Cu-
induced liver fibrosis. LMC shows a greater effect in
restoring this indicator as compared to DC. However,
the full recovery of the growth rate of animals with liver
fibrosis did not occur.
The results obtained convincingly confirm the fact
that the inflammatory process in the liver, induced by
intoxication with copper ions, is characterized by sys-
temic changes at the level of the whole organism. In
particular, a change in the functional activity of the di-
gestive system, a shift in the balance of the redox sys-
tem towards prooxidants [14, 15]. Despite numerous
studies of the mechanisms of the development of in-
flammatory reactions, the questions of the integrative
mechanisms of the response to the action of pathoge-
netic factors remain unresolved. In this case, the excess
of copper ions, we believe that the bone marrow, pro-
ducing blood cells and immunocompetent cells, is a
systemic factor in the formation of inflammatory re-
sponses.
Hematological parameters in rats with Cu - in-
duced liver fibrosis and after administration of colos-
trum components. The content of erythrocytes in exper-
imental animals with Cu - ind. liver fibrosis did not dif-
fer from intact control. The content of hemoglobin, the
average concentration of hemoglobin in the erythro-
cyte, hematocrit, and the average volume of the eryth-
rocyte and anisocytosis of erythrocytes in animals with
Cu - ind. liver fibrosis also remained at the control level
(table).
Table
Erythrocyte count, average erythrocyte volume, hemoglobin content, hematocrit and erythrocyte anisocy-
tosis in the intact control group, animals with Cu-induced fibrosis, and animals with Cu-induced fibrosis,
who received DC and LMC per os at a dose of 0.1 mg / 100 g body weight. Mean values from three experi-
ments and standard errors of the mean are presented.
Groups of experi-
mental animals
INDICATORS
The number of
erythrocytes,
х109
l
Average volume
of erythrocytes,
fl
Hematocrit,
%
Hemoglobin
content, g/l
Erythrocyte an-
isocytosis, %
Intact control 8,52 ±0,37 55,00 ±3,09 46,60 ±0,70 146,00 ±3,79 14,73 ±1,88
Cu – ind. fibrosis 7,6 ±0,24 53,40 ±0,95 41,70 ±0,76 132,00 ±3,45 13,80 ±0,90
Cu – ind. fibrosis
and DC injection
7,93 ±0,05 54,20 ±0,69 42,90 ±0,72 134,33 ±1,45 14,17 ±0,58
Cu – ind. fibrosis
and the introduction
of LMC
7,81 ±0,23 56,05 ±0,90 43,70 ±1,40 138,50 ±3,55 15,08 ±0,78
85
95
105
115
125
135
145
1 3 5 6 7 8 9 10 11 12 13
relative
body
weight,%
days of experiment
introduction
of copper
sulfate
introduction of colostrumand
LMC
* * *
* *
* *
*
*
*
*
*
*
*
*
*
*
1
2
3
4
A B
Norwegian Journal of development of the International Science No 70/2021 7
Administration to animals with Cu - ind. liver fi-
brosis DC and LMC in doses of 0.1 mg / 100 g of body
weight did not affect the parameters of hematopoiesis
(table).
Consequently, at the initial stages of the develop-
ment of Cu-induced fibrosis, hematopoiesis remained
within the normal range. Skim colostrum and low mo-
lecular weight components of colostrum also had no ef-
fect on hematopoiesis, at least when it corresponded to
the control level.
The number of leukocytes in animals with Cu -
ind. liver fibrosis remained within the control values
(Fig. 4A). However, in animals with liver fibrosis,
which received DC at a dose of 1 mg / 100 g of body
weight for 6 days, the leukocyte content was increased
by 80% compared with control (Fig. 4A). In the event
that animals with liver fibrosis received LMC, then
their leukocyte content was also increased by 59% in
relation to the control (Fig. 4A). The manifestation of
leukocytosis after the administration of colostrum com-
ponents to experimental animals can be a positive effect
against the background of intoxication, since this is ac-
companied by the activation of the cellular link of im-
munity.
Since leukocytes produce interferon and growth
factors [16], this can positively affect the restoration of
liver function against the background of fibrosis.
The content of lymphocytes in animals with Cu -
ind. liver fibrosis was reduced compared to controls by
25% (Fig. 4B). If animals with fibrosis were injected
with DC and LMC, then the lymphocyte content was
increased in comparison with the control by 68 and
30%, respectively (Fig. 4B).
Consequently, DC caused a more pronounced ef-
fect of stimulating the number of leukocytes and lym-
phocytes compared to LMC.
The class of phagocytic mononuclear cells - mon-
ocytes in animals with Cu - ind. liver fibrosis did not
differ from the control values (0.33 ± 0.09 and 0.4 ±
0.06). At the same time, administration of DC and LMC
to animals with hepatic fibrosis was accompanied by a
significant increase in this class of cells by 82 and
160%, respectively, compared with intact controls (Fig.
C).
Consequently, LMC was 2 times more effective in
increasing the number of monocytes compared to DC.
Such a significant increase in phagocytic cells, which
are able to remove destroyed cells, denatured proteins
and circulating immune complexes from the body, is
the most important stage in eliminating pathological
processes in the liver.
When assessing the level of nonspecific reactivity
of an organism, the index of the ratio of the number of
lymphocytes to monocytes is often used. In intact con-
trol animals, it was 19.6 arbitrary units, in animals with
liver fibrosis, it was significantly reduced to 12.0, after
administration of DC to animals with fibrosis, it did not
differ from the control level (18.1). However, after ad-
ministration to animals with fibrosis of LMC, it was al-
most 2 times lower than the control and amounted to
9.7 arbitrary units.
Consequently, the administration of DC to ani-
mals after intoxication with copper sulfate is more pref-
erable compared to LMC, at least for the regulation of
the cellular link of immunity.
A relatively leukocytes large proportion is occu-
pied by granulocytic cells, which include basophils,
neutrophils and eosinophils. The total number of gran-
ulocytes in the control group was 2.0 * 109
cells / l. It
did not change in animals with Cu - ind. liver fibrosis
(2.4 * 109
cells / l) (Fig.4D). However, after the admin-
istration of DC and LMC to experimental animals, their
number increased 2.2 times compared to the control
level (Fig. 4D).
8 Norwegian Journal of development of the International Science No 70/2021
Fig.4. A. The absolute content of leukocytes in the intact control group (1), the group of animals with Cu -
induced liver fibrosis (2), in the group with Cu - ind. fibrosis, followed by 6-fold administration of DC at a dose
of 1 mg / 100 g of body weight (3) and in the group with fibrosis, followed by 6-fold injection of LMC at a dose
of 0.1 mg / 100 g of body weight (4); B. Absolute lymphocyte count in the same groups of animals; C. Absolute
content of monocytes in the same groups of animals; D. Absolute content of granulocyte in the same groups of
animals.
It is known that granulocyte inducers are interleu-
kins: 1,3,5, granulocyte-stimulating factor, granulo-
cyte-monocyte factor, which are present in colostrum.
Consequently, the administration of colostrum
components to animals with liver fibrosis stimulates the
formation of immunocompetent cells that can ensure
the restoration of the pathologically altered liver.
As it was revealed on histological preparations of
the liver with the development of fibrosis, there was a
change in the state of the vessels. In this regard, it is of
great interest to assess the number and characteristics
of platelets, as an indicator of blood coagulation.
It was found that in animals with Cu - ind. with
liver fibrosis, the number of platelets was increased 2-
fold compared to the control (Fig. 5A), that is, throm-
bocytosis took place. The causes of thrombocytosis are
very diverse, but they are based on an increase in cyto-
kines that stimulate platelet formation.
Thrombocytosis is known to increase the likeli-
hood of blood clots. If animals with fibrosis received
DC for 6 days, then the platelet count remained 50%
higher than the intact control, but was 26% less than
with fibrosis (Fig.5A). LMC had a less pronounced ef-
fect of reducing the number of platelets in animals with
fibrosis compared with DC (only by 15%) (Fig. 5A).
0
5
10
15
20
25
1 2 3 4
The
absolute
content
of
leukocytes,
х10
9
/l
*
*
A
0
2
4
6
8
10
12
14
1 2 3 4
Absolute
lymphocyte
count,
х10
9
/l
*
B
0
0,2
0,4
0,6
0,8
1
1,2
1 2 3 4
Absolute
content
of
monocytes,
х10
9
/l
*
C
0
1
2
3
4
5
6
1 2 3 4
Absolute
content
of
granulocyte,
х10
9
/l
*
*
D
Norwegian Journal of development of the International Science No 70/2021 9
Fig. 5. A. The number of platelets in the intact control group (1), the group of animals with Cu - induced
liver fibrosis (2), in the group with Cu - ind. fibrosis, followed by 6-fold administration of DC at a dose of 1 mg /
100 g of body weight (3) and in the group with fibrosis, followed by 6-fold injection of LMC at a dose of 0.1 mg /
100 g of body weight (4); B. Thrombokrit in the same groups of animals; C. the average volume of platelets in
the same groups of animals. Mean values and standard errors are given.
* - differences were noted between the control and experimental groups, for which p <0.05.
Consequently, the intake of DC provided a de-
crease in thrombocytosis, which took place in Cu - ind.
liver fibrosis. In favor of the different effect of DC and
LMC on platelet formation, data on thrombocrit indica-
tors testify. So, thrombocritis in rats with Cu - ind. liver
fibrosis was increased in comparison with the control
level by 88%; after the animals with fibrosis received
DC, this indicator decreased by 21%, although it re-
mained somewhat higher compared to the control,
whereas in the case of receiving LMC by animals, it did
not change (Fig. 5B).
The change in thrombocyte was due to an increase
in the number of platelets, while maintaining their vol-
ume (Fig. 5C).
Discussion
It was previously thought that the induction of fi-
brogenesis leads to irreversible chronic conditions [17].
Intensive studies in recent years have shown that liver
fibrosis can be reversible, however, the features and
mechanisms of this process have not been finally estab-
lished. Understanding the process of loss of the liver's
ability to regenerate and remove the formed connective
tissue elements in response to tissue damage is a funda-
mental problem in biomedical research. It is quite ob-
vious that its solution will allow developing methods of
treating chronic pathologies and understanding the
basic mechanisms of age-related pathologies that have
a direct connection with them.
We believe that the problem of "reversible ↔ irre-
versible" metabolic states depends primarily on the
stages of the process development. This can be ex-
plained by the fact that at the late (terminal) stages of a
metabolic process, metabolic and / or epigenetic
memory is formed, which has an adaptive character
and, with long-term maintenance, "passes" into a state
of "self-support", that is, the process becomes irreversi-
ble. At the initial stages of the formation of an adaptive
response, which is fibrosis, until the “self-support” sys-
tem is established, the process can be reversible, that is,
a shift of the “degradation ↔ regeneration” equilibrium
towards regeneration and restoration of the “previous”
homeostatic balance in the body is ensured. Natural bi-
ologically active compounds, in particular colostrum
components, can act as factors capable of shifting the
balance. Colostrum contains a unique natural set of bi-
ologically active compounds of a wide spectrum of ac-
tion, and they can have a systemic effect on the regula-
tion of the process in the body [10, 18].
The effectiveness of the process of restoring the
functional activity of the fibrotic-altered liver will de-
pend on the systemic response of the body to the action
of the pathogenetic factor. In the formation of the sys-
temic response, the bone marrow plays a central, coor-
dinating (integrative) role as a producer of blood cells
and, first of all, immunocompetent cells [19]. Actively
phagocytic cells not only remove apoptotic or necrotic
cells and circulating immune complexes [20], but are
also producers of a wide range of cytokines, low mo-
lecular weight regulatory peptides, and other biologi-
cally active substances [21]. These biologically active
substances take both direct and indirect participation in
enhancing the processes of liver regeneration and res-
toration of its function and other body systems.
The results of this work and previously obtained
data on the study of the mechanisms of Cu-induced
liver fibrosis indicate and indicate that:
1) 24 hours after the last three times administration
of copper sulfate to experimental animals, liver fibrosis
develops, which was at the initial stage of development
[7]. This is evidenced by moderate morphological
changes in the liver, as well as intensive growth of the
10 Norwegian Journal of development of the International Science No 70/2021
liver capsule [22]. These changes in the liver tissue oc-
curred against the background of an increase in the con-
tent of lipid hydroperoxides and inhibition of the activ-
ity of glutathione peroxidase, aconitase, and other en-
zymes [14].
2) the reaction of the bone marrow manifests itself
insignificantly to these relatively small homeostatic
changes at the initial stages of the liver fibrosis devel-
opment, as evidenced by the preservation of the number
of erythrocytes and their structural and functional char-
acteristics within the control values. The results ob-
tained suggest that such a response of the bone marrow
to the presence of liver fibrosis will not have an effect
on its elimination; and the fibrosis will intensify and
progress to the next stage, forming cirrhotic changes in
the liver. In other words, relatively small functional
changes in the liver that take place in our case may re-
main "insignificant" for other regulatory systems of the
body, in particular for the bone marrow; and the liver
can move to the next stage of pathogenesis (Fig. 6).
Fig. 6. Scheme that demonstrates different strategies for the development of liver fibrosis: I Introduction of
copper ions, which is localized in the liver, induces oxidative stress, an increase in the content of lipyl
hydroperoxides (LOOHs), inhibition of antioxidant enzymes (GPx), an increase in the number of platelets,
inhibition of animal growth, while bone growth the brain does not "react" to these changes, as evidenced by the
preservation of the number of immunocompetent cells at a constant level. II In the event that colostrum
components are administered to animals with fibrosis, they activate the function of the bone marrow, which is
accompanied by a pronounced increase in the content of immunocompetent cells in the bloodstream, elimination
of oxidative stress and restoration of body weight growth, which may indicate an increase in the regeneration
process of the fibrous liver.
3) if at the initial stages of the development of Cu-
induced fibrosis experimental animals received the
components of colostrum, then these components
caused a pronounced response at the bone marrow
level, which was expressed in an increase in the total
number of leukocytes (by 59-80%), lymphocytes (by
30-68%), monocytes (82-160%), granulocytes (62%);
at the same time, the number of platelets decreased and
approached the control values.
4) these changes caused by the components of co-
lostrum differ quantitatively depending on the compo-
sition of these components. This indicates that different
regulatory effects can be exerted on bone marrow cells
by using different methods for fractionating whole co-
lostrum.
5) changes in induction at the level of hematopoi-
esis is accompanied by restoration of the activity of an-
tioxidant enzymes, restoration of the immune system
[9], restoration of the ability of animals with Cu-in-
duced liver fibrosis to perform work [7] and is accom-
panied by a slight increase in body weight growth (Fig.
6).
The results obtained suggest that if there are minor
structural and functional changes in the liver, which can
be relatively easily compensated by hypertrophy of
hepatocytes, then such changes will not affect the com-
pensatory functions of the bone marrow, which will not
cause a systemic response at the level of the organism.
In this case, these structural and functional changes will
be “fixed” in the liver, and the balance in the system of
“fibrotic changes” will be preserved due to the activa-
tion of stellate cells. The rest of the metabolic systems
"adjust" (adapt) to the new functional state, since it is
not at this stage of development dangerous, and after a
certain time (long enough) the next stage of fibrosis will
be formed, which will be irreversible due to the fact that
most of the body systems “adapted”, that is, formed the
mechanisms of“ self-maintenance ”of such a state.
If, at the initial stages of fibrosis development, an
“additional” signal is provided by colostrum compo-
nents to the bone marrow, the activity of immunocom-
petent cells and the possible activation of other body
systems, including the intestinal microbiota, are in-
creased, then the balance can be shifted towards the re-
generation of liver cells and ensure the reversibility of
fibrotic changes.
REFERENCES:
1. Hernandez-Gea, V., & Friedman, S. L. (2011).
Pathogenesis of Liver Fibrosis. Annual Review of Pa-
thology: Mechanisms of Disease, 6(1), 425–456.
doi:10.1146/annurev-pathol-011110-130246
2. Al-Eryani, L., Wahlang, B., Falkner, K. C.,
Guardiola, J. J., Clair, H. B., Prough, R. A., & Cave, M.
(2014). Identification of Environmental Chemicals As-
sociated with the Development of Toxicant-associated
Fatty Liver Disease in Rodents. Toxicologic Pathology,
43(4), 482–497. doi:10.1177/0192623314549960
LOOHs
●
LOOH
s
immunocompetent
cells
induction
fibrosis
liver
GPx
growth
inhibition
Leukocyte
s
Platelets
Bone
marrow
Components
colostrum
ACTIVATION
Fibrotic liver
F0, F1
fibrogenesi
s
growth
enhancement
ENHANCING
LIVER
REGENERATIO
N
Leukocytes
●
Platelets
but if
F2, F3
F4
CIRRHOSIS
Cu2
+
I
I
I
Bone
marrow
Cu2
+
Cu2
+
GPx ●
Norwegian Journal of development of the International Science No 70/2021 11
3. Liang, Q., Zhang, M., Hu, Y., Zhang, W., Zhu,
P., Chen, Y., … Wang, K. (2020). Gut Microbiome
Contributes to Liver Fibrosis Impact on T Cell Recep-
tor Immune Repertoire. Frontiers in Microbiology, 11.
doi:10.3389/fmicb.2020.571847
4. Albanis, E., & Friedman, S. L. (2001). Hepatic
fibrosis. Clinics in Liver Disease, 5(2), 315–334.
doi:10.1016/s1089-3261(05)70168-9
5. Shan, L., Liu, Z., Ci, L., Shuai, C., Lv, X., &
Li, J. (2019). Research progress on the anti-hepatic fi-
brosis action and mechanism of natural products. Inter-
national Immunopharmacology, 75, 105765.
doi:10.1016/j.intimp.2019.105765
6. Anatoliy I. Bozhkov, Eugeniy G. Ivanov,
Yuliya A. Kuznetsova, Svetlana L. Ohiienko, Anasta-
siya Yu. Bondar’. (2017) Copper induced liver fibrosis
affects the “behavior” of bone marrow cells in primary
culture. Front.biol. Vol. 12 Issue (4) : 271-279
7. A. I. Bozhkov, Yu. V. Nikitchenko, E. M.
Klimova, O. S. Linkevych, K. M. Lebid, A. M. M. Al-
Bahadli, and M. M. A. Alsardia. (2017) Young and Old
Rats Have Different Strategies of Metabolic Adaptation
to Cu-Induced Liver Fibrosis// Advances in Gerontol-
ogy, 2017, Vol. 7, No. 1, pp. 41–50.
8. Puppel, Gołębiewski, Grodkowski, Slósarz,
Kunowska-Slósarz, Solarczyk, … Przysucha. (2019).
Composition and Factors Affecting Quality of Bovine
Colostrum: A Review. Animals, 9(12), 1070.
doi:10.3390/ani9121070
9. Bozhkov, A.I., Linkevych, O.S., Ivanov, E.G.,
Klimova, O.M. and Mohammad A. Y. AlBegai. (2016)
Low molecular weight components of colostrum regu-
late the activity of cellular component of the immune
system in animals with Cu-induced liver fibrosis. Inter-
national Journal of Current Research., 8(12), 44129-
44137.
10. A.I. Bozhkov, E.G. Ivanov, Mohammad A.Y.
Al Begai, Mohammad M.A. Alsardia and N.I. Kur-
guzova. (2017) Low-Molecular Weight Cow Colos-
trum Components in Functional Nutrition. Journal of
Nutritional Therapeutics, 6, 11-17. DOI:
https://doi.org/10.6000/1929-5634.2017.06.01.2
11. Alexander Wree, Theresa Maria Holtmann,
Maria Eugenia Inzaugarat, Ariel E. Feldstein. (2019)
Novel Drivers of the Inflammatory Response in Liver
Injury and Fibrosis. Semin Liver Dis, 39 (03): 275-282.
12. Божков А. И. (1997) Три дозозависимые
стадии действия ионов меди на функциональную
активность биологических систем // Биохимия. Т.
60, № 2. С. 176–186.
13. Bozhkov Anatoliy I., Klimova Olena M.,
Nikitchenko Yuriy V., Kurguzova Natalia I.,
Linkevych Olena S., Lebid Katherine M., Protsenko
Olena S., Remneva Natalya A., Al-Bahadly Ali M. M.,
Al-Begai Mohammad A. Y. (2017). Оntogenetic
approach to the study ofmechanisms of copperinduced
liver fibrosis. Advances in Aging Research. Vol. 6. P.
39-54.
14. Bozhkov AI, Nikitchenko YuV, Lebid KM,
Ivanov EG, Kurguzova NI, Gayevoy SS, Sharko MO,
Alsardia Mohammad MA and Al Begai Mohammad
AY. (2017) Low Molecular Weight Components from
Various Sources Eliminate Oxidative Stress and
Restore Physiological Characteristic of Animals at
Early Stages of Cu-Induced Liver Fibrosis
Development. Translational Biomedicine. Vol. 8, N 2,
107.
15. Karsdal, M. A., Daniels, S. J., Holm Nielsen,
S., Bager, C., Rasmussen, D. G. K., Loomba, R., …
Schuppan, D. (2020). Collagen biology and non‐
invasive biomarkers of liver fibrosis. Liver
International. doi:10.1111/liv.14390
16. Agrawal, S., Gupta, S. (2011) TLR1/2, TLR7,
and TLR9 Signals Directly Activate Human Peripheral
Blood Naive and Memory B Cell Subsets to Produce
Cytokines, Chemokines, and Hematopoietic Growth
Factors. J Clin Immunol. 31, 89–98
17. TA Wynn (2008). Cellular and molecular
mechanisms of fibrosis. , 214(2), 199–
210. doi:10.1002/path.2277
18. Kozheshkurt, Valentyn and Ivanov, Ievgen
and Antonenko, Yevhenii and Katrich, Victor and
Bozhkov, Anatoly and Gromovoy, Taras, (2021). De-
vising An Express Method for Estimating the Quality
of Colostrum and Its Components Based on Electrical
Conductivity. Eastern-European Journal of Enterprise
Technologies, 1/11 (109), 69–77.
19. S. L. Ohiienko, A. I. Bozhkov, A. Yu. Bondar,
E. G. Ivanov, I. A. Ionov. (2019). Bone marrow cells
obtained from old animals differ from the young ani-
mals cells in their ability to divide and in response to
the presence of liver fibrosis in primary culture. Ad-
vances in Aging Research, 8, 14 –27.
20. Hart, S. P.; Alexander, K. M.; Dransfield, I.
(2004). Immune Complexes Bind Preferentially to
Fc RIIA (CD32) on Apoptotic Neutrophils, Leading to
Augmented Phagocytosis by Macrophages and Release
of Proinflammatory Cytokines. The Journal of Immu-
nology, 172(3), 1882–1887. doi:10.4049/jim-
munol.172.3.1882
21. Anthony J. Nappi; Enzo Ottaviani
(2000). Cytotoxicity and cytotoxic molecules in inver-
tebrates. , 22(5), 469–480. doi:10.1002/(sici)1521-
1878(200005)22:5<469::aid-bies9>3.0.co;2-4
22. Alcolado, R.; Arthur, M. J. P.; Iredale, J. P.
(1997). Pathogenesis of Liver Fibrosis. Clinical Sci-
ence, 92(2), 103–112. doi:10.1042/cs0920103
12 Norwegian Journal of development of the International Science No 70/2021
ECONOMIC SCIENCES
RESULTS OF THE DEVELOPMENT OF THE COUNTRIES THAT CAME OUT OF 1991
Tarko A.
Doctor of Physical and Mathematical Sciences, Professor of Mathematical Cybernetics
Chief Researcher of the Dorodnicyn Computing Centre of the Federal Research Center
«Computer Science and Control» of Russian Academy of Sciences
DOI: 10.24412/3453-9875-2021-70-2-12-32
Abstract
The analysis of the economic, demographic and socio-psychological development of Russia and other former
USSR countries, the Warsaw Pact and Yugoslavia countries 30 years after 1991 is carried out. The development
of two sectors of economy - the high-tech and the raw materials were investigated. Integral Index of Development
ID was developed to assess the development of countries that came out of 1991.
Keywords: gross domestic product, economic growth rate, life expectancy, socio-psychological violation,
survival to age 65, high-tech development, foreign direct investments, raw materials, integral development index.
1. Introduction
This paper will analyze the results achieved by the
countries that went out the USSR and the Warsaw Pact
in 1991. In view of thirtieth anniversary of these coun-
tries we will compare their economic and social devel-
opment, will consider the prospects for moving for-
ward. One of the objectives of the study is to compare
the results achieved by these countries, including com-
parison with developed and developing countries of the
world.
In 1991, the republics of the former USSR, the
Warsaw Pact and Yugoslavia underwent to a market
economy regime. The Warsaw Pact countries and Yu-
goslavia began to develop on the basis of a multi-sector
economy, in Russia, the main sector of the economy has
become the extraction of raw materials.
Russia and the countries that left the USSR have
mostly united into the Union of Independent States
(CIS). The countries of the former Warsaw Pact and
Yugoslavia after 1991 began to focus on the European
Union and NATO. Economic interactions between the
two groups of countries are largely weakened.
The aim of this study is to analyze and compare
the development of the three groups of countries – for-
mer Soviet Union (FSU), the former Warsaw Pact, in-
cluding the Baltic States that joined their system
(FWPB), the former Yugoslavia (FYU). We will com-
pare the development mentioned countries with the Eu-
ropean Union and other countries of the world.
The raw materials sector is no longer the only one
in Russia. After the beginning of the global economic
crisis in 2008, elements of the high-tech sector, the met-
allurgical sector and agricultural production began to
better develop in Russia.
Our task is to study both the economic systems in
countries and the living conditions of their population.
This means that our way of investigation is differ from
the UN program of Human Development Index (HDI).
Technically, the method of analysis is based on the con-
sideration of many parameters of development. If the
knowledge of GDP per capita, life expectancy and ed-
ucation received by a person are enough to assess the
living conditions of a person, then to characterize the
state and development of countries and the social pro-
cesses going on in them, it is necessary to analyze dif-
ferent parameters characterizing the dynamics of the
economy and demographic development of the country
to assess the course of processes.
It should be noted that we recently performed a
study of HDI of the subjects of the Russian Federation
[8]. The study was performed using different princi-
ples. The parameters characterizing both positive de-
velopment and negative phenomena were considered.
A large number of parameters were analyzed. This
analysis was carried out on the basis of databases of the
Federal State Statistics Service [10]. Space remote
sensing data were also involved in the work.
Now world development contains two simultane-
ous processes: 1) scientific and technological progress
against the background of economic growth and the
continuation of globalization in the countries of the
world; 2) the systemic global economic crisis that slows
down the economy and all processes that depend on it
[4, 5, 6].
The way out of the crisis requires a structural ad-
justment of the economy; the financial system is part of
what needs to be rebuilt. It is necessary to change the
structure of economic relations in a globalized world.
Now the search for a way out of the situation requires
choosing the direction of structural adjustment of the
economy, depending on the choice of new development
paths. Globalization has not stopped, but its direction
and speed have become largely dependent on problems
that previously had little impact on decision-making.
The search for new ways often takes place by trial and
error, and there are undoubtedly quite a lot of these
choices. In these conditions, complex mathematical
modeling and forecasting acquires new tasks.
All quantitative data were obtained from the
World Bank databases [14], and small use of British
Petroleum data [13].
2. Economy
Let's start with an analysis of the income in the
countries - the gross domestic product per capita (GDP)
in each of the countries – the FSU, the FWPB and the
FUY (Fig.1). We will compare the development of
Norwegian Journal of development of the International Science No 70/2021 13
countries, including with other developed and also de-
veloping countries of the world. On the graph, the coun-
tries of each group are represented by groups of col-
umns, in each group in descending order of the param-
eter value. Further to the right there are the columns
average values of the parameters of the countries repre-
sented by the World Bank are given: high-income
countries, the European Union, low-income countries
and the least developed countries (according to the ter-
minology of the UN). Also data of usual countries pre-
sented. GDP is expressed in US dollars, taking into ac-
count the purchasing power parity of the dollar at cur-
rent international prices [14].
29
181
27
518
19
997
15
656
15
207
15
041
14
258
13
627
13
341
7
308
5
486
3
529
44
296
40
016
39
986
35
165
34
966
33
516
33
340
33
021
25
312
42
431
31
131
24
036
19
495
18
108
16
289
52
785
47
828
3
060
2
340
70
006
65
298
57
530
53
172
50
993
49
932
44
011
16
804
89 684
0
10 000
20 000
30 000
40 000
50 000
60 000
70 000
80 000
90 000 Russia
Kazakhstan
Belarus
Georgia
Turkmenistan
Azerbaijan
Armenia
Moldova
Ukraine
Uzbekistan
Kyrgyzstan
Tajikistan
Czech
Lithuania
Estonia
Poland
Hungary
Slovakia
Romania
Latvian
Bulgaria
Slovenia
Croatia
Montenegro
Serbia
N.
Macedonia
Bosnia
&
Herz.
High.income
Europ.
Union
Least
Low
Income
Ireland
Norway
USA
Germany
Finland
France
Great
Britain
S.
Korea.
China
GDP
per
capita,
USD
GDP per capita in the groups of countries in 2019, USD
Fig. 1. GDP per capita in three groups of countries and other values in 2019. Explanations are in the text.
It should be noted that the average income values
of the three groups of countries are equal, respectively:
FSU – $ 15,012, FWPB – $ 35,513, FUY – $ 25,248. It
can be seen that the FWPB countries have achieved
higher development, followed by the FUY countries,
the FSU countries have the least results. This differ-
ence between the countries is also visible visually – the
array of columns for the FSU countries is noticeably
lower than the FWPB and FUY. It should be added that
the highest columns on the chart are the developed
countries of the world occupying its right part – from
Ireland ($89,684) and Norway ($70,006) to the United
States (65,298), Finland (53,172) and France (50,993).
Taking into account the fact that the GDP of the Euro-
pean Union is equal to $ 47,828, we see that none of the
countries that came out of 1991 has reached either the
level of the EU or the level of advanced developed
countries.
We see that among the countries of the former So-
viet Union, Russia's GDP per capita is the largest – $
29,181. This value is lower than any the FWPB coun-
tries except Bulgaria. Of the FUY countries, Slovenia
and Croatia are ahead of Russia. Such an achievement
of the former leader of the socialist camp after almost
30 years of development in the new economy is not too
great achievement. The income of the United States ex-
ceeded the income of Russia by 2.4 times, Germany by
1.97 times, Finland by 1.8 times. In terms of GDP per
capita, Russia’s rank is 54th in the world, being be-
tween Malaysia and Oman. It should also be noted that
Russia occupies the 52nd place in the UN list of HDI,
and in the list of 27 countries of the FSU, FWPB and
FUY it is on the 12th place.
Analyzing the countries of the former USSR, we
must note that in addition to Kazakhstan, Belarus,
Georgia and Kyrgyzstan, other countries of the FSU are
much poorer than Russia – their GDP per capita is al-
most half as much.
However, the greatest surprise and regret is caused
by Tajikistan, whose income, as can be seen from Fig.
1, is close to the poorest World countries – low income
and the least developed. This is a self-supporting catas-
trophe that has been going on for many years.
However, the author knows that mathematical sci-
ence in Tajikistan is not destroyed – in these conditions,
high-quality scientific articles are published, and new
generations of scientists are being trained at the Tajik
National University at its 18 faculties.
An attentive reader has undoubtedly noticed that
the GDP per capita in China ($16,804) is not so much,
it is less than the average income in the European Un-
ion, its level slightly lower than Belarus ($19,997) and
slightly higher than Bosnia and Herzegovina ($16,289).
This is due to the specific development of this country.
With China's total income comparable to the United
States, the income per person is low – rapid high-tech
development does not occur throughout all the country,
and with a high population, the income per person lags
behind the income of a resident of Belarus. We will re-
peatedly see this phenomenon of transformation of
great achievements when moving to the level of one
resident of China during subsequent aalysis.
Another conclusion, following from the analysis
of Fig. 1, is that the countries of the FWPB and FUY
have not achieved the results of the advanced countries
14 Norwegian Journal of development of the International Science No 70/2021
of Europe and the world. Obviously, the system of par-
ticipation of these countries in the EU has flaws that
have not yet become clear. The idea comes that a suffi-
ciently rich European Union could organize active ma-
terial and technological support for new countries join-
ing it, such as, for example, the European equivalent of
the Marshall Plan. However, it seems that these coun-
tries have received a very "light" form of such assis-
tance.
Let's consider the growth rates of GDP per capita
in 2019 in the studied groups of countries (Fig. 2). We
will immediately notice unexpected phenomena. The
average growth rates of GDP per capita in the three
groups of countries studied by us were FSU – 3.6%, the
FWPB – 3.9% and the FUY – 3.5%. Unexpectedly
these rates exceed not only the European Union
(1.87%), but also the advanced countries – Denmark –
2.41%, Greece – 2.03%, the USA – 1.68%, France –
1.37%, Belgium – 1.24%, Finland – 1.06%. In the pe-
riod of 2012-2019, the pace of development was even
less. The exceptions were the countries with special de-
velopment, China – 5.73% and Ireland – 3.97%.
7.38
5.47
5.16
4.48
3.83
3.60
3.16
2.34
1.41
1.40
1.37
4.89
4.78
4.64
4.63
4.55
4.43
2.82
2.18
1.95
4.81
4.08
3.39
3.37
3.18
2.49
1.87
5.73
3.97
2.41
2.03
1.37
1.24
1.68
0
2
4
6
8
10
Armenia
Moldova
Georgia
Tajikistan
Ukraine
Uzbekistan
Kazakhstan
Kyrgyzstan
Russia
Belarus
Azerbaijan
Lithuania
Romania
Hungary
Estonia
Poland
Bulgaria
Latvian
Slovakia
Czech
Serbia
Montenegro
Bosnia
and
Herz.
Croatia
C.
Macedonia
Slovenia
Europ.
Union
China
Ireland
Denmark
Greece
USA
France
Belgium
Percentage
of
GDP
growth
per
capita
GDP per capita growth rate in groups of countries in 2019, %
Fig. 2. GDP growth rates per capita in the countries of the FSU, FWPB and FUY and the advanced developed
countries of the world in 2019. The system of data presentation and notation, as in Fig.1.
The low rates of advanced developed countries,
extremely small in terms of their usual development,
indicate that most of them are still exposed to the ongo-
ing systemic crisis of the economy. It is hard to believe
that the financial crisis of developed countries, which
is usually talked about in the West, has been recurring
several times over the past 12 years.
As already mentioned, from Fig. 2 it can be seen
that the countries of the FSU, FWPB and FUY have
growth rates significantly higher than the advanced
countries. This circumstance confirms the fact discov-
ered earlier by A.M. Tarko that in the years of increas-
ing crisis, the richest countries are primarily exposed to
it, the decline in the development of the less rich occurs
a few years later [5, 6].
It should be noted that Russia, Belarus and Azer-
baijan have the lowest rates of development not only in
their group, but in comparison with the countries of the
FWPB and FUY– Russia – 1.41%, Belarus – 1.40,
Azerbaijan – 1.37%. Undoubtedly, each "failure" in the
growth rate has its own reasons; first of all, this can be
seen in the economic crisis and a decrease in oil sales
in the years under review.
Consumption of electricity per capita is important
characteristic of the both – the standard of living of a
person and the level of economic and technological de-
velopment of his country. These data are presented in
Fig. 3.
Norwegian Journal of development of the International Science No 70/2021 15
6
603
5
600
3
680
3
419
2
694
2
679
2
202
1
962
1
941
1
726
1
645
1
499
6
732
6
259
5
137
4
709
3
972
3
966
3
821
3
507
2
584
6
728
4
612
4
272
3
714
3
497
3
447
8
929
6
022
7
035
6
940
5
130
3
927
10
497
12
997
0
1 500
3 000
4 500
6 000
7 500
9 000
10 500
12 000
13 500
15 000
Russia
Kazakhstan
Belarus
Ukraine
Georgia
Turkmenia
Azerbaijan
Armenia
Kirghizia
Moldova
Uzbekistan
Tajikistan
Estonia
Czech
Slovakia
Bulgaria
Poland
Hungary
Lithuania
Latvia
Romania
Slovenia
Montenegro
Serbia
Croatia
N.
Macedonia
Bosnia
and
Hertz.
High
income
Euro
Union
Finland
USA
S.
Korea
Germany
France
Great
Britain
China
kWh
per
capita
Electricity consumption in groups of countries in 2014, kWh per capita
15 249
Fig. 3. Electricity consumption in the countries of the FSU, FWPB and FUY and in the advanced developed
countries of the world in 2014 (kWh per capita)
In the given year the electricity consumption (kWh
per capita) of four countries that came out of 1991 –
Estonia (6,7), Slovenia (6,7), Russia (6,6) and the
Czech Republic (6,3) exceeded the average value in the
European Union – 6,0. At the same time, the electricity
consumption of Finland (15,3) exceeds Russia by 2.3
times, the USA (12,9) – by 2 times, South Korea (10,5)
– by 1.6 times. It means that advanced developed coun-
tries live in more comfortable conditions. The average
values of electricity consumption – FSU – 2,9, FWPB
– 4,521, FUY 4,378 – are less than the average value of
the European Union (6,0). At the same time, the lowest
power consumption is in the countries of the FSU.
3. Demography
Let us turn to the analysis of demographic pro-
cesses. This article was written for the purpose of as-
sessing the development of countries, so we hope to ap-
ply the demography not only as the tradition science of
population reproduction, but for our purposes – the
analysis of socio-economic processes. Let's start with
current healthcare spending in 2019. (Fig. 4). We will
express health care expenditures not in traditional
shares of countries ' incomes, but in real monetary
terms per capita.
16 Norwegian Journal of development of the International Science No 70/2021
1
488
1
275
1
132
1
037
796
784
683
634
480
459
260
250
3
041
2
428
2
313
2
180
2
115
2
015
1
896
1
634
1
576
3
158
1
876
1
711
1
485
1
301
1
073
5
972
4
205
219
193
6
098
5
250
4
504
4
457
3
214
935
0
500
1 000
1 500
2 000
2 500
3 000
3 500
4 000
4 500
5 000
5 500
6 000
6 500
7 000
Russia
Turkmenistan
Belarus
Armenia
Georgia
Kazakhstan
Ukraine
Azerbaijan
Moldova
Uzbekistan
Kyrgyzstan
Tajikistan
Czech
Estonia
Lithuania
Slovakia
Hungary
Poland
Latvian
Bulgaria
Romania
Slovenia
Croatia
Montenegro
Serbia
Bosnia
&
Herz.
N.
Macedonia
High-income
European
Union
Low
income
Least
devel.
USA
Germany
France
Japan
Finland
S.
Korea.
China
PPP
dollars
Current health expenditures per capita in groups of countries in 2019, PPP dollars
10 624
Fig. 4. Current health expenditures per capita in groups of countries in 2019, taking into account purchasing
power parity (PPP)
We can see from fig. 4 that in 2019, an average
value of expenditure in the FSU was of $ 773 per per-
son. The expenses in the FWPB group were the larger
- $ 2,133, in the FUY they are slightly less – $ 1,767.
The European Union spent much more per person – $
4,205. This means that were in the countries of the FSU,
on average, spent 5.4 times less. the expenditure on
healthcare in Russia amounted to $ 1,488, was 3 times
less than in the European Union.
The largest expenditure on health care in FWPB
was in the Czech Republic – $ 3,041 (2.0 times more
than in Russia), and in the FUY – $ 3,158 (2.1 times
more than Russia). It should be noted that health care
costs in the United States were $ 10,624, in Germany –
$ 6,098, in Finland – $ 4,457 – respectively, the costs
were 7.1, 4.1 and 3 times more than Russia. Thus, in
relation to healthcare in Russia, the costs are from 3 to
7 times less than in advanced developed countries.
An important fact in the development is that the
Central Asian countries – Kyrgyzstan and Tajikistan –
live in a special world. Having incomes close to the
poorest and least developed countries, they have (as can
be seen from Fig. 4), Tajikistan's income is 8.3 times
less than Russia's) and health care close to these coun-
tries in Tajikistan – $ 250 – is 5.9 times less than Rus-
sia,
The backlog of three groups of studied countries
cannot be proud of the data on life expectancy at birth
(LE) (Fig, 5). The lag countries of the FSU, FWPB and
FUY lag far behind other European countries. The av-
erage values of LE for the three groups of countries are
72.4 years, 76.7 years and 77.6 years. The value of the
European Union is noticeably greater – 81.1 years. For
Russia with an LE equal to 73.2 years – this is an 8-year
lag. None of the three groups of countries of the FSU,
FWPB and FUY, with the exception of Slovenia (81.3
years), exceeds the average value in the EU. These
countries are at the bottom positions in Europe. Also,
for example, the LE of Japan, 84.4 years, is more than
Turkmenistan, 68.2 years, by 16 years, while the LE of
Turkmenistan is close to the value of the least devel-
oped countries – 65.35 years.
Norwegian Journal of development of the International Science No 70/2021 17
75.1
74.2
73.8
73.2
73.1
73.0
71.9
71.8
71.7
71.6
71.1
68.2
79.1
78.5
77.9
77.5
76.1
76.0
75.5
75.2
74.9
81.3
78.4
77.4
76.9
75.8
75.7
81.1
65.3
84.4
82.6
81.8
81.2
80.9
78.8
76.9
60
65
70
75
80
85
Armenia
Belarus
Georgia
Kazakhstan
Russia
Azerbaijan
Moldova
Ukraine
Uzbekistan
Kyrgyzstan
Tajikistan
Turkmenista
Czech
Estonia
Poland
Slovakia
Lithuania
Hungary
Romania
Latvian
Bulgaria
Slovenia
Croatia
Bosnia
&
Montenegro
N.Macedonia
Serbia
Euro
Union
Least
devop.
Japan
France
Finland
Great
Britain
Germany
USA
China
LE,
years
Life expectancy at birth (LE) in gropups of countrues in 2019 г., years
Fig. 5. The values of the life expectancy for groups of countries in 2019
Let's consider another demographic indicator – in-
fant mortality in 2019. (Fig. 6). This value in Russia
4.9, it is is higher than normal values in Europe. The
average infant mortality values per 10,000 deaths are
14.3 in the FSU, 3.7 in the FWPB, 3.8 in the FUY. In
the European Union, this parameter equals – 3.32, and
in high-income countries 4.3. In some of these coun-
tries, the minimum values in Europe are reached, but
there are also countries with infant mortality that has
not gone far from the Middle Ages – in Turkmenistan
it is 36.3, while this mortality in the least developed
countries is 44.8. In all the republics in Central Asia,
the child mortality rate is higher than 15, and this situ-
ation has not been corrected for many years.
Fig. 6. Infant mortality values for groups of countries in 2019
Our next parameter is maternal mortality. in 2019
(Fig. 7). Its value in Russia – 7 is the same as in Ger-
many. However, the average values of the countries of
the FSU – 9.7, FWPB – 9.7, FUY – 8.3 exceed the
value in the European Union – 6.0. Here the situation is
similar to the situation of infant mortality – some coun-
tries have minimum values in Europe, but especially in
the countries of Central Asia there are countries with
extremely high mortality – in Kyrgyzstan, the maxi-
mum is 60. Just as in the Central Asian regions, the de-
crease in this type of mortality is very slow.
18 Norwegian Journal of development of the International Science No 70/2021
Fig. 7. Maternal mortality values for groups of countries in 2017
There is a new parameter of demography – the
probability that men will survive to 65 years (Fig. 8).
Again, we see the lowest row of columns belonging to
the FSU countries group. On average, the probability of
living to 65 years in the countries of the FSS is 67.4%,
the FWPB is 73.9%, and the countries of the FYU are
80.6%. The most noticeable result here is a unique phe-
nomenon that Russia has the lowest probability of sur-
vival among all the countries under consideration –
60.8%! The most dangerous and sad circumstance is
that Russia's value is closest and almost equal value to
low-income countries 59.5% and least developed coun-
tries 62.2%. This indicates the extraordinary social sit-
uation of life in a country that was once a landmark of
a bright future. Unfortunately Ukraine and Turkmeni-
stan show close, not much greater values to Russia.
Probability of surviving to 65 in the European Union is
84.4%. We see a very big difference. And the greater
difference shows Ireland-89.3%, Norway – 89.1%, ,
South Korea-88%, Great Britain-87.2%.
74.7
73.2
72.0
71.7
68.4
68.0
67.8
67.5
63.9
61.9
61.2
61.1
83.1
77.3
77.1
77.1
73.8
73.2
72.1
67.8
66.9
85.8
81.1
81.0
80.1
79.6
77.3
69.1
62.6
89.4
89.3
85.7
85.6
85.3
83.5
79.9
88.2
60
65
70
75
80
85
90
Azerbaijan
Armenia
Tajikistan
Uzbekistan
Kyrgyzia
Georgia
Kazakhstan
Belarus
Moldova
Ukraine
Turkmenistan
Russia
Czechia
Slovakia
Estonia
Poland
Hungary
Romania
Bulgaria
Latvia
Lithuania
Slovenia
Bosnia
and
Herz.
Croatia
Montenegro
North
Macedonia
Serbia
Euro
Uniom
Low
input
Ireland
Norway
Korea
S.
Germany
Finland
France
China
USA
Survival
to
65
years,
%
of
cohort
Probability of survival to 65 years in groups of countries, men (% of the cohort) 2019
Fig. 8. The probability of surviving to the age of 65 in 2018 for men of the country groups
Norwegian Journal of development of the International Science No 70/2021 19
Let's consider the share of the population 65 years
and older in the countries (Fig. 9). Here Russia is on the
3rd place among the countries of the FSU, but it is in-
ferior to many countries of the FWPB and FYU. The
average values of the percentage state of the three
groups of countries - FSS-9.7%, FVDB-19.4% , FYU-
17.7% show that the share of the elderly is the smallest
in the FSU countries.
The next effect we see countries of Central Asia:
a situation consisting of a well-known respect for the
elderly, but their number is the smallest among all other
1991 countries. This parameter is slightly smaller that
in low income countries of the world (3.3): Kyrgyzstan
– 4.60 – Uzbekistan – 4.60 – Turkmenistan – 4.59 –
Tajikistan – 3.09.
Having the highest child mortality and the small-
est proportion of elderly people countries are a slowly
eliminate developmental defect that has been going on
since ancient times.
16.7
15.2
15.1
12.0
11.5
7.7
6.4
4.6
4.6
4.6
3.1
21.3
20.3
20.2
20.0
19.8
19.7
18.8
18.1
16.2
20.9
20.2
18.7
17.2
15.4
14.1
20.5
3.3
21.6
18.5
17.3
16.2
11.5
22.1
28.0
15.1
0
3
6
9
12
15
18
21
24
27
Ukraine
Belarus
Russia
Georgia
Moldova
Armenia
Kazakhstan
Azerbaijan
Kyrgyzstan
Uzbekistan
Turkmenistan
Tajikistan
Bulgaria
Latvian
Lithuania
Estonia
Czech
Hungary
Romania
Poland
Slovakia
Croatia
Slovenia
Serbia
Bosnia
and
Herz.
Montenegro
N.
Macedonia
European
Union
Low.income
Japan
Finland
Germany
Great
Britain
Norway
USA
China
Percentage
from
total
population
Population ages 65 and above, in groups of countries in 2019 г., % of total population
Fig. 9. The share of the population 65 years and older in groups of countries in 2019
4. Socio-psychological violation at a national
scale
Now let's move on to the study of unexpected so-
cio-political disorders in large population groups with
the help of using demographic parameters.
We will make a new application for demographic
parameters – will use them as indicators of socio-psy-
chological disorders of large of population groups [9].
The author of this paper apparently, is the first who
found and applied such use to demographic parameters
on a national scale. This phenomenon is first to be de-
tected as incomprehensible and unpleasant phenome-
non, then to determine its etiology.
For example, in space medicine the author knows
about this [2]. When specialists learned to support a rel-
atively long stay of an astronaut in the orbit, a bad
changes in the electrocardiogram were detected. It
looked like a strong incomprehensible pathology. Soon
it was found that with a sufficiently long stay in weight-
lessness in the absence of gravity, the internal organs
begin to shift in the body. This gave the appearance of
a view of strong pathology of the electric cardiogram.
When the phenomena was understood, doctors quickly
learned to deal with the case.
So the first large-scaled socio-psychological vio-
lation is the emergence of migration of the largest of
the population groups of the EU countries from their
native countries to its richer countries. The indicator of
this was the strong increase of the death rate of popula-
tion.
If we consider the points of the values of the coun-
tries of the world in the plane of the coordinate axes "
crude death rate " and "LE" (Fig. 10), we can expect
that the values of mortality will decrease with increas-
ing of LE – the points will occupy the diagonal of the
corresponding plane of parameters. However, recently,
in the range of LE values of 72-77 years, the points
have stopped following this direction – in a number of
countries death rate in this range has significantly in-
creased! Thus, now the maximum world death rate is
15.5 per 1000 in 2019. It was registered in Bulgaria,
and this country with the highest mortality rate in the
world, overtaking the traditional champions – the poor-
est countries in Africa. Now it is joined by Ukraine –
14.7, Serbia – 14.6, Latvia – 14.5, Lithuania – 13.7, Ro-
mania – 13.4, and other countries.
20 Norwegian Journal of development of the International Science No 70/2021
Fig. 10. The relationship death rate and life expectancy in the world in 2018 The values of the countries of the
FSU, FWPB, FUY and several developed countries of the world are highlighted
In this case, people have started moving to richer
countries. Mentioned migration originated several
years ago in Europe. A part of the young working-age
population that joined the EU or has not yet joined took
advantage of free movement and have started moving
to richer European countries. The remaining elderly
population in their country, in accordance to the Gom-
pertz law, has a significantly higher death rate, which
is manifested in the statistics of these countries in the
form of a "paper" increase of mortality. This phenome-
non unintentionally compromised the demographic pa-
rameter of total mortality. Statistics have shown an in-
crease in total mortality in such countries to values
higher than the maximum mortality in the poorest coun-
tries of the world. It should be noted that the mortality
parameter in this case has become an indicator of a se-
rious change in the socio-psychological state of the
people. The author of this article wrote about this phe-
nomenon several years ago [6, 8].
It should be noted that Bulgaria has the largest
number of elderly people among all the countries we
are considering – 21.3% (Fig. [9]). This confirms that
after moving to work in richer countries of Europe,
young workers gave the world not only the highest mor-
tality rate, but also a high percentage of the remaining
elderly people in the country.
Now the increase in migration of population to
other countries in an increasingly free world is making
larger. This can be perceived as one of the manifesta-
tions of the idea of the devil's pump of N. N. Moiseev
[3]. The difference is that he believed that rich countries
would take talented people from developing countries,
but it turned out that modern migration attracts every-
one – f the lowest-paid professions to talented people.
According to the forecast of A. N. Chumakov and
Stychinsky [11] migration from less developed to more
developed countries in a few years will significantly in-
crease worldwide and will become a new factor of
world development.
Another manifestation of the change in socio-psy-
chological living conditions in Europe is a significant
increase in negative expectations of the population in
some countries, the main of which, apparently, are Rus-
sia, Belarus and Ukraine. A parameter is responsible for
this is the difference between the life expectancy of
women and men (DLE) (Fig. 11). This parameter was
proposed by A. M. Tarko a few years ago [6]. He came
to the conclusion that DLE is an indicator of unfavora-
ble and unachievable social expectations of large
groups of people in society.
On the graph of the DLE in 2019 (Fig. 11) we see
that the maximum values of DLE have Belarus – 10.1
years, Ukraine – 10.06 years and Russia – 9.93 years.
The remaining values among the FSU countries are no-
ticeably less.
In the FWPB countries the situation with the max-
imum values of DLE is almost completely repeated for
the case of maximum values of the FSU – countries:
Lithuania – 9.50 years, Latvia – 9.10 years and Estonia
– 8.40 years. There is no something like this in the ad-
vanced developed countries of the world – in the EU
countries, the average values of DLE are 5.4 years, in
high-income countries 5.2 years.
Norwegian Journal of development of the International Science No 70/2021 21
10.10
10.06
9.93
8.79
8.53
8.48
8.20
7.19
7.01
4.94
4.45
4.24
9.50
9.10
8.40
7.70
7.50
7.00
6.50
6.40
5.80
6.20
5.70
5.30
4.96
4.86
4.05
5.37
5.19
3.79
6.04
5.30
5.10
4.80
4.48
4.48
3.70
3
4
5
6
7
8
9
10
11
Belarus
Ukraine
Russia
Georgia
Moldova
Kazakhstan
Kyrgyzstan
Armenia
Turkmenistan
Azerbaijan
Tajikistan
Uzbekistan
Lithuania
Latvian
Estonia
Poland
Romania
Bulgaria
Slovakia
Hungary
Czech
Croatia
Slovenia
Serbia
Bosnia
&
Herz.
Montenegro
N.
Macedonia
European
High
income
Least
devel.
Japan
Finland
USA
Germany
China
China
Great
Britain
DLE,
years
Difference between LE of women and men (DLE) in groups of countries in 2019, years
Fig. 11. The difference in the LE of women and men (DLE) in groups of countries in 2019
The mechanism of the "action" of DLE is known.
In unfavorable conditions with negative and uncertain
expectations, a genetic difference in the physiological
properties of women and men is manifested – in men,
mortality increases significantly more strongly. This is
explained by the diseases that occur to a greater extent
in life – threatening diseases – heart attacks, strokes and
others. This is confirmed by many studies – including
data from ambulance workers [1]. It is worth noting that
in 2019 in Russia, the LE of women is 78.2 years, and
men – 68.2. The difference in the time of life between
women and men 10 years - is not present either in the
poorest or in the richest countries.
Recently, the author found that the number of sui-
cides in Russia, Belarus and Ukraine, as well as Lithu-
ania and Latvia, are the largest in Europe (Fig. 12), and
these countries with the highest DLE (Fig. 6) and the
largest suicides are the same countries. This is the most
reliable confirmation of the fact that the DLE charac-
terizes the unfavorable situation and negative expecta-
tions of the population.
34.5
32.7
29.0
22.2
22.0
13.0
8.5
6.5
6.1
5.0
4.3
35.8
28.5
17.8
17.8
17.6
17.0
15.0
13.2
23.1
21.3
17.2
13.1
10.3
9.1
11.7
5.7
12.4
8.1
7.8
3.6
17.5
23.3
2.9
10.9
0
5
10
15
20
25
30
35
40
Russia
Ukraine
Belarus
Kazakhstan
Moldova
Georgia
Kyrgyzstan
Uzbekistan
Turkmenistan
Azerbaijan
Armenia
Tajikistan
Lithuania
Latvian
Estonia
Slovakia
Hungary
Poland
Czech
Romania
Bulgaria
Slovenia
Montenegro
Croatia
Bosnia
and
Serbia
N.Macedonia
Europ.
Union
Least
devel.
Korea
S.
USA
Germany
Norway
Great
Br.
China
Difference
of
suicides,
per
100,000
Difference in suicides number of men and women in groups of countries in 2019, per 100,000
Fig. 12. Difference of suicides numbers of men and women in groups of countries, per 100,000
22 Norwegian Journal of development of the International Science No 70/2021
According to A.M. Tarko this DLE parameter is
not the only one parameter of manifestation of this neg-
ative socio-psychological state of the population. An-
other indicator is the crude death rate: the population of
Russia is not prone to mass migrations, but the graph
Fig. 8 clearly shows an increase in death rate [5].
It should be added that unfavorable conditions
with a lack of decent work, unemployment and other
negative conditions contribute to an increase in mortal-
ity among men. A few years ago, Federal State Statis-
tics Service (ROSSTAT) data showed that there is a
group of about 20 regions mainly around the Moscow
region, in which the total mortality is higher than the
largest in the world [5??6]. This situation has been go-
ing on for several years and has persisted until 2019.
This case shows that the demographic parameter
acquires a bright social significance. For Russia to be
the last country in Europe with an important parameter
that characterizes social life is an unfavorable phenom-
enon. It is undoubtedly another indicator of trouble.
It should be noted that Bulgaria has the largest
number of elderly people among all the countries which
we are considering – 21.3% (Fig. 9). This seems to con-
firm the situation that after moving to work in richer
European countries, young workers gave the world not
only the highest mortality rate, but also a high percent-
age of the remaining elderly people in the country.
5. Technical and high-tech development
To analyze the high-tech development of the
world countries, almost the same parameters will be
needed as in the analysis of the development of a con-
ventional economy, but in a specific area that requires
an understanding of the essence of high-tech produc-
tion. [12]. These parameters express complex interac-
tions of special economic processes that depend both
on the decisions of the leaders of countries and on or-
ganizations that create high-tech products. The possi-
bility of creating high-tech products depends both on
the level of development of the country, the focus of
development on obtaining high-tech production, wealth
and a well-developed higher education system in the
country.
Let's consider the share of income of three groups
of countries from the production and export of high-
tech products in relation to all industrial products in
2019. (Fig. 13). The average values here are as follows:
FSU – 8.3%, FWPB – 12.8%, FUY – 6.3%. We see that
the FWPB countries have overtaken both the FSU and
the FUY. However, out of all three groups of countries,
the representative of the FSU – Kazakhstan was in the
first place (28.8%). Russia came in second place in the
FSU group (13%). Exports of the Czech Republic,
Hungary and Latvia amounted to 20.8%, 17.5% and
17.2%, respectively, which is significantly more than
that of Russia. However, only Kazakhstan and the
Czech Republic surpassed the high-income countries
(20.6%) and the European Union (16.1%). But these
achievements are small compared to, for example,
South Korea (32.4%), China (30.8%), France (27.0%)
and Ireland (26.0%). As a result, Russia is on the 9th
place in terms of high – tech exports – between Roma-
nia and Poland. This position of Russia shows that
high-tech exports are not the main point of its develop-
ment. As we will see, its raw material exports provide
a major share of income.
Fig. 13. Exports of high-tech products in groups of countries, percents of merchandise exports in 2019 is shown
Let's consider the high-tech exports expressed in
US dollars of the countries and groups of countries
which we are studying, (Fig. 14). I would like to draw
attention to the fact that Russian high-tech exports are
significantly ahead of the FSU countries, and only the
Czech Republic, Poland and Hungary are ahead of it
among the FWPB countries, it is the highest among the
FUY countries. Among countries under consideration,
Norwegian Journal of development of the International Science No 70/2021 23
the situation with high-tech products is better than that
of Russia, only the Czech Republic – by 3.5 times, Po-
land – by 2.2 times and Hungary – by 1.8 times.
Russia many years ago was advanced country in
the world, but now we must point out that now China
has 71.9 times more high-tech exports than Russia,
Germany – 20.6 times, South Korea – 18.9 times, the
United States – 15.3 times, France – 11.6 times. In gen-
eral, Now Russia is on the 30th place in the world in
this parameter, ahead of Denmark and Slovakia and be-
hind Israel and Brazil.
Fig. 14. Export of high technologies in groups of countries of the world in 2019 US dollars. A logarithmic scale
is applied along the horizontal axis.
It should be noted that most of the countries of the
FSU – except Kazakhstan and Belarus – have very
small high-tech exports (Fig 15). So, if Kazakhstan's
exports are 20.7% of Russia, Belarus – 6.97%, then Ar-
menia's exports are 0.42%, Kyrgyzstan – 0.28%, Azer-
baijan – 0.26%, Moldova – 0.23%, Uzbekistan –
0.19%, Georgia – 0.18%. Tajikistan, unfortunately, has
no data on high-tech exports at all.
Fig. 15. Export of high-tech production in groups of countries in percents of merchandise export in 2019
24 Norwegian Journal of development of the International Science No 70/2021
Foreign direct investment in the economy is used
for various purposes, but most importantly – it allows
you to deploy useful activities of foreign capital on the
territory of your country. The influence of foreign di-
rect investment allows for the introduction of more ad-
vanced production technologies, more advanced equip-
ment, the production of more advanced products, the
import of more advanced management technologies.
Information about foreign direct investment in the
countries which we are studying presented in Fig. 16.
The average value of direct investment is is 1.87% of
GDP in high-income countries, 1.62% in the European
Union, and 2.89% in low – income countries. Hungary
has the largest investment of 19.6%. At the same time,
Finland – allows itself to have investments – 5.9%,
Norway – 3.16%, the United States – 1.64%, China –
1.09%. As for the analyzed countries, they do not have
less than 1.85%. Russia in this area shows one of the
smallest values – 1.88%. Here it should be noted that
even poor Tajikistan has direct investments 2.62%. It is
worth noting that Turkmenistan (4.80%), Uzbekistan
(4.%) and Azerbaijan (3.13%) have one of the largest
direct investments.
Fig. 16. Foreign direct investment in groups of countries in 2019
The largest value of foreign investment belongs to
Georgia – 7.67%. This circumstance may be explained
by the special attitude of Western companies in special
conditions when the country ranks penultimate among
three countries that came out of 1991 in terms of ex-
ports of high-tech products as a percentage (ahead of
Uzbekistan) (Fig. 7) and penultimate in terms of ex-
ports in monetary units (ahead of Estonia) (Fig. 8).
Computer communication services are the most
important type of activity that cannot be replaced by
other actions. This includes international telecommuni-
cations, computer data processing, and news operations
between residents and non-residents; these are con-
struction services, business, professional and technical
services, and much more. Now both globalization and
the life of ordinary people is impossible without these
services. Different European countries participate in
this activity in different ways (Fig. 17). On average,
commercial services occupy 54% in the European Un-
ion%.
However, the distribution of these services varies
markedly in different countries. Ireland performs a
maximum – 81.7% of these works, Finland – 73.8%
of these works, China – 62.6%, .South Korea. – 51.4%,
USA – 48.9%, Norway – 34.0%. This distribution of
work has developed historically. The reader will be in-
terested to know that Ukraine is in the first place in the
FSU countries – 53.1% and Belarus – 48.2%. Russia
makes a little less – 45.8%. Volumes of work in FSU
are smaller than the FWPB countries and some of the
FUY countries. However, here we are surprised by the
sharp decline in the performance of these works among
some of the countries of the FSU – from Armenia –
22.3% and Azerbaijan – 21.3%, to Uzbekistan – 9.9%
and Georgia – 4.4%. It should be noted that poor Kirgi-
zia and Tajikistan perform more computer services than
richer Kazakhstan and Uzbekistan. This is a manifesta-
tion of their higher scientific training, received back in
the time of the USSR.
Fig. 17 shows that in 2019 minimum of communi-
cation work in three groups of countries is carried out
in Georgia. It is difficult to explain this phenomenon
for Georgia, which is aspiring to European structures.
In addition, as mentioned, it is the penultimate among
the countries of the FSU, FWPB and FUY for the ex-
port of high – tech products.
Norwegian Journal of development of the International Science No 70/2021 25
53.05
48.17
46.72
45.76
22.35
21.28
14.74
13.49
11.82
9.94
4.41
57.16
51.07
50.44
49.06
48.13
43.90
41.78
35.12
27.76
59.06
52.89
36.12
28.76
20.65
14.23
53.68
73.79
62.63
56.24
53.91
51.72
48.86
0
10
20
30
40
50
60
70
80
Ukraine
Belarus
Moldova
Russia
Armenia
Azerbaijan
Kyrgyzstan
Tajikistan
Kazakhstan
Uzbekistan
Georgia
Romania
Poland
Czech
Hungary
Estonia
Slovakia
Latvian
Bulgaria
Lithuania
Serbia
N.
Macedonia
Slovenia
Bosnia
and
Herz.
Croatia
Montenegro
European
Union
Finland
China
Germany
France
Great
Britain.
USA
Percentage
of
commercial
service
exports
Computer, communications and other services in ggoups of countries in 2019, % of commercial service exports
Fig. 17. Computer and communication services in groups of countries in 2019 (% of exports)
An element of scientific and technical work is the
writing and publication of scientific and technical arti-
cles. Fig. 18 shows information about the publication
of scientific and technical articles in journals in 2018.
We see that Russia was the birthplace of 81 thousand
works in 2018. Almost 8 times fewer articles were pub-
lished in Ukraine. However, the rest of the FSU coun-
tries have published much fewer articles. Poland pub-
lished 35 thousand of papers, it is maximum of FWPB.
However, all these values are much less than the num-
ber of production published in China – 528 thousand,
the United States – 422 thousand. The output of Ger-
many – 104 thousands, 22% more than Russia.
81
579
10
380
2
367
1
180
761
550
521
354
210
137
62
4
35
663
15
577
10
345
6
701
5
322
3
311
2
267
1
418
1
415
4
523
4
277
3
206
704
493
250
97
681
66
376
5
308
10
876
104
396
422
808
528
263
524
444
1
10
100
1 000
10 000
100 000
1 000 000
Russia
Ukraine
Kazakhstan
Belarus
Azerbaijan
Georgia
Armenia
Uzbekistan
Moldova
Kyrgyzstan
Tajikistan
Turkmenistan
Poland
Czech
Romania
Hungary
Slovakia
Bulgaria
Lithuania
Latvian
Estonia
Serbia
Croatia
Slovenia
Bosnia
and
Herz.
N.
Macedonia
Montenegro
European
Union
Least
developed.
Low
income
China
USA
Germany
Great
Britain
South
Korea.
Scientific and technical journal articles In groups of countries in 2018.
Fig. 18. The number of papers published in scientific and technical journals of different countries in 2018 A
logarithmic scale is applied along the horizontal axis.
26 Norwegian Journal of development of the International Science No 70/2021
6. Extraction and export of raw materials and
of natural resources
When we turn to the raw materials sector and to
the economy of Russia and other countries, we will see
that the most popular is oil production. According to
British Petroleum (table 1) [13] Russia in 2019 was on
the second place in the world, Kazakhstan was on the
13th, Azerbaijan on the 24th place.
Table 1.
Oil production in million tones in 2019 according to British Petroleum [13].
Country Млн т
1 USA 746,7
2 Russia 568,1
3 Saudi Arabia 556,6
4 Canada 274,9
5 Iraq 234,2
6 China 191,0
7 United Arab Emirates 180,2
8 Iran 160,8
9 Brazil 150,8
10 Kuwait 144,0
11 Nigeria 101,4
12 Mexico 94,9
13 Kazakhstan 91,4
14 Qatar 78,5
15 Norway 78,4
16 Angola 69,1
17 Algeria 64,3
18 Libya 57,8
19 Great Britain 51,8
20 Oman 47,3
21 Colombia 46,7
22 Venezuela 46,6
23 Indonesia 38,2
24 Azerbaijan 38,1
25 India 37,5
26 Egypt 33,6
27 Malaysia 29,8
28 Argentina 28,8
29 Ecuador 28,5
30 Australia 20,6
31 Congo Rep. 17,4
32 Thailand 17,0
33 Turkmenistan 12,5
34 Vietnam 11,4
35 Gabon 10,9
36 Equatorial Guinea 8,2
37 South Sudan 6,8
38 Chad 6,7
39 Peru 6,1
40 Brunei 5,9
41 Sudan 5,0
42 Denmark 5,0
43 Italy 4,3
44 A country. 4,2
45 USA 3,7
46 Russia 3,6
47 Saudi Arabia 2,8
48 Canada 2,3
49 Iraq 1,0
Norwegian Journal of development of the International Science No 70/2021 27
Fuel sales are more volatile – economic and polit-
ical factors change more often than equipment for oil
production, transportation and refining (Fig. 19). In
2019. Russia was on the 2nd place in terms of export
share after Kazakhstan among the FSU countries and
was inferior to Norway in Europe. At the same time, its
share of exports was 4.2 times more than that of high-
income countries and 11.2 times more than the Euro-
pean Union.
91.7
70.0
52.7
25.1
24.9
7.6
3.7
2.1
1.8
14.6
5.2
4.1
3.0
2.8
2.6
1.9
20.8
10.6
5.2
1.7
62.1
13.5
9.5
8.5
7.9
3.5
0.047
1.9
2.1
9.8
0
10
20
30
40
50
60
70
80
90
100
Azerbaijan
Kazakhstan
Russia
Belarus
Uzbekistan
Kyrgyzstan
Armenia
Georgia
Ukraine
Moldova
Lithuania
Bulgaria
Latvian
Romania
Slovakia
Hungary
Poland
Czech
Montenegro
Croatia
Bosnia
and
Herz.
Slovenia
N.
Macedonia
Norway
USA
Great
Britain
Finland
South
Korea.
Italy
Germany
China
Экспорт
топлива,
%
от
экспорта
Fuel exports in groups of countries in 2018, % of merchandise exports
Fig. 19. Fuel exports on the international market in 2019 in groups of countries. A logarithmic scale is applied
at the horizontal axis.
If we compare Russia's fuel exports on the inter-
national market (52%) and the export of high-tech
products in the export of industrial products (13%)
(Fig. 12), then we can conclude that this is a raw coun-
try with elements of high-tech development. Since Rus-
sia is on the 2nd place in these two indicators, behind
Kazakhstan among the FSU countries, and the fact that
the decrease in the values of other FSU countries is ap-
proximately the same in these cases, it can be con-
cluded that other FSU countries are developing in the
same direction as Russia, their main part of their in-
come is fuel sales. The other part is developing on a
smaller scale - high-tech sales.
According to British Petroleum, oil consumption
in 2019 was as follows (Fig. 19): FSU – 28.3 million
tons, FWPB – 5.6 million tons, FUY – 2.3 million tons.
According to the data of Table. 1 and Fig. 20 oil con-
sumption in Russia (150.8 million tons) accounted for
26% of production, in the United States – 112.7%. This
confirms that, unlike the United States, Russia is a typ-
ical raw material country that sells most of the oil from
production. For Kazakhstan, this value is equal to
17.3%, for Azerbaijan – 12.9%, which also indicates
that these two countries are also raw materials.
28 Norwegian Journal of development of the International Science No 70/2021
150.8
15.8
10.1
7.5
7.1
4.9
2.1
10.6
9.9
8.5
5.1
3.9
3.2
1.8
1.5
3.3
2.5
1.1
173.6
106.9
72.4
8.9
8.9
841.8 650.1
1
10
100
1 000
Россия
Казахстан
Украина
Беларусь
Туркменистан
Азербайджан
Узбекистан
Румыния
Чехия
Венгрия
Болгария
Словакия
Литва
Латвия
Эстония
Хорватия
Словения
С.Македония
США
Китай
Япония
Германия
Франция
Норвегия
Финляндия
Млн
т
Потребление нефти в группах стран в 2019 г., млн т
Fig. 20. Oil consumption in groups of countries in 2019 according to British Petroleum (million tons). A
logarithmic scale is applied at the horizontal axis.
The extraction, processing and use of metals has
historically always been a respected business in Russia.
Data on the sale of ores and metals are shown in Fig.
21. Three groups of countries sold the following shares
of their total exports in 2019: FSU – 11.05%, FWPB –
3.30%, FUY – 4.96%. The share of Russia was a con-
siderable share – 6.17%. However, the maximum sale
was in Armenia – 36.12%, Georgia – 17.66%, Kyrgyz-
stan and Kazakhstan – 13.9%, Bulgaria – 12.78%.
These countries significantly support their economies
by selling metals. At the same time, high-income coun-
tries sold significantly less – 3.68%, and the European
Union – 2.64%. Therefore, from the fact that Armenia,
Georgia and Kyrgyzstan have less high-tech exports
than the average of the European Union, it can be con-
cluded that the high-tech exports of these countries give
them less benefit so far.
Fig 21. Export of ores and metals by groups of countries in 2018, % of commodity exports
Fig. 22 shows the export of food in groups of
countries in 2019. Exports of the FSU countries
amounted to 21.9%, FWPB – 11.6%, FUY – 11.6%.
Among the countries of the FSU, the exports of only
Russia and Kazakhstan were less than the European
Union, we can conclude that for the rest of the countries
Norwegian Journal of development of the International Science No 70/2021 29
of this group, food exports provide significant reve-
nues. It should be noted that Moldova's exports
amounted to 56.1% of the exports of goods, Georgia –
37.2%, and Armenia – 31.7%. We know that food ex-
ports are a common form of existence for many coun-
tries, but these three countries receive a significant part
of their income in this way. Apparently, the same can
be said about Lithuania, Latvia and Bulgaria, since they
export high-tech products and sell ores and metals less
than food.
56.1
37.2
31.7
16.2
12.8
10.1
5.8
5.6
20.8
17.3
15.7
13.3
10.3
8.0
4.2
3.6
14.2
9.4
6.9
4.4
9.8
7.8
12.5
12.4
9.3
8.9
6.7
5.4
2.6
1.5
1
10
100
Moldova
Georgia
Armenia
Belarus
Kyrgyzstan
Uzbekistan
Russia
Kazakhstan
Latvian
Lithuania
Bulgaria
Poland
Romania
Hungary
Czech
Slovakia
Croatia
N.
Macedonia
Bosnia
and
Herz.
Slovenia
European
Union
High
income
Norway
France
USA
Ireland
Great
Britain.
Germany
Finland
S.
Korea
Percentage
of
merchandise
exports
Food exports in group of countries in 2019, % of merchandise exports
Fig. 22. Food exports in groups of countries, % of exports of goods
Let's consider commodity exports in groups of
countries (Fig. 23). Russia among countries of 1991 is
in the first place here. Note it is equals to 28.2% of Ger-
many's exports. The second largest export country Po-
land has 17.7%, the third-the Czech Republic has
13.4%. In general, other countries have much less ex-
ports than Germany - for the FSU it is – 3.4% of its
commodity exports, for the FWPB – 6.4% , for the FUY
– 1.1%. These results indicate that each of the countries
that came out of 1991 has a long way to go to turn into
a truly developed country.
57
309
000
000
50
066
000
000
32
960
000
000
19
500
000
000
14
024
000
000
9
695
000
000
3
798
000
000
2
779
000
000
2
640
000
000
1
966
000
000
264
013
000
000
198
881
000
000
123
616
000
000
89
623
000
000
76
873
000
000
33
303
000
000
33
151
000
000
16
105
000
000
15
689
000
000
44
943
000
000
19
630
000
000
17
180
000
000
7
189
000
000
6
578
000
000
465
000
000
5
815
427
000
000
2
499
457
000
000
705
564
000
000
571
465
000
000
469
684
000
000
419
850
000
000
1
250
000
000
1
489
152
000
000
1
643
161
000
000
100 000.000
1 000 000.000
10 000 000.000
100 000 000.000
1 000 000 000.000
10 000 000 000.000
100 000 000 000.000
1 000 000 000 000.000
10 000 000 000 000.000
Russia
Kazakhstan
Ukraine
Belarus
Azerbaijan
Uzbekistan
Turkmenistan
Georgia
Moldova
Armenia
Kyrgyzstan
Tajikistan
Poland
Czech
Hungary
Slovakia
Romania
Bulgaria
Lithuania
Estonia
Latvian
Slovenia
Serbia
Croatia
N.
Macedonia
Bosnia
and
Montenegro
Euro.
Union
China
USA
Germany
Japan
France
Great
Britain
Percentage
current
US$
Exports of goods and services in groups of countries in 2019, current US$
Fig. 23. Merchandise exports in groups of countries in 2019, US dollars
30 Norwegian Journal of development of the International Science No 70/2021
7. Calculation of the integral development in-
dex ID of the BBS, FWPB and FUY countries
Our task is to calculate the integral index of devel-
opment ID for the considered parameters. We introduce
an integral index of the development of the countries of
the FSUB, FWPB, and FYU, based on the use of the
considered parameters.
Here is a list of our groups of parameters and pa-
rameters:
Economy
1. GDP per capita, USD, 2019.
2. GDP growth rate, USD, 2019.
3. Electricity consumption, kW-hour per capita,
2014.
Demographics
4. Current health care expenditures per capita in,
PPP dollars, 2019.
5. Total death rate, , per 1000 deaths, 2018.
6. Life expectancy at birth( LE), years, 2019.
7. Probability of survival to 65 years, men, % of
the cohort, 2019
8. Infant mortality, per 1,000 live births, 2019.
9. Maternal mortality, per 100,000 live births,
2017.
10. The difference in the number of LE women
and men, years, 2019
11. The number of suicides, per 100,000, 2017.
12. Population aged 65 years and older, % of the
total population, 2019.
Technological and high-tech development
13. Exports of high-tech products, % of industrial
exports, 2019.
14. Export of high-tech products, USD current,
2019.
15. Exports of goods to high-income countries, %
of total exports of goods, 2019.
16. Foreign direct investment in groups of coun-
tries, net inflow, % of GDP, 2019.
17. Computer and communication services, % of
exports 2019.
18. Computer and communication services, % of
imports, 2019.
19. Publication of papers in scientific and tech-
nical journals, 2018.
20. Exports of manufacturing products, % of ex-
ports of goods, 2019
Export of natural resources
21. Fuel exports, % of goods exports, 2019
22. Oil consumption, million tons, 2019, from
British Petroleum.
23. Exports of ores and metals, % of exports of
goods, 2019.
24. Exports of food, % of exports of goods 2019
25. Merchandise exports, current USD, 2019.
The method of calculating the ID is based on the
assumption that all parameters have equal importance.
The rank method is used to calculate the index. All pa-
rameters are divided into two types: 1) a larger value
corresponds to a larger value from the range of values;
2) a larger value corresponds to a smaller value. In this
setting, the ranks of all countries are calculated for each
parameter used. Then for each country, from the ob-
tained values the average ranks of all parameters are
calculated. Then the ID index is calculated by follow-
ing method: the obtained values are converted into an
ordered rank sequence, so that rank 1 belongs to the
best indicator in importance, and 27 belongs to the
worst. When implementing on a computer, the Excel
program is used, which allows to automatically take
into account the lack of data. Then all the parameters
are combined into the four groups used and the param-
eters are converted again, but for each group of param-
eters into its own rank sequence. It should be noted that
due to the different number of parameters in each
group, the sum of the ranks calculated for groups of pa-
rameters are not equal to the rank for all parameters.
The result of calculating the integral index of all the
considered variables and indices for the four studied
groups is presented in Table 2.
Norwegian Journal of development of the International Science No 70/2021 31
Table 2.
The Index of development (ID) of three groups of countres. The ranks for for each country and group are
shown. The smaller the rank, the larger its the value.
N Country
Country
Index ID
Economy Demography
Tech. and High
Tech Developing
Export of Natural
Resources
1 Estonia 1 1 5 12 23
2 Czech 2 6 2 2 21
3 Slovenia 3 3 1 7 17
4 Slovakia 4 10 6 6 20
5 Hungary 5 3 10 1 16
6 Montenegro 6 9 3 17
7 Serbia 7 7 11 5
8 Russia 8 13 25 11 3
9
Northern
Macedonia
9 18 8 9 19
10
Bosnia and
Herzegovina.
10 18 8 19 13
11 Romania 11 10 14 4 12
12 Georgia 12 15 23 23 6
13 Lithuania 13 2 13 13 11
14 Tajikistan 14 24 17 27
15 Poland 15 3 7 3 15
16 Bulgaria 16 8 12 14 3
17 Croatia 17 14 4 15 9
18 Moldova 18 18 26 21 18
19 Kazakhstan 19 10 22 16 1
20 Belarus 19 21 19 20 8
21 Latvian 21 16 17 10 14
22 Azerbaijan 22 26 16 18 22
23 Kyrgyzstan 23 27 24 22 5
24 Armenia 24 17 15 24 1
25 Ukraine 25 22 27 8
26 Uzbekistan 26 25 20 25 9
27 Turkmenistan 27 23 21 26 7
We see that five top lines of the ID table are occu-
pied by countries of FWPB - Estonia, Czech Republic,
Slovenia, Slovakia, Hungary. The sixth and seventh
places has got countries of FYU: Montenegro and Ser-
bia. The best place from countries of FSU belongs to
Russia which occupies the eighth line in the table. In
addition the six bottom lines with numbers 22-27 in the
table are occupied by the FSU countries – Kyrgyzstan,
Armenia, Ukraine, Uzbekistan, Turkmenistan. From
these facts it can be concluded that the FWPB is the
best in the unofficial competition of groups of coun-
tries.
We can get more detailed data from fig. 24. So, in
the FSU group, the section "Economy" the best place
with 52 point belongs to FWPB, last one belong to FSU
– 100 points. In section "Demography" best place is
occupied by FYU with 53 points. Best in "Hi tech" is
FWPB with 53 points. Best place in "Raw materials and
Nature Resources have won both - FSU and FWPB.
Fig. 24. Histogram of the ranks achieved by every group of countries. Each of column in four groups of sections
shows the rank of one element of groups of countries. The higher the column, the lower its rank
32 Norwegian Journal of development of the International Science No 70/2021
8. Conclusion
In conclusion, we can say that the countries of the
former USSR, the Warsaw Pact and Yugoslavia have
made significant progress in 30 years of independent
life. They have more or less overcome the defects of the
previous regime that existed before 1991. The countries
of the former USSR achieved the least small success –
both in economic development and in social life, which
was in addition understood due analize of non-standard
demographic parameters and socio-psychological dis-
order that has manifested itself to a large extent in men-
tioned three countries. At the same time, Russia has lost
a lot – now it is looks like a good team of the second
football league, we compare the success of it and other
countries of the former USSR with the success of the
former Warsaw Pact countries, which are ahead of it in
majority of respects. However, they also have difficul-
ties in development, and they all are still far from the
first league – advanced developed countries. The for-
mer countries of Yugoslavia, which have not yet fully
recovered from the recent wars, are also striving for-
ward and are in an intermediate state in terms of suc-
cess. All countries have a desire to achieve more and
are taking actions in moving forward. It is hoped that
the efforts of these countries will be successful.
The author has a pleasure to expresses gratitude to
Anna Tarko for her help in carrying out computer cal-
culations on for this article.
REFERENCES:
1. Gamburtsev A. G., Andreev E. M., Tarko
A.M., Aptikaeva O. I., Galichiy V. A., Gorbarenko E.
V., Zaslavskaya P. M., Logvinenko S. I., Artyushov A.
N., Nemtsov A.V., Sigachev A.V., Sidorenkov N. S.,
Stepanova S. I., Strelkov D. G., Chibisov S. M.,
Shcherban E. A. The influence of three environments
on medical indicators. Experience of comparative anal-
ysis. // Atlas of time variations of natural, anthropo-
genic and social processes. Volume 5. Man and the
three environments surrounding him. – M: Janus-K.
2013. pp. 326-414.
2. Baevsky R. M., Kudryavtseva V. I., Tarko A.
M., Nikulina G. A., Polyakov B. I., Semenova T. D.,
Tazetdinov I. G., Experimental study of the possibility
of predicting the reactions of the human body under
certain extreme influences and functional loads. //
Questions of cybernetics in physiological research. M.,
Publishing House of the USSR Academy of Sciences,
Issue 22, 1976, pp. 38-53.
3. Moiseev N. N. The world community and the
fate of Russia. Essays,. vol. 2, M., Publishing house of
MNEPU, 1997, 269 P.
4. Pospelov I. G. Mathematical model of eco-
nomic mechanisms of capitalist economy. // In the
book: Methods of system analysis in the problems of
rational use of resources, Moscow: Computing Center
the USSR Academy of Sciences, 1977, pp. 18-116.
5. Tarko A.M. The reverse side of growth. Mod-
ern structural economic crises and ways to overcome
them. // Free thought. 2015. No. 5 (1653), pp. 81-94.
6. Tarko A.M. About the present and future of
Russia and the world. – Tula. Publishing house
Prompilot. – 2016 – – 196 P.
7. Tarko A.M. Twenty six years of development:
What the countries of the USSR and the Warsaw Pact
have achieved. - The Age of Globalization. Studies of
modern global processes. 2018, No. 1, pp. 68-82. DOI:
10.30884/vglob/2018.01.07
8. Tarko A. M. Application of the integral index
for the analysis of the economic and social develop-
ment of Russia. // Norwegian journal of development
of the international science. Publishing House: Global
Science Center LP. ISSN: 3453-9875, No 43, Vol. 2,
2020 pp. 3-22.
9. Tikhonova N. E. Changing the socio-psycho-
logical state of Russian society. // Twenty years of re-
forms through the eyes of Russians: the experience of
many years of sociological measurements. // Edited by
M. K. Gorshkov, R. Krumma, V. V. Petukhov. – M.
The Whole world, 2011. pp. 55-76.
10. Federal State Statistics Service (ROSSTAT).
(2021). Unified Interdepartmental Information and Sta-
tistical System (EMISS) Electronic resource]
http://www.gks.ru (accessed: 20.05.2021)
11. Chumakov A. N., Stychinsky M. S. Cultural
and civilization dialogue and its possibilities in the con-
ditions of the global world. // The Age of Globalization:
No. 1, 2018 pp. 3-13.
12. Expert. - 2010. - No. 1 (Special issue).
13. Statistical Review of World Energy. (2021).
[Electronic resource] http://www.bp.com/statisticalre-
view (accessed: 20.07.2021) 1
14. World Bank Open Data. (2021). World Devel-
opment Indicators. [Electronic resource] https://data-
bank.worldbank.org/data/home.aspx (accessed:
11.08.2021)
NJD_70_2.pdf
NJD_70_2.pdf
NJD_70_2.pdf
NJD_70_2.pdf
NJD_70_2.pdf
NJD_70_2.pdf
NJD_70_2.pdf
NJD_70_2.pdf
NJD_70_2.pdf
NJD_70_2.pdf
NJD_70_2.pdf
NJD_70_2.pdf

More Related Content

Similar to NJD_70_2.pdf

Neuroprotective Roles of Oleic Acid: An Antioxidant Status and Cerebellar Cha...
Neuroprotective Roles of Oleic Acid: An Antioxidant Status and Cerebellar Cha...Neuroprotective Roles of Oleic Acid: An Antioxidant Status and Cerebellar Cha...
Neuroprotective Roles of Oleic Acid: An Antioxidant Status and Cerebellar Cha...semualkaira
 
The Importance Of Animal Uses In Animals
The Importance Of Animal Uses In AnimalsThe Importance Of Animal Uses In Animals
The Importance Of Animal Uses In AnimalsJessica Lopez
 
Histogenic Study of Human Foetal Endocrine Pancreas
Histogenic Study of Human Foetal Endocrine PancreasHistogenic Study of Human Foetal Endocrine Pancreas
Histogenic Study of Human Foetal Endocrine Pancreasiosrjce
 
Chan & Roth 2008
Chan & Roth 2008Chan & Roth 2008
Chan & Roth 2008Kin Chan
 
6.1 digestion HL Year One
6.1 digestion HL Year One6.1 digestion HL Year One
6.1 digestion HL Year OneBob Smullen
 
Assessing gastrointestinal toxicity using human tissues biopta
Assessing gastrointestinal toxicity using human tissues bioptaAssessing gastrointestinal toxicity using human tissues biopta
Assessing gastrointestinal toxicity using human tissues bioptaBiopta Inc.
 
Iris Publishers - journals of biostatistics | Biomathematical Analysis of the...
Iris Publishers - journals of biostatistics | Biomathematical Analysis of the...Iris Publishers - journals of biostatistics | Biomathematical Analysis of the...
Iris Publishers - journals of biostatistics | Biomathematical Analysis of the...IrisPublishers
 
Prophylactic role of coenzyme Q10 and Cynara scolymus L on doxorubicin-indu...
  Prophylactic role of coenzyme Q10 and Cynara scolymus L on doxorubicin-indu...  Prophylactic role of coenzyme Q10 and Cynara scolymus L on doxorubicin-indu...
Prophylactic role of coenzyme Q10 and Cynara scolymus L on doxorubicin-indu...Prof. Hesham N. Mustafa
 
Endothelial surface layer degradation by chronic
Endothelial surface layer degradation by chronicEndothelial surface layer degradation by chronic
Endothelial surface layer degradation by chronicmarconou1
 
Colitis in rats_Dig Dis Sci
Colitis in rats_Dig Dis SciColitis in rats_Dig Dis Sci
Colitis in rats_Dig Dis SciWendy McLaren
 
Age Related Histomorphological and Transmission Electron Microscopic Studies ...
Age Related Histomorphological and Transmission Electron Microscopic Studies ...Age Related Histomorphological and Transmission Electron Microscopic Studies ...
Age Related Histomorphological and Transmission Electron Microscopic Studies ...iosrjce
 
Analyzing the Human Gut Microbiome Dynamics in Health and Disease Using Super...
Analyzing the Human Gut Microbiome Dynamics in Health and Disease Using Super...Analyzing the Human Gut Microbiome Dynamics in Health and Disease Using Super...
Analyzing the Human Gut Microbiome Dynamics in Health and Disease Using Super...Larry Smarr
 
Angiogenesis, Introduction to Understand the Art.
Angiogenesis, Introduction to Understand the Art.Angiogenesis, Introduction to Understand the Art.
Angiogenesis, Introduction to Understand the Art.Khaled Elmasry
 

Similar to NJD_70_2.pdf (20)

Effect of cadmium chloride on fresh water fish heteropneustes fossilis and re...
Effect of cadmium chloride on fresh water fish heteropneustes fossilis and re...Effect of cadmium chloride on fresh water fish heteropneustes fossilis and re...
Effect of cadmium chloride on fresh water fish heteropneustes fossilis and re...
 
Neuroprotective Roles of Oleic Acid: An Antioxidant Status and Cerebellar Cha...
Neuroprotective Roles of Oleic Acid: An Antioxidant Status and Cerebellar Cha...Neuroprotective Roles of Oleic Acid: An Antioxidant Status and Cerebellar Cha...
Neuroprotective Roles of Oleic Acid: An Antioxidant Status and Cerebellar Cha...
 
Neuroprotective Roles of Oleic Acid: An Antioxidant Status and Cerebellar Cha...
Neuroprotective Roles of Oleic Acid: An Antioxidant Status and Cerebellar Cha...Neuroprotective Roles of Oleic Acid: An Antioxidant Status and Cerebellar Cha...
Neuroprotective Roles of Oleic Acid: An Antioxidant Status and Cerebellar Cha...
 
The Importance Of Animal Uses In Animals
The Importance Of Animal Uses In AnimalsThe Importance Of Animal Uses In Animals
The Importance Of Animal Uses In Animals
 
Histogenic Study of Human Foetal Endocrine Pancreas
Histogenic Study of Human Foetal Endocrine PancreasHistogenic Study of Human Foetal Endocrine Pancreas
Histogenic Study of Human Foetal Endocrine Pancreas
 
Mesexclor
MesexclorMesexclor
Mesexclor
 
Chan & Roth 2008
Chan & Roth 2008Chan & Roth 2008
Chan & Roth 2008
 
6.1 digestion HL Year One
6.1 digestion HL Year One6.1 digestion HL Year One
6.1 digestion HL Year One
 
Assessing gastrointestinal toxicity using human tissues biopta
Assessing gastrointestinal toxicity using human tissues bioptaAssessing gastrointestinal toxicity using human tissues biopta
Assessing gastrointestinal toxicity using human tissues biopta
 
Iris Publishers - journals of biostatistics | Biomathematical Analysis of the...
Iris Publishers - journals of biostatistics | Biomathematical Analysis of the...Iris Publishers - journals of biostatistics | Biomathematical Analysis of the...
Iris Publishers - journals of biostatistics | Biomathematical Analysis of the...
 
International Journal of Hepatology & Gastroenterology
International Journal of Hepatology & GastroenterologyInternational Journal of Hepatology & Gastroenterology
International Journal of Hepatology & Gastroenterology
 
Prophylactic role of coenzyme Q10 and Cynara scolymus L on doxorubicin-indu...
  Prophylactic role of coenzyme Q10 and Cynara scolymus L on doxorubicin-indu...  Prophylactic role of coenzyme Q10 and Cynara scolymus L on doxorubicin-indu...
Prophylactic role of coenzyme Q10 and Cynara scolymus L on doxorubicin-indu...
 
Endothelial surface layer degradation by chronic
Endothelial surface layer degradation by chronicEndothelial surface layer degradation by chronic
Endothelial surface layer degradation by chronic
 
Colitis in rats_Dig Dis Sci
Colitis in rats_Dig Dis SciColitis in rats_Dig Dis Sci
Colitis in rats_Dig Dis Sci
 
Age Related Histomorphological and Transmission Electron Microscopic Studies ...
Age Related Histomorphological and Transmission Electron Microscopic Studies ...Age Related Histomorphological and Transmission Electron Microscopic Studies ...
Age Related Histomorphological and Transmission Electron Microscopic Studies ...
 
Analyzing the Human Gut Microbiome Dynamics in Health and Disease Using Super...
Analyzing the Human Gut Microbiome Dynamics in Health and Disease Using Super...Analyzing the Human Gut Microbiome Dynamics in Health and Disease Using Super...
Analyzing the Human Gut Microbiome Dynamics in Health and Disease Using Super...
 
Analyzing the Human Gut Microbiome Dynamics in Health and Disease Using Super...
Analyzing the Human Gut Microbiome Dynamics in Health and Disease Using Super...Analyzing the Human Gut Microbiome Dynamics in Health and Disease Using Super...
Analyzing the Human Gut Microbiome Dynamics in Health and Disease Using Super...
 
2010Ketorolac
2010Ketorolac2010Ketorolac
2010Ketorolac
 
Angiogenesis, Introduction to Understand the Art.
Angiogenesis, Introduction to Understand the Art.Angiogenesis, Introduction to Understand the Art.
Angiogenesis, Introduction to Understand the Art.
 

More from Norwegian Journal of development of the International Science

More from Norwegian Journal of development of the International Science (20)

NJD_98.pdf
NJD_98.pdfNJD_98.pdf
NJD_98.pdf
 
NJD_84.pdf
NJD_84.pdfNJD_84.pdf
NJD_84.pdf
 
NJD_82.pdf
NJD_82.pdfNJD_82.pdf
NJD_82.pdf
 
NJD_94.pdf
NJD_94.pdfNJD_94.pdf
NJD_94.pdf
 
NJD_96.pdf
NJD_96.pdfNJD_96.pdf
NJD_96.pdf
 
NJD_92.pdf
NJD_92.pdfNJD_92.pdf
NJD_92.pdf
 
NJD_87.pdf
NJD_87.pdfNJD_87.pdf
NJD_87.pdf
 
NJD_76_2.pdf
NJD_76_2.pdfNJD_76_2.pdf
NJD_76_2.pdf
 
NJD_73_1.pdf
NJD_73_1.pdfNJD_73_1.pdf
NJD_73_1.pdf
 
NJD_80.pdf
NJD_80.pdfNJD_80.pdf
NJD_80.pdf
 
NJD_83.pdf
NJD_83.pdfNJD_83.pdf
NJD_83.pdf
 
NJD_78_1.pdf
NJD_78_1.pdfNJD_78_1.pdf
NJD_78_1.pdf
 
NJD_86.pdf
NJD_86.pdfNJD_86.pdf
NJD_86.pdf
 
NJD_76_1.pdf
NJD_76_1.pdfNJD_76_1.pdf
NJD_76_1.pdf
 
NJD_81.pdf
NJD_81.pdfNJD_81.pdf
NJD_81.pdf
 
NJD_85.pdf
NJD_85.pdfNJD_85.pdf
NJD_85.pdf
 
NJD_79_1.pdf
NJD_79_1.pdfNJD_79_1.pdf
NJD_79_1.pdf
 
NJD_73_2.pdf
NJD_73_2.pdfNJD_73_2.pdf
NJD_73_2.pdf
 
NJD_75_2.pdf
NJD_75_2.pdfNJD_75_2.pdf
NJD_75_2.pdf
 
NJD_77_3.pdf
NJD_77_3.pdfNJD_77_3.pdf
NJD_77_3.pdf
 

Recently uploaded

The basics of sentences session 2pptx copy.pptx
The basics of sentences session 2pptx copy.pptxThe basics of sentences session 2pptx copy.pptx
The basics of sentences session 2pptx copy.pptxheathfieldcps1
 
Class 11 Legal Studies Ch-1 Concept of State .pdf
Class 11 Legal Studies Ch-1 Concept of State .pdfClass 11 Legal Studies Ch-1 Concept of State .pdf
Class 11 Legal Studies Ch-1 Concept of State .pdfakmcokerachita
 
Kisan Call Centre - To harness potential of ICT in Agriculture by answer farm...
Kisan Call Centre - To harness potential of ICT in Agriculture by answer farm...Kisan Call Centre - To harness potential of ICT in Agriculture by answer farm...
Kisan Call Centre - To harness potential of ICT in Agriculture by answer farm...Krashi Coaching
 
Accessible design: Minimum effort, maximum impact
Accessible design: Minimum effort, maximum impactAccessible design: Minimum effort, maximum impact
Accessible design: Minimum effort, maximum impactdawncurless
 
Crayon Activity Handout For the Crayon A
Crayon Activity Handout For the Crayon ACrayon Activity Handout For the Crayon A
Crayon Activity Handout For the Crayon AUnboundStockton
 
A Critique of the Proposed National Education Policy Reform
A Critique of the Proposed National Education Policy ReformA Critique of the Proposed National Education Policy Reform
A Critique of the Proposed National Education Policy ReformChameera Dedduwage
 
Introduction to AI in Higher Education_draft.pptx
Introduction to AI in Higher Education_draft.pptxIntroduction to AI in Higher Education_draft.pptx
Introduction to AI in Higher Education_draft.pptxpboyjonauth
 
MENTAL STATUS EXAMINATION format.docx
MENTAL     STATUS EXAMINATION format.docxMENTAL     STATUS EXAMINATION format.docx
MENTAL STATUS EXAMINATION format.docxPoojaSen20
 
Alper Gobel In Media Res Media Component
Alper Gobel In Media Res Media ComponentAlper Gobel In Media Res Media Component
Alper Gobel In Media Res Media ComponentInMediaRes1
 
Enzyme, Pharmaceutical Aids, Miscellaneous Last Part of Chapter no 5th.pdf
Enzyme, Pharmaceutical Aids, Miscellaneous Last Part of Chapter no 5th.pdfEnzyme, Pharmaceutical Aids, Miscellaneous Last Part of Chapter no 5th.pdf
Enzyme, Pharmaceutical Aids, Miscellaneous Last Part of Chapter no 5th.pdfSumit Tiwari
 
_Math 4-Q4 Week 5.pptx Steps in Collecting Data
_Math 4-Q4 Week 5.pptx Steps in Collecting Data_Math 4-Q4 Week 5.pptx Steps in Collecting Data
_Math 4-Q4 Week 5.pptx Steps in Collecting DataJhengPantaleon
 
mini mental status format.docx
mini    mental       status     format.docxmini    mental       status     format.docx
mini mental status format.docxPoojaSen20
 
microwave assisted reaction. General introduction
microwave assisted reaction. General introductionmicrowave assisted reaction. General introduction
microwave assisted reaction. General introductionMaksud Ahmed
 
Concept of Vouching. B.Com(Hons) /B.Compdf
Concept of Vouching. B.Com(Hons) /B.CompdfConcept of Vouching. B.Com(Hons) /B.Compdf
Concept of Vouching. B.Com(Hons) /B.CompdfUmakantAnnand
 
POINT- BIOCHEMISTRY SEM 2 ENZYMES UNIT 5.pptx
POINT- BIOCHEMISTRY SEM 2 ENZYMES UNIT 5.pptxPOINT- BIOCHEMISTRY SEM 2 ENZYMES UNIT 5.pptx
POINT- BIOCHEMISTRY SEM 2 ENZYMES UNIT 5.pptxSayali Powar
 
Science 7 - LAND and SEA BREEZE and its Characteristics
Science 7 - LAND and SEA BREEZE and its CharacteristicsScience 7 - LAND and SEA BREEZE and its Characteristics
Science 7 - LAND and SEA BREEZE and its CharacteristicsKarinaGenton
 
Introduction to ArtificiaI Intelligence in Higher Education
Introduction to ArtificiaI Intelligence in Higher EducationIntroduction to ArtificiaI Intelligence in Higher Education
Introduction to ArtificiaI Intelligence in Higher Educationpboyjonauth
 
call girls in Kamla Market (DELHI) 🔝 >༒9953330565🔝 genuine Escort Service 🔝✔️✔️
call girls in Kamla Market (DELHI) 🔝 >༒9953330565🔝 genuine Escort Service 🔝✔️✔️call girls in Kamla Market (DELHI) 🔝 >༒9953330565🔝 genuine Escort Service 🔝✔️✔️
call girls in Kamla Market (DELHI) 🔝 >༒9953330565🔝 genuine Escort Service 🔝✔️✔️9953056974 Low Rate Call Girls In Saket, Delhi NCR
 

Recently uploaded (20)

The basics of sentences session 2pptx copy.pptx
The basics of sentences session 2pptx copy.pptxThe basics of sentences session 2pptx copy.pptx
The basics of sentences session 2pptx copy.pptx
 
Class 11 Legal Studies Ch-1 Concept of State .pdf
Class 11 Legal Studies Ch-1 Concept of State .pdfClass 11 Legal Studies Ch-1 Concept of State .pdf
Class 11 Legal Studies Ch-1 Concept of State .pdf
 
Kisan Call Centre - To harness potential of ICT in Agriculture by answer farm...
Kisan Call Centre - To harness potential of ICT in Agriculture by answer farm...Kisan Call Centre - To harness potential of ICT in Agriculture by answer farm...
Kisan Call Centre - To harness potential of ICT in Agriculture by answer farm...
 
Staff of Color (SOC) Retention Efforts DDSD
Staff of Color (SOC) Retention Efforts DDSDStaff of Color (SOC) Retention Efforts DDSD
Staff of Color (SOC) Retention Efforts DDSD
 
Accessible design: Minimum effort, maximum impact
Accessible design: Minimum effort, maximum impactAccessible design: Minimum effort, maximum impact
Accessible design: Minimum effort, maximum impact
 
Crayon Activity Handout For the Crayon A
Crayon Activity Handout For the Crayon ACrayon Activity Handout For the Crayon A
Crayon Activity Handout For the Crayon A
 
A Critique of the Proposed National Education Policy Reform
A Critique of the Proposed National Education Policy ReformA Critique of the Proposed National Education Policy Reform
A Critique of the Proposed National Education Policy Reform
 
Introduction to AI in Higher Education_draft.pptx
Introduction to AI in Higher Education_draft.pptxIntroduction to AI in Higher Education_draft.pptx
Introduction to AI in Higher Education_draft.pptx
 
Model Call Girl in Bikash Puri Delhi reach out to us at 🔝9953056974🔝
Model Call Girl in Bikash Puri  Delhi reach out to us at 🔝9953056974🔝Model Call Girl in Bikash Puri  Delhi reach out to us at 🔝9953056974🔝
Model Call Girl in Bikash Puri Delhi reach out to us at 🔝9953056974🔝
 
MENTAL STATUS EXAMINATION format.docx
MENTAL     STATUS EXAMINATION format.docxMENTAL     STATUS EXAMINATION format.docx
MENTAL STATUS EXAMINATION format.docx
 
Alper Gobel In Media Res Media Component
Alper Gobel In Media Res Media ComponentAlper Gobel In Media Res Media Component
Alper Gobel In Media Res Media Component
 
Enzyme, Pharmaceutical Aids, Miscellaneous Last Part of Chapter no 5th.pdf
Enzyme, Pharmaceutical Aids, Miscellaneous Last Part of Chapter no 5th.pdfEnzyme, Pharmaceutical Aids, Miscellaneous Last Part of Chapter no 5th.pdf
Enzyme, Pharmaceutical Aids, Miscellaneous Last Part of Chapter no 5th.pdf
 
_Math 4-Q4 Week 5.pptx Steps in Collecting Data
_Math 4-Q4 Week 5.pptx Steps in Collecting Data_Math 4-Q4 Week 5.pptx Steps in Collecting Data
_Math 4-Q4 Week 5.pptx Steps in Collecting Data
 
mini mental status format.docx
mini    mental       status     format.docxmini    mental       status     format.docx
mini mental status format.docx
 
microwave assisted reaction. General introduction
microwave assisted reaction. General introductionmicrowave assisted reaction. General introduction
microwave assisted reaction. General introduction
 
Concept of Vouching. B.Com(Hons) /B.Compdf
Concept of Vouching. B.Com(Hons) /B.CompdfConcept of Vouching. B.Com(Hons) /B.Compdf
Concept of Vouching. B.Com(Hons) /B.Compdf
 
POINT- BIOCHEMISTRY SEM 2 ENZYMES UNIT 5.pptx
POINT- BIOCHEMISTRY SEM 2 ENZYMES UNIT 5.pptxPOINT- BIOCHEMISTRY SEM 2 ENZYMES UNIT 5.pptx
POINT- BIOCHEMISTRY SEM 2 ENZYMES UNIT 5.pptx
 
Science 7 - LAND and SEA BREEZE and its Characteristics
Science 7 - LAND and SEA BREEZE and its CharacteristicsScience 7 - LAND and SEA BREEZE and its Characteristics
Science 7 - LAND and SEA BREEZE and its Characteristics
 
Introduction to ArtificiaI Intelligence in Higher Education
Introduction to ArtificiaI Intelligence in Higher EducationIntroduction to ArtificiaI Intelligence in Higher Education
Introduction to ArtificiaI Intelligence in Higher Education
 
call girls in Kamla Market (DELHI) 🔝 >༒9953330565🔝 genuine Escort Service 🔝✔️✔️
call girls in Kamla Market (DELHI) 🔝 >༒9953330565🔝 genuine Escort Service 🔝✔️✔️call girls in Kamla Market (DELHI) 🔝 >༒9953330565🔝 genuine Escort Service 🔝✔️✔️
call girls in Kamla Market (DELHI) 🔝 >༒9953330565🔝 genuine Escort Service 🔝✔️✔️
 

NJD_70_2.pdf

  • 1. №70/2021 Norwegian Journal of development of the International Science ISSN 3453-9875 VOL.2 It was established in November 2016 with support from the Norwegian Academy of Science. DESCRIPTION The Scientific journal “Norwegian Journal of development of the International Science” is issued 24 times a year and is a scientific publication on topical problems of science. Editor in chief – Karin Kristiansen (University of Oslo, Norway) The assistant of theeditor in chief – Olof Hansen • James Smith (University of Birmingham, UK) • Kristian Nilsen (University Centre in Svalbard, Norway) • Arne Jensen (Norwegian University of Science and Technology, Norway) • Sander Svein (University of Tromsø, Norway) • Lena Meyer (University of Gothenburg, Sweden) • Hans Rasmussen (University of Southern Denmark, Denmark) • Chantal Girard (ESC Rennes School of Business, France) • Ann Claes (University of Groningen, Netherlands) • Ingrid Karlsen (University of Oslo, Norway) • Terje Gruterson (Norwegian Institute of Public Health, Norway) • Sander Langfjord (University Hospital, Norway) • Fredrik Mardosas (Oslo and Akershus University College, Norway) • Emil Berger (Ministry of Agriculture and Food, Norway) • Sofie Olsen (BioFokus, Norway) • Rolf Ulrich Becker (University of Duisburg-Essen, Germany) • Lutz Jäncke (University of Zürich, Switzerland) • Elizabeth Davies (University of Glasgow, UK) • Chan Jiang(Peking University, China) and other independent experts 1000 copies Norwegian Journal of development of the International Science Iduns gate 4A, 0178, Oslo, Norway email: publish@njd-iscience.com site: http://www.njd-iscience.com
  • 2. CONTENT BIOLOGICAL SCIENCES Novikova A., Ivanov E., Kurguzova N., Akzhigitov R., Bozhkov A. COLOSTRUM COMPONENTS INVOLVED IN REGULATING THE NUMBER OF IMMUNOCOMPETENT CELLS IN ANIMALS WITH LIVER FIBROSIS....................3 ECONOMIC SCIENCES Tarko A. RESULTS OF THE DEVELOPMENT OF THE COUNTRIES THAT CAME OUT OF 1991.........................................12 HISTORICAL SCIENCES Shutova M. "HONEST MIRROR OF YOUTH" AS THE MAIN SOURCE OF EDUCATION OF THE YOUNGER GENERATION OF PETER'S RUSSIA .........................................................33 PHILOLOGICAL SCIENCES Amanov A. MEANS OF CONNECTING THE COMPONENTS OF THE TEXT IN UZBEK LITERARY LANGUAGE .......................36 SOCIAL SCIENCES Synchak B., Koval A. RECOMMENDATIONS FOR BRIDGING THE GAP BETWEEN THEORY AND PRACTICE IN JOURNALISM.39
  • 3. Norwegian Journal of development of the International Science No 70/2021 3 BIOLOGICAL SCIENCES COLOSTRUM COMPONENTS INVOLVED IN REGULATING THE NUMBER OF IMMUNOCOMPETENT CELLS IN ANIMALS WITH LIVER FIBROSIS Novikova A., postgraduate student of the Department of Molecular Biology and Biotechnology V.N. Karazin Kharkov National University, Kharkov Ivanov E., PhD, Associate Professor of the Department of Molecular Biology and Biotechnology V.N. Karazin Khar- kov National University, Kharkov Kurguzova N., Senior Lecturer of the Department of Molecular Biology and Biotechnology V.N. Karazin Kharkov National University, Kharkov Akzhigitov R., postgraduate student of the Department of Molecular Biology and Biotechnology V.N. Karazin Kharkov National University, Kharkov Bozhkov A. Doctor of Biological Sciences, Professor of the Department of Molecular Biology and Biotechnology V.N. Karazin Kharkov National University, Kharkov DOI: 10.24412/3453-9875-2021-70-2-3-11 Abstract Two different fractions were prepared from whole colostrum: defatted colostrum (DC) and low molecular weight components of colostrum (LMC), and their effect on the growth dynamics of Wistar rats, in which liver fibrosis was induced, and the content of erythrocytes, platelets, and immunocompetent cells (leukocytes, lympho- cytes, granulocytes, monocytes). To induce liver fibrosis, rats were injected three times with copper sulfate at a dose of 1 mg /100 g of body weight with an interval of 48 hours between injections. 24 hours after the last admin- istration of copper, the development of the initial stage of fibrosis was observed according to histology data, and this was accompanied by an inhibition of the rate of growth in the body weight of the animals. Hematological parameters were determined on an automatic analyzer Mindray BC - 2008 Vet, (USA). It was found that in animals with fibrosis the number of platelets was increased by 2 times in comparison with the control, other types of cells, in particular immunocompetent cells, remained within the normal range. If animals with Cu-induced fibrosis were injected with OM and NCM at a dose of 0.1 mg /100 g of body weight daily for 6 days, then there was a significant increase in the number of immunocompetent cells in the bloodstream (leukocytes by 80% with OM and 59 % for NCM; lymphocytes by 68% and 30%, respectively; monocytes by 82% for OM and 160% for NCM; granulocytes by 218% and 223%, respectively), with a decrease in the number of platelets compared to animals with fibrosis. It has been suggested that the components of colostrum have a stimulating effect on the functional activity of bone marrow cells, which can contribute to the elimination of liver fibrosis. DC and LMC had different effects on the content of different types of bone marrow cells. Keywords: defatted colostrum, low molecular weight components of colostrum, immunocompetent cells, Cu-induced liver fibrosis. Introduction. It is known that liver fibrosis, the process of re- placing liver cells with connective tissue, is a universal response of the body to damage. [1] Damage in liver tissue can be caused by a variety of factors: toxic chem- icals in water, food or air, microorganisms, or physical factors. [2, 3] Fibrosis of the liver is dangerous because it can lead to the development of cirrhosis, which is an irreversible chronic severe condition. [4] At the same time, in the early stages of develop- ment, fibrosis can be eliminated and the impaired liver function restored. Currently, there is an active search for natural compounds that can normalize liver function in fibrosis. [5] Earlier it was shown that repeated sequential ad- ministration of copper sulfate in a dose of 1 mg /100 g of body weight to experimental animals was accompa- nied by the induction of liver fibrosis. [6, 7] It is known that colostrum is a natural component, which includes a large number of biologically active compounds, such as immunoglobulins IgA, IgG, IgD, IgE, IgM, cytokines and related interferon, various growth factors - insulin-like factors, platelet, epithelial factors and including the transfer factor. [8, 9, 10] Transfer factor has a wide spectrum of action on bio- logical systems and can normalize liver dysfunction against the background of fibrosis. [11] Isolation of the transfer factor is associated with a fine purification sys- tem, which requires expensive equipment on the one hand, and on the other hand, with such a purification system, a number of other biologically active com- pounds can be removed. It is of interest to separate co- lostrum into a number of components, in particular, the removal of lipid components and the removal of high molecular weight proteins, to obtain low molecular weight components of colostrum, which also include a transfer factor. With this approach, relatively simple
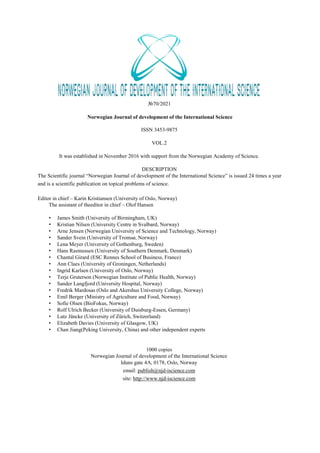
  • 4. 4 Norwegian Journal of development of the International Science No 70/2021 fractionation methods can be used while maintaining the biologically active properties of the materials. In this regard, in our work, we investigated the ef- fect of whole skim colostrum and low molecular weight components of colostrum (which also includes a trans- fer factor) on the growth dynamics and hematological parameters of animals with Cu-induced liver fibrosis. Materials and methods. The experiments were carried out on three-month- old male Wistar rats. The animals were kept under standard vivarium conditions. To simulate fibrotic changes in the liver of rats, a solution of copper sulfate was used, which was administered to rats intraperitone- ally three times with an interval of 48 hours between injections at a concentration of 1 mg Cu /100 g of body weight, as described earlier. [6, 7, 12] For fractionation, colostrum was obtained from the Alpha farm (Ukraine), from Ukrainian dairy cows - pockmarked, the second milk yield after calving. Fat was removed by centrifugation of whole colostrum at 3000 g for 20 min at room temperature. After removing the fats, the resulting colostrum was used as defatted colostrum (DC). When obtaining low molecular weight components (LMC), colostrum was passed through membrane filters with a pore diameter of 10 nm, which made it possible to remove proteins with a high molec- ular weight of more than 10 kd (Fig. 1) Fig.1. A. Protein composition of skim colostrum as determined by mass spectrometry. B. Composition of proteins included in the fraction of low molecular weight components of colostrum. Intensity, conventional units Intensity, conventional units А В
  • 5. Norwegian Journal of development of the International Science No 70/2021 5 The obtained fractions of DC and LMC were dried in a rotary evaporator and stored dry samples at a tem- perature of minus 15 ºС without access to air. To study the effect of DC and LMC, animals with induced liver fibrosis with copper sulfate (Cu - ind.fi- brosis) were injected per os with aqueous solutions of DC and LMC at a dose of 0.1mg/100 g of body weight 6 times every 24 hours (Fig. 3). When working with animals, all recommendations for bioethical standards were observed. Fig.2. Scheme showing experimental groups of animals, which were sequentially injected with copper sulfate at a dose of 1 mg/100 g for the induction of fibrosis, followed by the administration of DC and LMC. The control variant was not subjected to any additional influences. The body weight of the animals was determined daily, and after decapitation of the animals, which was carried out under ether anesthesia, blood was collected in tubes with K3 EDTA (3-substituted potassium salt of ethylenediaminetetraacetic acid) for further studies of hematological parameters on an automatic analyzer Mindray BC - 2008 Vet, (USA). The absolute content of leukocytes, lymphocytes, monocytes, granulocytes, erythrocytes, platelets, hemoglobin content, hemato- crit, average volume of erythrocytes, erythrocyte aniso- cytosis, average concentration of hemoglobin in one erythrocyte, relative width of platelet distribution, av- erage platelet volume and platelet volume were deter- mined. Each experimental group consisted of 6 rats. The results obtained were subjected to statistical analysis using the Exel program. Data in the work are presented as mean (x) and standard error (SE). Research results. Influence of exogenous copper ions on the mor- phology and growth dynamics of rats. Three-time se- quential administration of copper sulfate to experi- mental animals at a dose of 1 mg / 100 g of body weight was accompanied by morphological changes in the liver tissue, which is characteristic of toxic liver dam- age, in particular: acute coagulation necrosis of hepato- cytes in the perilobilar zones, apoptosis of some hepatocytes, dystrophic changes in hepatocytes (pro- tein fatty degeneration). Intoxication with copper ions led to venous hyperemia, the presence of erythrocyte accumulations (aggregates) (Fig. 3 Aa, Ab). Previously, it was shown that the intoxication of animals with copper sulfate was accompanied by a 30% increase in collagen content and the growth of connec- tive tissue in the liver. [13] Dysfunction of the liver was accompanied by a loss or delay in the growth of the body weight of the animals. So, if the body weight of the control group of animals increased almost linearly from 1 to 13 days of observation and at the end of the experiment it in- creased by 25 - 30% of the initial (Fig. 3B, curve 1), then in animals with Cu - induced liver fibrosis by at the end of the experiment, it remained at the level of the initial values (Fig. 3B, curve 2). In the event that animals with Cu-induced liver fi- brosis received DC per os at a dose of 0.1 mg / 100 g of body weight, then after growth retardation, from day 5 to 13, they slowly, but gained body weight, and by the end of observations, it increased by 10 - 15% of the initial one (Fig. 3 B, curve 3). If animals with Cu-in- duced liver fibrosis received LMC, then they increased their body weight with a higher rate, although they lagged behind the control group (Fig. 3B, curve 4).
  • 6. 6 Norwegian Journal of development of the International Science No 70/2021 Fig. 3. A. Micrographs of histological liver samples from control animals (a) and animals that were injected three times with copper sulfate at a dose of 1 mg / 100 g of body weight with an interval of 48 hours between injections (b). Magnification x 400 s. B. The dynamics of the body weight of control animals (1), animals with Cu - induced liver fibrosis (2), as well as animals with Cu - induced liver fibrosis, who received defatted colostrum at a dose of 0.1 mg / 100 g of body weight (3) and the group animals with fibrosis who received low molecular weight components of colostrum daily at a dose of 0.1 mg / 100 g of body weight for 6 days with an interval of 24 hours (4). Mean values from 6 animals in each experimental group are shown. * - differences were noted between the experimental groups in comparison with the control group for which p <0.05. Consequently, colostrum intake partially restores body weight growth in experimental animals with Cu- induced liver fibrosis. LMC shows a greater effect in restoring this indicator as compared to DC. However, the full recovery of the growth rate of animals with liver fibrosis did not occur. The results obtained convincingly confirm the fact that the inflammatory process in the liver, induced by intoxication with copper ions, is characterized by sys- temic changes at the level of the whole organism. In particular, a change in the functional activity of the di- gestive system, a shift in the balance of the redox sys- tem towards prooxidants [14, 15]. Despite numerous studies of the mechanisms of the development of in- flammatory reactions, the questions of the integrative mechanisms of the response to the action of pathoge- netic factors remain unresolved. In this case, the excess of copper ions, we believe that the bone marrow, pro- ducing blood cells and immunocompetent cells, is a systemic factor in the formation of inflammatory re- sponses. Hematological parameters in rats with Cu - in- duced liver fibrosis and after administration of colos- trum components. The content of erythrocytes in exper- imental animals with Cu - ind. liver fibrosis did not dif- fer from intact control. The content of hemoglobin, the average concentration of hemoglobin in the erythro- cyte, hematocrit, and the average volume of the eryth- rocyte and anisocytosis of erythrocytes in animals with Cu - ind. liver fibrosis also remained at the control level (table). Table Erythrocyte count, average erythrocyte volume, hemoglobin content, hematocrit and erythrocyte anisocy- tosis in the intact control group, animals with Cu-induced fibrosis, and animals with Cu-induced fibrosis, who received DC and LMC per os at a dose of 0.1 mg / 100 g body weight. Mean values from three experi- ments and standard errors of the mean are presented. Groups of experi- mental animals INDICATORS The number of erythrocytes, х109 l Average volume of erythrocytes, fl Hematocrit, % Hemoglobin content, g/l Erythrocyte an- isocytosis, % Intact control 8,52 ±0,37 55,00 ±3,09 46,60 ±0,70 146,00 ±3,79 14,73 ±1,88 Cu – ind. fibrosis 7,6 ±0,24 53,40 ±0,95 41,70 ±0,76 132,00 ±3,45 13,80 ±0,90 Cu – ind. fibrosis and DC injection 7,93 ±0,05 54,20 ±0,69 42,90 ±0,72 134,33 ±1,45 14,17 ±0,58 Cu – ind. fibrosis and the introduction of LMC 7,81 ±0,23 56,05 ±0,90 43,70 ±1,40 138,50 ±3,55 15,08 ±0,78 85 95 105 115 125 135 145 1 3 5 6 7 8 9 10 11 12 13 relative body weight,% days of experiment introduction of copper sulfate introduction of colostrumand LMC * * * * * * * * * * * * * * * * * 1 2 3 4 A B
  • 7. Norwegian Journal of development of the International Science No 70/2021 7 Administration to animals with Cu - ind. liver fi- brosis DC and LMC in doses of 0.1 mg / 100 g of body weight did not affect the parameters of hematopoiesis (table). Consequently, at the initial stages of the develop- ment of Cu-induced fibrosis, hematopoiesis remained within the normal range. Skim colostrum and low mo- lecular weight components of colostrum also had no ef- fect on hematopoiesis, at least when it corresponded to the control level. The number of leukocytes in animals with Cu - ind. liver fibrosis remained within the control values (Fig. 4A). However, in animals with liver fibrosis, which received DC at a dose of 1 mg / 100 g of body weight for 6 days, the leukocyte content was increased by 80% compared with control (Fig. 4A). In the event that animals with liver fibrosis received LMC, then their leukocyte content was also increased by 59% in relation to the control (Fig. 4A). The manifestation of leukocytosis after the administration of colostrum com- ponents to experimental animals can be a positive effect against the background of intoxication, since this is ac- companied by the activation of the cellular link of im- munity. Since leukocytes produce interferon and growth factors [16], this can positively affect the restoration of liver function against the background of fibrosis. The content of lymphocytes in animals with Cu - ind. liver fibrosis was reduced compared to controls by 25% (Fig. 4B). If animals with fibrosis were injected with DC and LMC, then the lymphocyte content was increased in comparison with the control by 68 and 30%, respectively (Fig. 4B). Consequently, DC caused a more pronounced ef- fect of stimulating the number of leukocytes and lym- phocytes compared to LMC. The class of phagocytic mononuclear cells - mon- ocytes in animals with Cu - ind. liver fibrosis did not differ from the control values (0.33 ± 0.09 and 0.4 ± 0.06). At the same time, administration of DC and LMC to animals with hepatic fibrosis was accompanied by a significant increase in this class of cells by 82 and 160%, respectively, compared with intact controls (Fig. C). Consequently, LMC was 2 times more effective in increasing the number of monocytes compared to DC. Such a significant increase in phagocytic cells, which are able to remove destroyed cells, denatured proteins and circulating immune complexes from the body, is the most important stage in eliminating pathological processes in the liver. When assessing the level of nonspecific reactivity of an organism, the index of the ratio of the number of lymphocytes to monocytes is often used. In intact con- trol animals, it was 19.6 arbitrary units, in animals with liver fibrosis, it was significantly reduced to 12.0, after administration of DC to animals with fibrosis, it did not differ from the control level (18.1). However, after ad- ministration to animals with fibrosis of LMC, it was al- most 2 times lower than the control and amounted to 9.7 arbitrary units. Consequently, the administration of DC to ani- mals after intoxication with copper sulfate is more pref- erable compared to LMC, at least for the regulation of the cellular link of immunity. A relatively leukocytes large proportion is occu- pied by granulocytic cells, which include basophils, neutrophils and eosinophils. The total number of gran- ulocytes in the control group was 2.0 * 109 cells / l. It did not change in animals with Cu - ind. liver fibrosis (2.4 * 109 cells / l) (Fig.4D). However, after the admin- istration of DC and LMC to experimental animals, their number increased 2.2 times compared to the control level (Fig. 4D).
  • 8. 8 Norwegian Journal of development of the International Science No 70/2021 Fig.4. A. The absolute content of leukocytes in the intact control group (1), the group of animals with Cu - induced liver fibrosis (2), in the group with Cu - ind. fibrosis, followed by 6-fold administration of DC at a dose of 1 mg / 100 g of body weight (3) and in the group with fibrosis, followed by 6-fold injection of LMC at a dose of 0.1 mg / 100 g of body weight (4); B. Absolute lymphocyte count in the same groups of animals; C. Absolute content of monocytes in the same groups of animals; D. Absolute content of granulocyte in the same groups of animals. It is known that granulocyte inducers are interleu- kins: 1,3,5, granulocyte-stimulating factor, granulo- cyte-monocyte factor, which are present in colostrum. Consequently, the administration of colostrum components to animals with liver fibrosis stimulates the formation of immunocompetent cells that can ensure the restoration of the pathologically altered liver. As it was revealed on histological preparations of the liver with the development of fibrosis, there was a change in the state of the vessels. In this regard, it is of great interest to assess the number and characteristics of platelets, as an indicator of blood coagulation. It was found that in animals with Cu - ind. with liver fibrosis, the number of platelets was increased 2- fold compared to the control (Fig. 5A), that is, throm- bocytosis took place. The causes of thrombocytosis are very diverse, but they are based on an increase in cyto- kines that stimulate platelet formation. Thrombocytosis is known to increase the likeli- hood of blood clots. If animals with fibrosis received DC for 6 days, then the platelet count remained 50% higher than the intact control, but was 26% less than with fibrosis (Fig.5A). LMC had a less pronounced ef- fect of reducing the number of platelets in animals with fibrosis compared with DC (only by 15%) (Fig. 5A). 0 5 10 15 20 25 1 2 3 4 The absolute content of leukocytes, х10 9 /l * * A 0 2 4 6 8 10 12 14 1 2 3 4 Absolute lymphocyte count, х10 9 /l * B 0 0,2 0,4 0,6 0,8 1 1,2 1 2 3 4 Absolute content of monocytes, х10 9 /l * C 0 1 2 3 4 5 6 1 2 3 4 Absolute content of granulocyte, х10 9 /l * * D
  • 9. Norwegian Journal of development of the International Science No 70/2021 9 Fig. 5. A. The number of platelets in the intact control group (1), the group of animals with Cu - induced liver fibrosis (2), in the group with Cu - ind. fibrosis, followed by 6-fold administration of DC at a dose of 1 mg / 100 g of body weight (3) and in the group with fibrosis, followed by 6-fold injection of LMC at a dose of 0.1 mg / 100 g of body weight (4); B. Thrombokrit in the same groups of animals; C. the average volume of platelets in the same groups of animals. Mean values and standard errors are given. * - differences were noted between the control and experimental groups, for which p <0.05. Consequently, the intake of DC provided a de- crease in thrombocytosis, which took place in Cu - ind. liver fibrosis. In favor of the different effect of DC and LMC on platelet formation, data on thrombocrit indica- tors testify. So, thrombocritis in rats with Cu - ind. liver fibrosis was increased in comparison with the control level by 88%; after the animals with fibrosis received DC, this indicator decreased by 21%, although it re- mained somewhat higher compared to the control, whereas in the case of receiving LMC by animals, it did not change (Fig. 5B). The change in thrombocyte was due to an increase in the number of platelets, while maintaining their vol- ume (Fig. 5C). Discussion It was previously thought that the induction of fi- brogenesis leads to irreversible chronic conditions [17]. Intensive studies in recent years have shown that liver fibrosis can be reversible, however, the features and mechanisms of this process have not been finally estab- lished. Understanding the process of loss of the liver's ability to regenerate and remove the formed connective tissue elements in response to tissue damage is a funda- mental problem in biomedical research. It is quite ob- vious that its solution will allow developing methods of treating chronic pathologies and understanding the basic mechanisms of age-related pathologies that have a direct connection with them. We believe that the problem of "reversible ↔ irre- versible" metabolic states depends primarily on the stages of the process development. This can be ex- plained by the fact that at the late (terminal) stages of a metabolic process, metabolic and / or epigenetic memory is formed, which has an adaptive character and, with long-term maintenance, "passes" into a state of "self-support", that is, the process becomes irreversi- ble. At the initial stages of the formation of an adaptive response, which is fibrosis, until the “self-support” sys- tem is established, the process can be reversible, that is, a shift of the “degradation ↔ regeneration” equilibrium towards regeneration and restoration of the “previous” homeostatic balance in the body is ensured. Natural bi- ologically active compounds, in particular colostrum components, can act as factors capable of shifting the balance. Colostrum contains a unique natural set of bi- ologically active compounds of a wide spectrum of ac- tion, and they can have a systemic effect on the regula- tion of the process in the body [10, 18]. The effectiveness of the process of restoring the functional activity of the fibrotic-altered liver will de- pend on the systemic response of the body to the action of the pathogenetic factor. In the formation of the sys- temic response, the bone marrow plays a central, coor- dinating (integrative) role as a producer of blood cells and, first of all, immunocompetent cells [19]. Actively phagocytic cells not only remove apoptotic or necrotic cells and circulating immune complexes [20], but are also producers of a wide range of cytokines, low mo- lecular weight regulatory peptides, and other biologi- cally active substances [21]. These biologically active substances take both direct and indirect participation in enhancing the processes of liver regeneration and res- toration of its function and other body systems. The results of this work and previously obtained data on the study of the mechanisms of Cu-induced liver fibrosis indicate and indicate that: 1) 24 hours after the last three times administration of copper sulfate to experimental animals, liver fibrosis develops, which was at the initial stage of development [7]. This is evidenced by moderate morphological changes in the liver, as well as intensive growth of the
  • 10. 10 Norwegian Journal of development of the International Science No 70/2021 liver capsule [22]. These changes in the liver tissue oc- curred against the background of an increase in the con- tent of lipid hydroperoxides and inhibition of the activ- ity of glutathione peroxidase, aconitase, and other en- zymes [14]. 2) the reaction of the bone marrow manifests itself insignificantly to these relatively small homeostatic changes at the initial stages of the liver fibrosis devel- opment, as evidenced by the preservation of the number of erythrocytes and their structural and functional char- acteristics within the control values. The results ob- tained suggest that such a response of the bone marrow to the presence of liver fibrosis will not have an effect on its elimination; and the fibrosis will intensify and progress to the next stage, forming cirrhotic changes in the liver. In other words, relatively small functional changes in the liver that take place in our case may re- main "insignificant" for other regulatory systems of the body, in particular for the bone marrow; and the liver can move to the next stage of pathogenesis (Fig. 6). Fig. 6. Scheme that demonstrates different strategies for the development of liver fibrosis: I Introduction of copper ions, which is localized in the liver, induces oxidative stress, an increase in the content of lipyl hydroperoxides (LOOHs), inhibition of antioxidant enzymes (GPx), an increase in the number of platelets, inhibition of animal growth, while bone growth the brain does not "react" to these changes, as evidenced by the preservation of the number of immunocompetent cells at a constant level. II In the event that colostrum components are administered to animals with fibrosis, they activate the function of the bone marrow, which is accompanied by a pronounced increase in the content of immunocompetent cells in the bloodstream, elimination of oxidative stress and restoration of body weight growth, which may indicate an increase in the regeneration process of the fibrous liver. 3) if at the initial stages of the development of Cu- induced fibrosis experimental animals received the components of colostrum, then these components caused a pronounced response at the bone marrow level, which was expressed in an increase in the total number of leukocytes (by 59-80%), lymphocytes (by 30-68%), monocytes (82-160%), granulocytes (62%); at the same time, the number of platelets decreased and approached the control values. 4) these changes caused by the components of co- lostrum differ quantitatively depending on the compo- sition of these components. This indicates that different regulatory effects can be exerted on bone marrow cells by using different methods for fractionating whole co- lostrum. 5) changes in induction at the level of hematopoi- esis is accompanied by restoration of the activity of an- tioxidant enzymes, restoration of the immune system [9], restoration of the ability of animals with Cu-in- duced liver fibrosis to perform work [7] and is accom- panied by a slight increase in body weight growth (Fig. 6). The results obtained suggest that if there are minor structural and functional changes in the liver, which can be relatively easily compensated by hypertrophy of hepatocytes, then such changes will not affect the com- pensatory functions of the bone marrow, which will not cause a systemic response at the level of the organism. In this case, these structural and functional changes will be “fixed” in the liver, and the balance in the system of “fibrotic changes” will be preserved due to the activa- tion of stellate cells. The rest of the metabolic systems "adjust" (adapt) to the new functional state, since it is not at this stage of development dangerous, and after a certain time (long enough) the next stage of fibrosis will be formed, which will be irreversible due to the fact that most of the body systems “adapted”, that is, formed the mechanisms of“ self-maintenance ”of such a state. If, at the initial stages of fibrosis development, an “additional” signal is provided by colostrum compo- nents to the bone marrow, the activity of immunocom- petent cells and the possible activation of other body systems, including the intestinal microbiota, are in- creased, then the balance can be shifted towards the re- generation of liver cells and ensure the reversibility of fibrotic changes. REFERENCES: 1. Hernandez-Gea, V., & Friedman, S. L. (2011). Pathogenesis of Liver Fibrosis. Annual Review of Pa- thology: Mechanisms of Disease, 6(1), 425–456. doi:10.1146/annurev-pathol-011110-130246 2. Al-Eryani, L., Wahlang, B., Falkner, K. C., Guardiola, J. J., Clair, H. B., Prough, R. A., & Cave, M. (2014). Identification of Environmental Chemicals As- sociated with the Development of Toxicant-associated Fatty Liver Disease in Rodents. Toxicologic Pathology, 43(4), 482–497. doi:10.1177/0192623314549960 LOOHs ● LOOH s immunocompetent cells induction fibrosis liver GPx growth inhibition Leukocyte s Platelets Bone marrow Components colostrum ACTIVATION Fibrotic liver F0, F1 fibrogenesi s growth enhancement ENHANCING LIVER REGENERATIO N Leukocytes ● Platelets but if F2, F3 F4 CIRRHOSIS Cu2 + I I I Bone marrow Cu2 + Cu2 + GPx ●
  • 11. Norwegian Journal of development of the International Science No 70/2021 11 3. Liang, Q., Zhang, M., Hu, Y., Zhang, W., Zhu, P., Chen, Y., … Wang, K. (2020). Gut Microbiome Contributes to Liver Fibrosis Impact on T Cell Recep- tor Immune Repertoire. Frontiers in Microbiology, 11. doi:10.3389/fmicb.2020.571847 4. Albanis, E., & Friedman, S. L. (2001). Hepatic fibrosis. Clinics in Liver Disease, 5(2), 315–334. doi:10.1016/s1089-3261(05)70168-9 5. Shan, L., Liu, Z., Ci, L., Shuai, C., Lv, X., & Li, J. (2019). Research progress on the anti-hepatic fi- brosis action and mechanism of natural products. Inter- national Immunopharmacology, 75, 105765. doi:10.1016/j.intimp.2019.105765 6. Anatoliy I. Bozhkov, Eugeniy G. Ivanov, Yuliya A. Kuznetsova, Svetlana L. Ohiienko, Anasta- siya Yu. Bondar’. (2017) Copper induced liver fibrosis affects the “behavior” of bone marrow cells in primary culture. Front.biol. Vol. 12 Issue (4) : 271-279 7. A. I. Bozhkov, Yu. V. Nikitchenko, E. M. Klimova, O. S. Linkevych, K. M. Lebid, A. M. M. Al- Bahadli, and M. M. A. Alsardia. (2017) Young and Old Rats Have Different Strategies of Metabolic Adaptation to Cu-Induced Liver Fibrosis// Advances in Gerontol- ogy, 2017, Vol. 7, No. 1, pp. 41–50. 8. Puppel, Gołębiewski, Grodkowski, Slósarz, Kunowska-Slósarz, Solarczyk, … Przysucha. (2019). Composition and Factors Affecting Quality of Bovine Colostrum: A Review. Animals, 9(12), 1070. doi:10.3390/ani9121070 9. Bozhkov, A.I., Linkevych, O.S., Ivanov, E.G., Klimova, O.M. and Mohammad A. Y. AlBegai. (2016) Low molecular weight components of colostrum regu- late the activity of cellular component of the immune system in animals with Cu-induced liver fibrosis. Inter- national Journal of Current Research., 8(12), 44129- 44137. 10. A.I. Bozhkov, E.G. Ivanov, Mohammad A.Y. Al Begai, Mohammad M.A. Alsardia and N.I. Kur- guzova. (2017) Low-Molecular Weight Cow Colos- trum Components in Functional Nutrition. Journal of Nutritional Therapeutics, 6, 11-17. DOI: https://doi.org/10.6000/1929-5634.2017.06.01.2 11. Alexander Wree, Theresa Maria Holtmann, Maria Eugenia Inzaugarat, Ariel E. Feldstein. (2019) Novel Drivers of the Inflammatory Response in Liver Injury and Fibrosis. Semin Liver Dis, 39 (03): 275-282. 12. Божков А. И. (1997) Три дозозависимые стадии действия ионов меди на функциональную активность биологических систем // Биохимия. Т. 60, № 2. С. 176–186. 13. Bozhkov Anatoliy I., Klimova Olena M., Nikitchenko Yuriy V., Kurguzova Natalia I., Linkevych Olena S., Lebid Katherine M., Protsenko Olena S., Remneva Natalya A., Al-Bahadly Ali M. M., Al-Begai Mohammad A. Y. (2017). Оntogenetic approach to the study ofmechanisms of copperinduced liver fibrosis. Advances in Aging Research. Vol. 6. P. 39-54. 14. Bozhkov AI, Nikitchenko YuV, Lebid KM, Ivanov EG, Kurguzova NI, Gayevoy SS, Sharko MO, Alsardia Mohammad MA and Al Begai Mohammad AY. (2017) Low Molecular Weight Components from Various Sources Eliminate Oxidative Stress and Restore Physiological Characteristic of Animals at Early Stages of Cu-Induced Liver Fibrosis Development. Translational Biomedicine. Vol. 8, N 2, 107. 15. Karsdal, M. A., Daniels, S. J., Holm Nielsen, S., Bager, C., Rasmussen, D. G. K., Loomba, R., … Schuppan, D. (2020). Collagen biology and non‐ invasive biomarkers of liver fibrosis. Liver International. doi:10.1111/liv.14390 16. Agrawal, S., Gupta, S. (2011) TLR1/2, TLR7, and TLR9 Signals Directly Activate Human Peripheral Blood Naive and Memory B Cell Subsets to Produce Cytokines, Chemokines, and Hematopoietic Growth Factors. J Clin Immunol. 31, 89–98 17. TA Wynn (2008). Cellular and molecular mechanisms of fibrosis. , 214(2), 199– 210. doi:10.1002/path.2277 18. Kozheshkurt, Valentyn and Ivanov, Ievgen and Antonenko, Yevhenii and Katrich, Victor and Bozhkov, Anatoly and Gromovoy, Taras, (2021). De- vising An Express Method for Estimating the Quality of Colostrum and Its Components Based on Electrical Conductivity. Eastern-European Journal of Enterprise Technologies, 1/11 (109), 69–77. 19. S. L. Ohiienko, A. I. Bozhkov, A. Yu. Bondar, E. G. Ivanov, I. A. Ionov. (2019). Bone marrow cells obtained from old animals differ from the young ani- mals cells in their ability to divide and in response to the presence of liver fibrosis in primary culture. Ad- vances in Aging Research, 8, 14 –27. 20. Hart, S. P.; Alexander, K. M.; Dransfield, I. (2004). Immune Complexes Bind Preferentially to Fc RIIA (CD32) on Apoptotic Neutrophils, Leading to Augmented Phagocytosis by Macrophages and Release of Proinflammatory Cytokines. The Journal of Immu- nology, 172(3), 1882–1887. doi:10.4049/jim- munol.172.3.1882 21. Anthony J. Nappi; Enzo Ottaviani (2000). Cytotoxicity and cytotoxic molecules in inver- tebrates. , 22(5), 469–480. doi:10.1002/(sici)1521- 1878(200005)22:5<469::aid-bies9>3.0.co;2-4 22. Alcolado, R.; Arthur, M. J. P.; Iredale, J. P. (1997). Pathogenesis of Liver Fibrosis. Clinical Sci- ence, 92(2), 103–112. doi:10.1042/cs0920103
  • 12. 12 Norwegian Journal of development of the International Science No 70/2021 ECONOMIC SCIENCES RESULTS OF THE DEVELOPMENT OF THE COUNTRIES THAT CAME OUT OF 1991 Tarko A. Doctor of Physical and Mathematical Sciences, Professor of Mathematical Cybernetics Chief Researcher of the Dorodnicyn Computing Centre of the Federal Research Center «Computer Science and Control» of Russian Academy of Sciences DOI: 10.24412/3453-9875-2021-70-2-12-32 Abstract The analysis of the economic, demographic and socio-psychological development of Russia and other former USSR countries, the Warsaw Pact and Yugoslavia countries 30 years after 1991 is carried out. The development of two sectors of economy - the high-tech and the raw materials were investigated. Integral Index of Development ID was developed to assess the development of countries that came out of 1991. Keywords: gross domestic product, economic growth rate, life expectancy, socio-psychological violation, survival to age 65, high-tech development, foreign direct investments, raw materials, integral development index. 1. Introduction This paper will analyze the results achieved by the countries that went out the USSR and the Warsaw Pact in 1991. In view of thirtieth anniversary of these coun- tries we will compare their economic and social devel- opment, will consider the prospects for moving for- ward. One of the objectives of the study is to compare the results achieved by these countries, including com- parison with developed and developing countries of the world. In 1991, the republics of the former USSR, the Warsaw Pact and Yugoslavia underwent to a market economy regime. The Warsaw Pact countries and Yu- goslavia began to develop on the basis of a multi-sector economy, in Russia, the main sector of the economy has become the extraction of raw materials. Russia and the countries that left the USSR have mostly united into the Union of Independent States (CIS). The countries of the former Warsaw Pact and Yugoslavia after 1991 began to focus on the European Union and NATO. Economic interactions between the two groups of countries are largely weakened. The aim of this study is to analyze and compare the development of the three groups of countries – for- mer Soviet Union (FSU), the former Warsaw Pact, in- cluding the Baltic States that joined their system (FWPB), the former Yugoslavia (FYU). We will com- pare the development mentioned countries with the Eu- ropean Union and other countries of the world. The raw materials sector is no longer the only one in Russia. After the beginning of the global economic crisis in 2008, elements of the high-tech sector, the met- allurgical sector and agricultural production began to better develop in Russia. Our task is to study both the economic systems in countries and the living conditions of their population. This means that our way of investigation is differ from the UN program of Human Development Index (HDI). Technically, the method of analysis is based on the con- sideration of many parameters of development. If the knowledge of GDP per capita, life expectancy and ed- ucation received by a person are enough to assess the living conditions of a person, then to characterize the state and development of countries and the social pro- cesses going on in them, it is necessary to analyze dif- ferent parameters characterizing the dynamics of the economy and demographic development of the country to assess the course of processes. It should be noted that we recently performed a study of HDI of the subjects of the Russian Federation [8]. The study was performed using different princi- ples. The parameters characterizing both positive de- velopment and negative phenomena were considered. A large number of parameters were analyzed. This analysis was carried out on the basis of databases of the Federal State Statistics Service [10]. Space remote sensing data were also involved in the work. Now world development contains two simultane- ous processes: 1) scientific and technological progress against the background of economic growth and the continuation of globalization in the countries of the world; 2) the systemic global economic crisis that slows down the economy and all processes that depend on it [4, 5, 6]. The way out of the crisis requires a structural ad- justment of the economy; the financial system is part of what needs to be rebuilt. It is necessary to change the structure of economic relations in a globalized world. Now the search for a way out of the situation requires choosing the direction of structural adjustment of the economy, depending on the choice of new development paths. Globalization has not stopped, but its direction and speed have become largely dependent on problems that previously had little impact on decision-making. The search for new ways often takes place by trial and error, and there are undoubtedly quite a lot of these choices. In these conditions, complex mathematical modeling and forecasting acquires new tasks. All quantitative data were obtained from the World Bank databases [14], and small use of British Petroleum data [13]. 2. Economy Let's start with an analysis of the income in the countries - the gross domestic product per capita (GDP) in each of the countries – the FSU, the FWPB and the FUY (Fig.1). We will compare the development of
  • 13. Norwegian Journal of development of the International Science No 70/2021 13 countries, including with other developed and also de- veloping countries of the world. On the graph, the coun- tries of each group are represented by groups of col- umns, in each group in descending order of the param- eter value. Further to the right there are the columns average values of the parameters of the countries repre- sented by the World Bank are given: high-income countries, the European Union, low-income countries and the least developed countries (according to the ter- minology of the UN). Also data of usual countries pre- sented. GDP is expressed in US dollars, taking into ac- count the purchasing power parity of the dollar at cur- rent international prices [14]. 29 181 27 518 19 997 15 656 15 207 15 041 14 258 13 627 13 341 7 308 5 486 3 529 44 296 40 016 39 986 35 165 34 966 33 516 33 340 33 021 25 312 42 431 31 131 24 036 19 495 18 108 16 289 52 785 47 828 3 060 2 340 70 006 65 298 57 530 53 172 50 993 49 932 44 011 16 804 89 684 0 10 000 20 000 30 000 40 000 50 000 60 000 70 000 80 000 90 000 Russia Kazakhstan Belarus Georgia Turkmenistan Azerbaijan Armenia Moldova Ukraine Uzbekistan Kyrgyzstan Tajikistan Czech Lithuania Estonia Poland Hungary Slovakia Romania Latvian Bulgaria Slovenia Croatia Montenegro Serbia N. Macedonia Bosnia & Herz. High.income Europ. Union Least Low Income Ireland Norway USA Germany Finland France Great Britain S. Korea. China GDP per capita, USD GDP per capita in the groups of countries in 2019, USD Fig. 1. GDP per capita in three groups of countries and other values in 2019. Explanations are in the text. It should be noted that the average income values of the three groups of countries are equal, respectively: FSU – $ 15,012, FWPB – $ 35,513, FUY – $ 25,248. It can be seen that the FWPB countries have achieved higher development, followed by the FUY countries, the FSU countries have the least results. This differ- ence between the countries is also visible visually – the array of columns for the FSU countries is noticeably lower than the FWPB and FUY. It should be added that the highest columns on the chart are the developed countries of the world occupying its right part – from Ireland ($89,684) and Norway ($70,006) to the United States (65,298), Finland (53,172) and France (50,993). Taking into account the fact that the GDP of the Euro- pean Union is equal to $ 47,828, we see that none of the countries that came out of 1991 has reached either the level of the EU or the level of advanced developed countries. We see that among the countries of the former So- viet Union, Russia's GDP per capita is the largest – $ 29,181. This value is lower than any the FWPB coun- tries except Bulgaria. Of the FUY countries, Slovenia and Croatia are ahead of Russia. Such an achievement of the former leader of the socialist camp after almost 30 years of development in the new economy is not too great achievement. The income of the United States ex- ceeded the income of Russia by 2.4 times, Germany by 1.97 times, Finland by 1.8 times. In terms of GDP per capita, Russia’s rank is 54th in the world, being be- tween Malaysia and Oman. It should also be noted that Russia occupies the 52nd place in the UN list of HDI, and in the list of 27 countries of the FSU, FWPB and FUY it is on the 12th place. Analyzing the countries of the former USSR, we must note that in addition to Kazakhstan, Belarus, Georgia and Kyrgyzstan, other countries of the FSU are much poorer than Russia – their GDP per capita is al- most half as much. However, the greatest surprise and regret is caused by Tajikistan, whose income, as can be seen from Fig. 1, is close to the poorest World countries – low income and the least developed. This is a self-supporting catas- trophe that has been going on for many years. However, the author knows that mathematical sci- ence in Tajikistan is not destroyed – in these conditions, high-quality scientific articles are published, and new generations of scientists are being trained at the Tajik National University at its 18 faculties. An attentive reader has undoubtedly noticed that the GDP per capita in China ($16,804) is not so much, it is less than the average income in the European Un- ion, its level slightly lower than Belarus ($19,997) and slightly higher than Bosnia and Herzegovina ($16,289). This is due to the specific development of this country. With China's total income comparable to the United States, the income per person is low – rapid high-tech development does not occur throughout all the country, and with a high population, the income per person lags behind the income of a resident of Belarus. We will re- peatedly see this phenomenon of transformation of great achievements when moving to the level of one resident of China during subsequent aalysis. Another conclusion, following from the analysis of Fig. 1, is that the countries of the FWPB and FUY have not achieved the results of the advanced countries
  • 14. 14 Norwegian Journal of development of the International Science No 70/2021 of Europe and the world. Obviously, the system of par- ticipation of these countries in the EU has flaws that have not yet become clear. The idea comes that a suffi- ciently rich European Union could organize active ma- terial and technological support for new countries join- ing it, such as, for example, the European equivalent of the Marshall Plan. However, it seems that these coun- tries have received a very "light" form of such assis- tance. Let's consider the growth rates of GDP per capita in 2019 in the studied groups of countries (Fig. 2). We will immediately notice unexpected phenomena. The average growth rates of GDP per capita in the three groups of countries studied by us were FSU – 3.6%, the FWPB – 3.9% and the FUY – 3.5%. Unexpectedly these rates exceed not only the European Union (1.87%), but also the advanced countries – Denmark – 2.41%, Greece – 2.03%, the USA – 1.68%, France – 1.37%, Belgium – 1.24%, Finland – 1.06%. In the pe- riod of 2012-2019, the pace of development was even less. The exceptions were the countries with special de- velopment, China – 5.73% and Ireland – 3.97%. 7.38 5.47 5.16 4.48 3.83 3.60 3.16 2.34 1.41 1.40 1.37 4.89 4.78 4.64 4.63 4.55 4.43 2.82 2.18 1.95 4.81 4.08 3.39 3.37 3.18 2.49 1.87 5.73 3.97 2.41 2.03 1.37 1.24 1.68 0 2 4 6 8 10 Armenia Moldova Georgia Tajikistan Ukraine Uzbekistan Kazakhstan Kyrgyzstan Russia Belarus Azerbaijan Lithuania Romania Hungary Estonia Poland Bulgaria Latvian Slovakia Czech Serbia Montenegro Bosnia and Herz. Croatia C. Macedonia Slovenia Europ. Union China Ireland Denmark Greece USA France Belgium Percentage of GDP growth per capita GDP per capita growth rate in groups of countries in 2019, % Fig. 2. GDP growth rates per capita in the countries of the FSU, FWPB and FUY and the advanced developed countries of the world in 2019. The system of data presentation and notation, as in Fig.1. The low rates of advanced developed countries, extremely small in terms of their usual development, indicate that most of them are still exposed to the ongo- ing systemic crisis of the economy. It is hard to believe that the financial crisis of developed countries, which is usually talked about in the West, has been recurring several times over the past 12 years. As already mentioned, from Fig. 2 it can be seen that the countries of the FSU, FWPB and FUY have growth rates significantly higher than the advanced countries. This circumstance confirms the fact discov- ered earlier by A.M. Tarko that in the years of increas- ing crisis, the richest countries are primarily exposed to it, the decline in the development of the less rich occurs a few years later [5, 6]. It should be noted that Russia, Belarus and Azer- baijan have the lowest rates of development not only in their group, but in comparison with the countries of the FWPB and FUY– Russia – 1.41%, Belarus – 1.40, Azerbaijan – 1.37%. Undoubtedly, each "failure" in the growth rate has its own reasons; first of all, this can be seen in the economic crisis and a decrease in oil sales in the years under review. Consumption of electricity per capita is important characteristic of the both – the standard of living of a person and the level of economic and technological de- velopment of his country. These data are presented in Fig. 3.
  • 15. Norwegian Journal of development of the International Science No 70/2021 15 6 603 5 600 3 680 3 419 2 694 2 679 2 202 1 962 1 941 1 726 1 645 1 499 6 732 6 259 5 137 4 709 3 972 3 966 3 821 3 507 2 584 6 728 4 612 4 272 3 714 3 497 3 447 8 929 6 022 7 035 6 940 5 130 3 927 10 497 12 997 0 1 500 3 000 4 500 6 000 7 500 9 000 10 500 12 000 13 500 15 000 Russia Kazakhstan Belarus Ukraine Georgia Turkmenia Azerbaijan Armenia Kirghizia Moldova Uzbekistan Tajikistan Estonia Czech Slovakia Bulgaria Poland Hungary Lithuania Latvia Romania Slovenia Montenegro Serbia Croatia N. Macedonia Bosnia and Hertz. High income Euro Union Finland USA S. Korea Germany France Great Britain China kWh per capita Electricity consumption in groups of countries in 2014, kWh per capita 15 249 Fig. 3. Electricity consumption in the countries of the FSU, FWPB and FUY and in the advanced developed countries of the world in 2014 (kWh per capita) In the given year the electricity consumption (kWh per capita) of four countries that came out of 1991 – Estonia (6,7), Slovenia (6,7), Russia (6,6) and the Czech Republic (6,3) exceeded the average value in the European Union – 6,0. At the same time, the electricity consumption of Finland (15,3) exceeds Russia by 2.3 times, the USA (12,9) – by 2 times, South Korea (10,5) – by 1.6 times. It means that advanced developed coun- tries live in more comfortable conditions. The average values of electricity consumption – FSU – 2,9, FWPB – 4,521, FUY 4,378 – are less than the average value of the European Union (6,0). At the same time, the lowest power consumption is in the countries of the FSU. 3. Demography Let us turn to the analysis of demographic pro- cesses. This article was written for the purpose of as- sessing the development of countries, so we hope to ap- ply the demography not only as the tradition science of population reproduction, but for our purposes – the analysis of socio-economic processes. Let's start with current healthcare spending in 2019. (Fig. 4). We will express health care expenditures not in traditional shares of countries ' incomes, but in real monetary terms per capita.
  • 16. 16 Norwegian Journal of development of the International Science No 70/2021 1 488 1 275 1 132 1 037 796 784 683 634 480 459 260 250 3 041 2 428 2 313 2 180 2 115 2 015 1 896 1 634 1 576 3 158 1 876 1 711 1 485 1 301 1 073 5 972 4 205 219 193 6 098 5 250 4 504 4 457 3 214 935 0 500 1 000 1 500 2 000 2 500 3 000 3 500 4 000 4 500 5 000 5 500 6 000 6 500 7 000 Russia Turkmenistan Belarus Armenia Georgia Kazakhstan Ukraine Azerbaijan Moldova Uzbekistan Kyrgyzstan Tajikistan Czech Estonia Lithuania Slovakia Hungary Poland Latvian Bulgaria Romania Slovenia Croatia Montenegro Serbia Bosnia & Herz. N. Macedonia High-income European Union Low income Least devel. USA Germany France Japan Finland S. Korea. China PPP dollars Current health expenditures per capita in groups of countries in 2019, PPP dollars 10 624 Fig. 4. Current health expenditures per capita in groups of countries in 2019, taking into account purchasing power parity (PPP) We can see from fig. 4 that in 2019, an average value of expenditure in the FSU was of $ 773 per per- son. The expenses in the FWPB group were the larger - $ 2,133, in the FUY they are slightly less – $ 1,767. The European Union spent much more per person – $ 4,205. This means that were in the countries of the FSU, on average, spent 5.4 times less. the expenditure on healthcare in Russia amounted to $ 1,488, was 3 times less than in the European Union. The largest expenditure on health care in FWPB was in the Czech Republic – $ 3,041 (2.0 times more than in Russia), and in the FUY – $ 3,158 (2.1 times more than Russia). It should be noted that health care costs in the United States were $ 10,624, in Germany – $ 6,098, in Finland – $ 4,457 – respectively, the costs were 7.1, 4.1 and 3 times more than Russia. Thus, in relation to healthcare in Russia, the costs are from 3 to 7 times less than in advanced developed countries. An important fact in the development is that the Central Asian countries – Kyrgyzstan and Tajikistan – live in a special world. Having incomes close to the poorest and least developed countries, they have (as can be seen from Fig. 4), Tajikistan's income is 8.3 times less than Russia's) and health care close to these coun- tries in Tajikistan – $ 250 – is 5.9 times less than Rus- sia, The backlog of three groups of studied countries cannot be proud of the data on life expectancy at birth (LE) (Fig, 5). The lag countries of the FSU, FWPB and FUY lag far behind other European countries. The av- erage values of LE for the three groups of countries are 72.4 years, 76.7 years and 77.6 years. The value of the European Union is noticeably greater – 81.1 years. For Russia with an LE equal to 73.2 years – this is an 8-year lag. None of the three groups of countries of the FSU, FWPB and FUY, with the exception of Slovenia (81.3 years), exceeds the average value in the EU. These countries are at the bottom positions in Europe. Also, for example, the LE of Japan, 84.4 years, is more than Turkmenistan, 68.2 years, by 16 years, while the LE of Turkmenistan is close to the value of the least devel- oped countries – 65.35 years.
  • 17. Norwegian Journal of development of the International Science No 70/2021 17 75.1 74.2 73.8 73.2 73.1 73.0 71.9 71.8 71.7 71.6 71.1 68.2 79.1 78.5 77.9 77.5 76.1 76.0 75.5 75.2 74.9 81.3 78.4 77.4 76.9 75.8 75.7 81.1 65.3 84.4 82.6 81.8 81.2 80.9 78.8 76.9 60 65 70 75 80 85 Armenia Belarus Georgia Kazakhstan Russia Azerbaijan Moldova Ukraine Uzbekistan Kyrgyzstan Tajikistan Turkmenista Czech Estonia Poland Slovakia Lithuania Hungary Romania Latvian Bulgaria Slovenia Croatia Bosnia & Montenegro N.Macedonia Serbia Euro Union Least devop. Japan France Finland Great Britain Germany USA China LE, years Life expectancy at birth (LE) in gropups of countrues in 2019 г., years Fig. 5. The values of the life expectancy for groups of countries in 2019 Let's consider another demographic indicator – in- fant mortality in 2019. (Fig. 6). This value in Russia 4.9, it is is higher than normal values in Europe. The average infant mortality values per 10,000 deaths are 14.3 in the FSU, 3.7 in the FWPB, 3.8 in the FUY. In the European Union, this parameter equals – 3.32, and in high-income countries 4.3. In some of these coun- tries, the minimum values in Europe are reached, but there are also countries with infant mortality that has not gone far from the Middle Ages – in Turkmenistan it is 36.3, while this mortality in the least developed countries is 44.8. In all the republics in Central Asia, the child mortality rate is higher than 15, and this situ- ation has not been corrected for many years. Fig. 6. Infant mortality values for groups of countries in 2019 Our next parameter is maternal mortality. in 2019 (Fig. 7). Its value in Russia – 7 is the same as in Ger- many. However, the average values of the countries of the FSU – 9.7, FWPB – 9.7, FUY – 8.3 exceed the value in the European Union – 6.0. Here the situation is similar to the situation of infant mortality – some coun- tries have minimum values in Europe, but especially in the countries of Central Asia there are countries with extremely high mortality – in Kyrgyzstan, the maxi- mum is 60. Just as in the Central Asian regions, the de- crease in this type of mortality is very slow.
  • 18. 18 Norwegian Journal of development of the International Science No 70/2021 Fig. 7. Maternal mortality values for groups of countries in 2017 There is a new parameter of demography – the probability that men will survive to 65 years (Fig. 8). Again, we see the lowest row of columns belonging to the FSU countries group. On average, the probability of living to 65 years in the countries of the FSS is 67.4%, the FWPB is 73.9%, and the countries of the FYU are 80.6%. The most noticeable result here is a unique phe- nomenon that Russia has the lowest probability of sur- vival among all the countries under consideration – 60.8%! The most dangerous and sad circumstance is that Russia's value is closest and almost equal value to low-income countries 59.5% and least developed coun- tries 62.2%. This indicates the extraordinary social sit- uation of life in a country that was once a landmark of a bright future. Unfortunately Ukraine and Turkmeni- stan show close, not much greater values to Russia. Probability of surviving to 65 in the European Union is 84.4%. We see a very big difference. And the greater difference shows Ireland-89.3%, Norway – 89.1%, , South Korea-88%, Great Britain-87.2%. 74.7 73.2 72.0 71.7 68.4 68.0 67.8 67.5 63.9 61.9 61.2 61.1 83.1 77.3 77.1 77.1 73.8 73.2 72.1 67.8 66.9 85.8 81.1 81.0 80.1 79.6 77.3 69.1 62.6 89.4 89.3 85.7 85.6 85.3 83.5 79.9 88.2 60 65 70 75 80 85 90 Azerbaijan Armenia Tajikistan Uzbekistan Kyrgyzia Georgia Kazakhstan Belarus Moldova Ukraine Turkmenistan Russia Czechia Slovakia Estonia Poland Hungary Romania Bulgaria Latvia Lithuania Slovenia Bosnia and Herz. Croatia Montenegro North Macedonia Serbia Euro Uniom Low input Ireland Norway Korea S. Germany Finland France China USA Survival to 65 years, % of cohort Probability of survival to 65 years in groups of countries, men (% of the cohort) 2019 Fig. 8. The probability of surviving to the age of 65 in 2018 for men of the country groups
  • 19. Norwegian Journal of development of the International Science No 70/2021 19 Let's consider the share of the population 65 years and older in the countries (Fig. 9). Here Russia is on the 3rd place among the countries of the FSU, but it is in- ferior to many countries of the FWPB and FYU. The average values of the percentage state of the three groups of countries - FSS-9.7%, FVDB-19.4% , FYU- 17.7% show that the share of the elderly is the smallest in the FSU countries. The next effect we see countries of Central Asia: a situation consisting of a well-known respect for the elderly, but their number is the smallest among all other 1991 countries. This parameter is slightly smaller that in low income countries of the world (3.3): Kyrgyzstan – 4.60 – Uzbekistan – 4.60 – Turkmenistan – 4.59 – Tajikistan – 3.09. Having the highest child mortality and the small- est proportion of elderly people countries are a slowly eliminate developmental defect that has been going on since ancient times. 16.7 15.2 15.1 12.0 11.5 7.7 6.4 4.6 4.6 4.6 3.1 21.3 20.3 20.2 20.0 19.8 19.7 18.8 18.1 16.2 20.9 20.2 18.7 17.2 15.4 14.1 20.5 3.3 21.6 18.5 17.3 16.2 11.5 22.1 28.0 15.1 0 3 6 9 12 15 18 21 24 27 Ukraine Belarus Russia Georgia Moldova Armenia Kazakhstan Azerbaijan Kyrgyzstan Uzbekistan Turkmenistan Tajikistan Bulgaria Latvian Lithuania Estonia Czech Hungary Romania Poland Slovakia Croatia Slovenia Serbia Bosnia and Herz. Montenegro N. Macedonia European Union Low.income Japan Finland Germany Great Britain Norway USA China Percentage from total population Population ages 65 and above, in groups of countries in 2019 г., % of total population Fig. 9. The share of the population 65 years and older in groups of countries in 2019 4. Socio-psychological violation at a national scale Now let's move on to the study of unexpected so- cio-political disorders in large population groups with the help of using demographic parameters. We will make a new application for demographic parameters – will use them as indicators of socio-psy- chological disorders of large of population groups [9]. The author of this paper apparently, is the first who found and applied such use to demographic parameters on a national scale. This phenomenon is first to be de- tected as incomprehensible and unpleasant phenome- non, then to determine its etiology. For example, in space medicine the author knows about this [2]. When specialists learned to support a rel- atively long stay of an astronaut in the orbit, a bad changes in the electrocardiogram were detected. It looked like a strong incomprehensible pathology. Soon it was found that with a sufficiently long stay in weight- lessness in the absence of gravity, the internal organs begin to shift in the body. This gave the appearance of a view of strong pathology of the electric cardiogram. When the phenomena was understood, doctors quickly learned to deal with the case. So the first large-scaled socio-psychological vio- lation is the emergence of migration of the largest of the population groups of the EU countries from their native countries to its richer countries. The indicator of this was the strong increase of the death rate of popula- tion. If we consider the points of the values of the coun- tries of the world in the plane of the coordinate axes " crude death rate " and "LE" (Fig. 10), we can expect that the values of mortality will decrease with increas- ing of LE – the points will occupy the diagonal of the corresponding plane of parameters. However, recently, in the range of LE values of 72-77 years, the points have stopped following this direction – in a number of countries death rate in this range has significantly in- creased! Thus, now the maximum world death rate is 15.5 per 1000 in 2019. It was registered in Bulgaria, and this country with the highest mortality rate in the world, overtaking the traditional champions – the poor- est countries in Africa. Now it is joined by Ukraine – 14.7, Serbia – 14.6, Latvia – 14.5, Lithuania – 13.7, Ro- mania – 13.4, and other countries.
  • 20. 20 Norwegian Journal of development of the International Science No 70/2021 Fig. 10. The relationship death rate and life expectancy in the world in 2018 The values of the countries of the FSU, FWPB, FUY and several developed countries of the world are highlighted In this case, people have started moving to richer countries. Mentioned migration originated several years ago in Europe. A part of the young working-age population that joined the EU or has not yet joined took advantage of free movement and have started moving to richer European countries. The remaining elderly population in their country, in accordance to the Gom- pertz law, has a significantly higher death rate, which is manifested in the statistics of these countries in the form of a "paper" increase of mortality. This phenome- non unintentionally compromised the demographic pa- rameter of total mortality. Statistics have shown an in- crease in total mortality in such countries to values higher than the maximum mortality in the poorest coun- tries of the world. It should be noted that the mortality parameter in this case has become an indicator of a se- rious change in the socio-psychological state of the people. The author of this article wrote about this phe- nomenon several years ago [6, 8]. It should be noted that Bulgaria has the largest number of elderly people among all the countries we are considering – 21.3% (Fig. [9]). This confirms that after moving to work in richer countries of Europe, young workers gave the world not only the highest mor- tality rate, but also a high percentage of the remaining elderly people in the country. Now the increase in migration of population to other countries in an increasingly free world is making larger. This can be perceived as one of the manifesta- tions of the idea of the devil's pump of N. N. Moiseev [3]. The difference is that he believed that rich countries would take talented people from developing countries, but it turned out that modern migration attracts every- one – f the lowest-paid professions to talented people. According to the forecast of A. N. Chumakov and Stychinsky [11] migration from less developed to more developed countries in a few years will significantly in- crease worldwide and will become a new factor of world development. Another manifestation of the change in socio-psy- chological living conditions in Europe is a significant increase in negative expectations of the population in some countries, the main of which, apparently, are Rus- sia, Belarus and Ukraine. A parameter is responsible for this is the difference between the life expectancy of women and men (DLE) (Fig. 11). This parameter was proposed by A. M. Tarko a few years ago [6]. He came to the conclusion that DLE is an indicator of unfavora- ble and unachievable social expectations of large groups of people in society. On the graph of the DLE in 2019 (Fig. 11) we see that the maximum values of DLE have Belarus – 10.1 years, Ukraine – 10.06 years and Russia – 9.93 years. The remaining values among the FSU countries are no- ticeably less. In the FWPB countries the situation with the max- imum values of DLE is almost completely repeated for the case of maximum values of the FSU – countries: Lithuania – 9.50 years, Latvia – 9.10 years and Estonia – 8.40 years. There is no something like this in the ad- vanced developed countries of the world – in the EU countries, the average values of DLE are 5.4 years, in high-income countries 5.2 years.
  • 21. Norwegian Journal of development of the International Science No 70/2021 21 10.10 10.06 9.93 8.79 8.53 8.48 8.20 7.19 7.01 4.94 4.45 4.24 9.50 9.10 8.40 7.70 7.50 7.00 6.50 6.40 5.80 6.20 5.70 5.30 4.96 4.86 4.05 5.37 5.19 3.79 6.04 5.30 5.10 4.80 4.48 4.48 3.70 3 4 5 6 7 8 9 10 11 Belarus Ukraine Russia Georgia Moldova Kazakhstan Kyrgyzstan Armenia Turkmenistan Azerbaijan Tajikistan Uzbekistan Lithuania Latvian Estonia Poland Romania Bulgaria Slovakia Hungary Czech Croatia Slovenia Serbia Bosnia & Herz. Montenegro N. Macedonia European High income Least devel. Japan Finland USA Germany China China Great Britain DLE, years Difference between LE of women and men (DLE) in groups of countries in 2019, years Fig. 11. The difference in the LE of women and men (DLE) in groups of countries in 2019 The mechanism of the "action" of DLE is known. In unfavorable conditions with negative and uncertain expectations, a genetic difference in the physiological properties of women and men is manifested – in men, mortality increases significantly more strongly. This is explained by the diseases that occur to a greater extent in life – threatening diseases – heart attacks, strokes and others. This is confirmed by many studies – including data from ambulance workers [1]. It is worth noting that in 2019 in Russia, the LE of women is 78.2 years, and men – 68.2. The difference in the time of life between women and men 10 years - is not present either in the poorest or in the richest countries. Recently, the author found that the number of sui- cides in Russia, Belarus and Ukraine, as well as Lithu- ania and Latvia, are the largest in Europe (Fig. 12), and these countries with the highest DLE (Fig. 6) and the largest suicides are the same countries. This is the most reliable confirmation of the fact that the DLE charac- terizes the unfavorable situation and negative expecta- tions of the population. 34.5 32.7 29.0 22.2 22.0 13.0 8.5 6.5 6.1 5.0 4.3 35.8 28.5 17.8 17.8 17.6 17.0 15.0 13.2 23.1 21.3 17.2 13.1 10.3 9.1 11.7 5.7 12.4 8.1 7.8 3.6 17.5 23.3 2.9 10.9 0 5 10 15 20 25 30 35 40 Russia Ukraine Belarus Kazakhstan Moldova Georgia Kyrgyzstan Uzbekistan Turkmenistan Azerbaijan Armenia Tajikistan Lithuania Latvian Estonia Slovakia Hungary Poland Czech Romania Bulgaria Slovenia Montenegro Croatia Bosnia and Serbia N.Macedonia Europ. Union Least devel. Korea S. USA Germany Norway Great Br. China Difference of suicides, per 100,000 Difference in suicides number of men and women in groups of countries in 2019, per 100,000 Fig. 12. Difference of suicides numbers of men and women in groups of countries, per 100,000
  • 22. 22 Norwegian Journal of development of the International Science No 70/2021 According to A.M. Tarko this DLE parameter is not the only one parameter of manifestation of this neg- ative socio-psychological state of the population. An- other indicator is the crude death rate: the population of Russia is not prone to mass migrations, but the graph Fig. 8 clearly shows an increase in death rate [5]. It should be added that unfavorable conditions with a lack of decent work, unemployment and other negative conditions contribute to an increase in mortal- ity among men. A few years ago, Federal State Statis- tics Service (ROSSTAT) data showed that there is a group of about 20 regions mainly around the Moscow region, in which the total mortality is higher than the largest in the world [5??6]. This situation has been go- ing on for several years and has persisted until 2019. This case shows that the demographic parameter acquires a bright social significance. For Russia to be the last country in Europe with an important parameter that characterizes social life is an unfavorable phenom- enon. It is undoubtedly another indicator of trouble. It should be noted that Bulgaria has the largest number of elderly people among all the countries which we are considering – 21.3% (Fig. 9). This seems to con- firm the situation that after moving to work in richer European countries, young workers gave the world not only the highest mortality rate, but also a high percent- age of the remaining elderly people in the country. 5. Technical and high-tech development To analyze the high-tech development of the world countries, almost the same parameters will be needed as in the analysis of the development of a con- ventional economy, but in a specific area that requires an understanding of the essence of high-tech produc- tion. [12]. These parameters express complex interac- tions of special economic processes that depend both on the decisions of the leaders of countries and on or- ganizations that create high-tech products. The possi- bility of creating high-tech products depends both on the level of development of the country, the focus of development on obtaining high-tech production, wealth and a well-developed higher education system in the country. Let's consider the share of income of three groups of countries from the production and export of high- tech products in relation to all industrial products in 2019. (Fig. 13). The average values here are as follows: FSU – 8.3%, FWPB – 12.8%, FUY – 6.3%. We see that the FWPB countries have overtaken both the FSU and the FUY. However, out of all three groups of countries, the representative of the FSU – Kazakhstan was in the first place (28.8%). Russia came in second place in the FSU group (13%). Exports of the Czech Republic, Hungary and Latvia amounted to 20.8%, 17.5% and 17.2%, respectively, which is significantly more than that of Russia. However, only Kazakhstan and the Czech Republic surpassed the high-income countries (20.6%) and the European Union (16.1%). But these achievements are small compared to, for example, South Korea (32.4%), China (30.8%), France (27.0%) and Ireland (26.0%). As a result, Russia is on the 9th place in terms of high – tech exports – between Roma- nia and Poland. This position of Russia shows that high-tech exports are not the main point of its develop- ment. As we will see, its raw material exports provide a major share of income. Fig. 13. Exports of high-tech products in groups of countries, percents of merchandise exports in 2019 is shown Let's consider the high-tech exports expressed in US dollars of the countries and groups of countries which we are studying, (Fig. 14). I would like to draw attention to the fact that Russian high-tech exports are significantly ahead of the FSU countries, and only the Czech Republic, Poland and Hungary are ahead of it among the FWPB countries, it is the highest among the FUY countries. Among countries under consideration,
  • 23. Norwegian Journal of development of the International Science No 70/2021 23 the situation with high-tech products is better than that of Russia, only the Czech Republic – by 3.5 times, Po- land – by 2.2 times and Hungary – by 1.8 times. Russia many years ago was advanced country in the world, but now we must point out that now China has 71.9 times more high-tech exports than Russia, Germany – 20.6 times, South Korea – 18.9 times, the United States – 15.3 times, France – 11.6 times. In gen- eral, Now Russia is on the 30th place in the world in this parameter, ahead of Denmark and Slovakia and be- hind Israel and Brazil. Fig. 14. Export of high technologies in groups of countries of the world in 2019 US dollars. A logarithmic scale is applied along the horizontal axis. It should be noted that most of the countries of the FSU – except Kazakhstan and Belarus – have very small high-tech exports (Fig 15). So, if Kazakhstan's exports are 20.7% of Russia, Belarus – 6.97%, then Ar- menia's exports are 0.42%, Kyrgyzstan – 0.28%, Azer- baijan – 0.26%, Moldova – 0.23%, Uzbekistan – 0.19%, Georgia – 0.18%. Tajikistan, unfortunately, has no data on high-tech exports at all. Fig. 15. Export of high-tech production in groups of countries in percents of merchandise export in 2019
  • 24. 24 Norwegian Journal of development of the International Science No 70/2021 Foreign direct investment in the economy is used for various purposes, but most importantly – it allows you to deploy useful activities of foreign capital on the territory of your country. The influence of foreign di- rect investment allows for the introduction of more ad- vanced production technologies, more advanced equip- ment, the production of more advanced products, the import of more advanced management technologies. Information about foreign direct investment in the countries which we are studying presented in Fig. 16. The average value of direct investment is is 1.87% of GDP in high-income countries, 1.62% in the European Union, and 2.89% in low – income countries. Hungary has the largest investment of 19.6%. At the same time, Finland – allows itself to have investments – 5.9%, Norway – 3.16%, the United States – 1.64%, China – 1.09%. As for the analyzed countries, they do not have less than 1.85%. Russia in this area shows one of the smallest values – 1.88%. Here it should be noted that even poor Tajikistan has direct investments 2.62%. It is worth noting that Turkmenistan (4.80%), Uzbekistan (4.%) and Azerbaijan (3.13%) have one of the largest direct investments. Fig. 16. Foreign direct investment in groups of countries in 2019 The largest value of foreign investment belongs to Georgia – 7.67%. This circumstance may be explained by the special attitude of Western companies in special conditions when the country ranks penultimate among three countries that came out of 1991 in terms of ex- ports of high-tech products as a percentage (ahead of Uzbekistan) (Fig. 7) and penultimate in terms of ex- ports in monetary units (ahead of Estonia) (Fig. 8). Computer communication services are the most important type of activity that cannot be replaced by other actions. This includes international telecommuni- cations, computer data processing, and news operations between residents and non-residents; these are con- struction services, business, professional and technical services, and much more. Now both globalization and the life of ordinary people is impossible without these services. Different European countries participate in this activity in different ways (Fig. 17). On average, commercial services occupy 54% in the European Un- ion%. However, the distribution of these services varies markedly in different countries. Ireland performs a maximum – 81.7% of these works, Finland – 73.8% of these works, China – 62.6%, .South Korea. – 51.4%, USA – 48.9%, Norway – 34.0%. This distribution of work has developed historically. The reader will be in- terested to know that Ukraine is in the first place in the FSU countries – 53.1% and Belarus – 48.2%. Russia makes a little less – 45.8%. Volumes of work in FSU are smaller than the FWPB countries and some of the FUY countries. However, here we are surprised by the sharp decline in the performance of these works among some of the countries of the FSU – from Armenia – 22.3% and Azerbaijan – 21.3%, to Uzbekistan – 9.9% and Georgia – 4.4%. It should be noted that poor Kirgi- zia and Tajikistan perform more computer services than richer Kazakhstan and Uzbekistan. This is a manifesta- tion of their higher scientific training, received back in the time of the USSR. Fig. 17 shows that in 2019 minimum of communi- cation work in three groups of countries is carried out in Georgia. It is difficult to explain this phenomenon for Georgia, which is aspiring to European structures. In addition, as mentioned, it is the penultimate among the countries of the FSU, FWPB and FUY for the ex- port of high – tech products.
  • 25. Norwegian Journal of development of the International Science No 70/2021 25 53.05 48.17 46.72 45.76 22.35 21.28 14.74 13.49 11.82 9.94 4.41 57.16 51.07 50.44 49.06 48.13 43.90 41.78 35.12 27.76 59.06 52.89 36.12 28.76 20.65 14.23 53.68 73.79 62.63 56.24 53.91 51.72 48.86 0 10 20 30 40 50 60 70 80 Ukraine Belarus Moldova Russia Armenia Azerbaijan Kyrgyzstan Tajikistan Kazakhstan Uzbekistan Georgia Romania Poland Czech Hungary Estonia Slovakia Latvian Bulgaria Lithuania Serbia N. Macedonia Slovenia Bosnia and Herz. Croatia Montenegro European Union Finland China Germany France Great Britain. USA Percentage of commercial service exports Computer, communications and other services in ggoups of countries in 2019, % of commercial service exports Fig. 17. Computer and communication services in groups of countries in 2019 (% of exports) An element of scientific and technical work is the writing and publication of scientific and technical arti- cles. Fig. 18 shows information about the publication of scientific and technical articles in journals in 2018. We see that Russia was the birthplace of 81 thousand works in 2018. Almost 8 times fewer articles were pub- lished in Ukraine. However, the rest of the FSU coun- tries have published much fewer articles. Poland pub- lished 35 thousand of papers, it is maximum of FWPB. However, all these values are much less than the num- ber of production published in China – 528 thousand, the United States – 422 thousand. The output of Ger- many – 104 thousands, 22% more than Russia. 81 579 10 380 2 367 1 180 761 550 521 354 210 137 62 4 35 663 15 577 10 345 6 701 5 322 3 311 2 267 1 418 1 415 4 523 4 277 3 206 704 493 250 97 681 66 376 5 308 10 876 104 396 422 808 528 263 524 444 1 10 100 1 000 10 000 100 000 1 000 000 Russia Ukraine Kazakhstan Belarus Azerbaijan Georgia Armenia Uzbekistan Moldova Kyrgyzstan Tajikistan Turkmenistan Poland Czech Romania Hungary Slovakia Bulgaria Lithuania Latvian Estonia Serbia Croatia Slovenia Bosnia and Herz. N. Macedonia Montenegro European Union Least developed. Low income China USA Germany Great Britain South Korea. Scientific and technical journal articles In groups of countries in 2018. Fig. 18. The number of papers published in scientific and technical journals of different countries in 2018 A logarithmic scale is applied along the horizontal axis.
  • 26. 26 Norwegian Journal of development of the International Science No 70/2021 6. Extraction and export of raw materials and of natural resources When we turn to the raw materials sector and to the economy of Russia and other countries, we will see that the most popular is oil production. According to British Petroleum (table 1) [13] Russia in 2019 was on the second place in the world, Kazakhstan was on the 13th, Azerbaijan on the 24th place. Table 1. Oil production in million tones in 2019 according to British Petroleum [13]. Country Млн т 1 USA 746,7 2 Russia 568,1 3 Saudi Arabia 556,6 4 Canada 274,9 5 Iraq 234,2 6 China 191,0 7 United Arab Emirates 180,2 8 Iran 160,8 9 Brazil 150,8 10 Kuwait 144,0 11 Nigeria 101,4 12 Mexico 94,9 13 Kazakhstan 91,4 14 Qatar 78,5 15 Norway 78,4 16 Angola 69,1 17 Algeria 64,3 18 Libya 57,8 19 Great Britain 51,8 20 Oman 47,3 21 Colombia 46,7 22 Venezuela 46,6 23 Indonesia 38,2 24 Azerbaijan 38,1 25 India 37,5 26 Egypt 33,6 27 Malaysia 29,8 28 Argentina 28,8 29 Ecuador 28,5 30 Australia 20,6 31 Congo Rep. 17,4 32 Thailand 17,0 33 Turkmenistan 12,5 34 Vietnam 11,4 35 Gabon 10,9 36 Equatorial Guinea 8,2 37 South Sudan 6,8 38 Chad 6,7 39 Peru 6,1 40 Brunei 5,9 41 Sudan 5,0 42 Denmark 5,0 43 Italy 4,3 44 A country. 4,2 45 USA 3,7 46 Russia 3,6 47 Saudi Arabia 2,8 48 Canada 2,3 49 Iraq 1,0
  • 27. Norwegian Journal of development of the International Science No 70/2021 27 Fuel sales are more volatile – economic and polit- ical factors change more often than equipment for oil production, transportation and refining (Fig. 19). In 2019. Russia was on the 2nd place in terms of export share after Kazakhstan among the FSU countries and was inferior to Norway in Europe. At the same time, its share of exports was 4.2 times more than that of high- income countries and 11.2 times more than the Euro- pean Union. 91.7 70.0 52.7 25.1 24.9 7.6 3.7 2.1 1.8 14.6 5.2 4.1 3.0 2.8 2.6 1.9 20.8 10.6 5.2 1.7 62.1 13.5 9.5 8.5 7.9 3.5 0.047 1.9 2.1 9.8 0 10 20 30 40 50 60 70 80 90 100 Azerbaijan Kazakhstan Russia Belarus Uzbekistan Kyrgyzstan Armenia Georgia Ukraine Moldova Lithuania Bulgaria Latvian Romania Slovakia Hungary Poland Czech Montenegro Croatia Bosnia and Herz. Slovenia N. Macedonia Norway USA Great Britain Finland South Korea. Italy Germany China Экспорт топлива, % от экспорта Fuel exports in groups of countries in 2018, % of merchandise exports Fig. 19. Fuel exports on the international market in 2019 in groups of countries. A logarithmic scale is applied at the horizontal axis. If we compare Russia's fuel exports on the inter- national market (52%) and the export of high-tech products in the export of industrial products (13%) (Fig. 12), then we can conclude that this is a raw coun- try with elements of high-tech development. Since Rus- sia is on the 2nd place in these two indicators, behind Kazakhstan among the FSU countries, and the fact that the decrease in the values of other FSU countries is ap- proximately the same in these cases, it can be con- cluded that other FSU countries are developing in the same direction as Russia, their main part of their in- come is fuel sales. The other part is developing on a smaller scale - high-tech sales. According to British Petroleum, oil consumption in 2019 was as follows (Fig. 19): FSU – 28.3 million tons, FWPB – 5.6 million tons, FUY – 2.3 million tons. According to the data of Table. 1 and Fig. 20 oil con- sumption in Russia (150.8 million tons) accounted for 26% of production, in the United States – 112.7%. This confirms that, unlike the United States, Russia is a typ- ical raw material country that sells most of the oil from production. For Kazakhstan, this value is equal to 17.3%, for Azerbaijan – 12.9%, which also indicates that these two countries are also raw materials.
  • 28. 28 Norwegian Journal of development of the International Science No 70/2021 150.8 15.8 10.1 7.5 7.1 4.9 2.1 10.6 9.9 8.5 5.1 3.9 3.2 1.8 1.5 3.3 2.5 1.1 173.6 106.9 72.4 8.9 8.9 841.8 650.1 1 10 100 1 000 Россия Казахстан Украина Беларусь Туркменистан Азербайджан Узбекистан Румыния Чехия Венгрия Болгария Словакия Литва Латвия Эстония Хорватия Словения С.Македония США Китай Япония Германия Франция Норвегия Финляндия Млн т Потребление нефти в группах стран в 2019 г., млн т Fig. 20. Oil consumption in groups of countries in 2019 according to British Petroleum (million tons). A logarithmic scale is applied at the horizontal axis. The extraction, processing and use of metals has historically always been a respected business in Russia. Data on the sale of ores and metals are shown in Fig. 21. Three groups of countries sold the following shares of their total exports in 2019: FSU – 11.05%, FWPB – 3.30%, FUY – 4.96%. The share of Russia was a con- siderable share – 6.17%. However, the maximum sale was in Armenia – 36.12%, Georgia – 17.66%, Kyrgyz- stan and Kazakhstan – 13.9%, Bulgaria – 12.78%. These countries significantly support their economies by selling metals. At the same time, high-income coun- tries sold significantly less – 3.68%, and the European Union – 2.64%. Therefore, from the fact that Armenia, Georgia and Kyrgyzstan have less high-tech exports than the average of the European Union, it can be con- cluded that the high-tech exports of these countries give them less benefit so far. Fig 21. Export of ores and metals by groups of countries in 2018, % of commodity exports Fig. 22 shows the export of food in groups of countries in 2019. Exports of the FSU countries amounted to 21.9%, FWPB – 11.6%, FUY – 11.6%. Among the countries of the FSU, the exports of only Russia and Kazakhstan were less than the European Union, we can conclude that for the rest of the countries
  • 29. Norwegian Journal of development of the International Science No 70/2021 29 of this group, food exports provide significant reve- nues. It should be noted that Moldova's exports amounted to 56.1% of the exports of goods, Georgia – 37.2%, and Armenia – 31.7%. We know that food ex- ports are a common form of existence for many coun- tries, but these three countries receive a significant part of their income in this way. Apparently, the same can be said about Lithuania, Latvia and Bulgaria, since they export high-tech products and sell ores and metals less than food. 56.1 37.2 31.7 16.2 12.8 10.1 5.8 5.6 20.8 17.3 15.7 13.3 10.3 8.0 4.2 3.6 14.2 9.4 6.9 4.4 9.8 7.8 12.5 12.4 9.3 8.9 6.7 5.4 2.6 1.5 1 10 100 Moldova Georgia Armenia Belarus Kyrgyzstan Uzbekistan Russia Kazakhstan Latvian Lithuania Bulgaria Poland Romania Hungary Czech Slovakia Croatia N. Macedonia Bosnia and Herz. Slovenia European Union High income Norway France USA Ireland Great Britain. Germany Finland S. Korea Percentage of merchandise exports Food exports in group of countries in 2019, % of merchandise exports Fig. 22. Food exports in groups of countries, % of exports of goods Let's consider commodity exports in groups of countries (Fig. 23). Russia among countries of 1991 is in the first place here. Note it is equals to 28.2% of Ger- many's exports. The second largest export country Po- land has 17.7%, the third-the Czech Republic has 13.4%. In general, other countries have much less ex- ports than Germany - for the FSU it is – 3.4% of its commodity exports, for the FWPB – 6.4% , for the FUY – 1.1%. These results indicate that each of the countries that came out of 1991 has a long way to go to turn into a truly developed country. 57 309 000 000 50 066 000 000 32 960 000 000 19 500 000 000 14 024 000 000 9 695 000 000 3 798 000 000 2 779 000 000 2 640 000 000 1 966 000 000 264 013 000 000 198 881 000 000 123 616 000 000 89 623 000 000 76 873 000 000 33 303 000 000 33 151 000 000 16 105 000 000 15 689 000 000 44 943 000 000 19 630 000 000 17 180 000 000 7 189 000 000 6 578 000 000 465 000 000 5 815 427 000 000 2 499 457 000 000 705 564 000 000 571 465 000 000 469 684 000 000 419 850 000 000 1 250 000 000 1 489 152 000 000 1 643 161 000 000 100 000.000 1 000 000.000 10 000 000.000 100 000 000.000 1 000 000 000.000 10 000 000 000.000 100 000 000 000.000 1 000 000 000 000.000 10 000 000 000 000.000 Russia Kazakhstan Ukraine Belarus Azerbaijan Uzbekistan Turkmenistan Georgia Moldova Armenia Kyrgyzstan Tajikistan Poland Czech Hungary Slovakia Romania Bulgaria Lithuania Estonia Latvian Slovenia Serbia Croatia N. Macedonia Bosnia and Montenegro Euro. Union China USA Germany Japan France Great Britain Percentage current US$ Exports of goods and services in groups of countries in 2019, current US$ Fig. 23. Merchandise exports in groups of countries in 2019, US dollars
  • 30. 30 Norwegian Journal of development of the International Science No 70/2021 7. Calculation of the integral development in- dex ID of the BBS, FWPB and FUY countries Our task is to calculate the integral index of devel- opment ID for the considered parameters. We introduce an integral index of the development of the countries of the FSUB, FWPB, and FYU, based on the use of the considered parameters. Here is a list of our groups of parameters and pa- rameters: Economy 1. GDP per capita, USD, 2019. 2. GDP growth rate, USD, 2019. 3. Electricity consumption, kW-hour per capita, 2014. Demographics 4. Current health care expenditures per capita in, PPP dollars, 2019. 5. Total death rate, , per 1000 deaths, 2018. 6. Life expectancy at birth( LE), years, 2019. 7. Probability of survival to 65 years, men, % of the cohort, 2019 8. Infant mortality, per 1,000 live births, 2019. 9. Maternal mortality, per 100,000 live births, 2017. 10. The difference in the number of LE women and men, years, 2019 11. The number of suicides, per 100,000, 2017. 12. Population aged 65 years and older, % of the total population, 2019. Technological and high-tech development 13. Exports of high-tech products, % of industrial exports, 2019. 14. Export of high-tech products, USD current, 2019. 15. Exports of goods to high-income countries, % of total exports of goods, 2019. 16. Foreign direct investment in groups of coun- tries, net inflow, % of GDP, 2019. 17. Computer and communication services, % of exports 2019. 18. Computer and communication services, % of imports, 2019. 19. Publication of papers in scientific and tech- nical journals, 2018. 20. Exports of manufacturing products, % of ex- ports of goods, 2019 Export of natural resources 21. Fuel exports, % of goods exports, 2019 22. Oil consumption, million tons, 2019, from British Petroleum. 23. Exports of ores and metals, % of exports of goods, 2019. 24. Exports of food, % of exports of goods 2019 25. Merchandise exports, current USD, 2019. The method of calculating the ID is based on the assumption that all parameters have equal importance. The rank method is used to calculate the index. All pa- rameters are divided into two types: 1) a larger value corresponds to a larger value from the range of values; 2) a larger value corresponds to a smaller value. In this setting, the ranks of all countries are calculated for each parameter used. Then for each country, from the ob- tained values the average ranks of all parameters are calculated. Then the ID index is calculated by follow- ing method: the obtained values are converted into an ordered rank sequence, so that rank 1 belongs to the best indicator in importance, and 27 belongs to the worst. When implementing on a computer, the Excel program is used, which allows to automatically take into account the lack of data. Then all the parameters are combined into the four groups used and the param- eters are converted again, but for each group of param- eters into its own rank sequence. It should be noted that due to the different number of parameters in each group, the sum of the ranks calculated for groups of pa- rameters are not equal to the rank for all parameters. The result of calculating the integral index of all the considered variables and indices for the four studied groups is presented in Table 2.
  • 31. Norwegian Journal of development of the International Science No 70/2021 31 Table 2. The Index of development (ID) of three groups of countres. The ranks for for each country and group are shown. The smaller the rank, the larger its the value. N Country Country Index ID Economy Demography Tech. and High Tech Developing Export of Natural Resources 1 Estonia 1 1 5 12 23 2 Czech 2 6 2 2 21 3 Slovenia 3 3 1 7 17 4 Slovakia 4 10 6 6 20 5 Hungary 5 3 10 1 16 6 Montenegro 6 9 3 17 7 Serbia 7 7 11 5 8 Russia 8 13 25 11 3 9 Northern Macedonia 9 18 8 9 19 10 Bosnia and Herzegovina. 10 18 8 19 13 11 Romania 11 10 14 4 12 12 Georgia 12 15 23 23 6 13 Lithuania 13 2 13 13 11 14 Tajikistan 14 24 17 27 15 Poland 15 3 7 3 15 16 Bulgaria 16 8 12 14 3 17 Croatia 17 14 4 15 9 18 Moldova 18 18 26 21 18 19 Kazakhstan 19 10 22 16 1 20 Belarus 19 21 19 20 8 21 Latvian 21 16 17 10 14 22 Azerbaijan 22 26 16 18 22 23 Kyrgyzstan 23 27 24 22 5 24 Armenia 24 17 15 24 1 25 Ukraine 25 22 27 8 26 Uzbekistan 26 25 20 25 9 27 Turkmenistan 27 23 21 26 7 We see that five top lines of the ID table are occu- pied by countries of FWPB - Estonia, Czech Republic, Slovenia, Slovakia, Hungary. The sixth and seventh places has got countries of FYU: Montenegro and Ser- bia. The best place from countries of FSU belongs to Russia which occupies the eighth line in the table. In addition the six bottom lines with numbers 22-27 in the table are occupied by the FSU countries – Kyrgyzstan, Armenia, Ukraine, Uzbekistan, Turkmenistan. From these facts it can be concluded that the FWPB is the best in the unofficial competition of groups of coun- tries. We can get more detailed data from fig. 24. So, in the FSU group, the section "Economy" the best place with 52 point belongs to FWPB, last one belong to FSU – 100 points. In section "Demography" best place is occupied by FYU with 53 points. Best in "Hi tech" is FWPB with 53 points. Best place in "Raw materials and Nature Resources have won both - FSU and FWPB. Fig. 24. Histogram of the ranks achieved by every group of countries. Each of column in four groups of sections shows the rank of one element of groups of countries. The higher the column, the lower its rank
  • 32. 32 Norwegian Journal of development of the International Science No 70/2021 8. Conclusion In conclusion, we can say that the countries of the former USSR, the Warsaw Pact and Yugoslavia have made significant progress in 30 years of independent life. They have more or less overcome the defects of the previous regime that existed before 1991. The countries of the former USSR achieved the least small success – both in economic development and in social life, which was in addition understood due analize of non-standard demographic parameters and socio-psychological dis- order that has manifested itself to a large extent in men- tioned three countries. At the same time, Russia has lost a lot – now it is looks like a good team of the second football league, we compare the success of it and other countries of the former USSR with the success of the former Warsaw Pact countries, which are ahead of it in majority of respects. However, they also have difficul- ties in development, and they all are still far from the first league – advanced developed countries. The for- mer countries of Yugoslavia, which have not yet fully recovered from the recent wars, are also striving for- ward and are in an intermediate state in terms of suc- cess. All countries have a desire to achieve more and are taking actions in moving forward. It is hoped that the efforts of these countries will be successful. The author has a pleasure to expresses gratitude to Anna Tarko for her help in carrying out computer cal- culations on for this article. REFERENCES: 1. Gamburtsev A. G., Andreev E. M., Tarko A.M., Aptikaeva O. I., Galichiy V. A., Gorbarenko E. V., Zaslavskaya P. M., Logvinenko S. I., Artyushov A. N., Nemtsov A.V., Sigachev A.V., Sidorenkov N. S., Stepanova S. I., Strelkov D. G., Chibisov S. M., Shcherban E. A. The influence of three environments on medical indicators. Experience of comparative anal- ysis. // Atlas of time variations of natural, anthropo- genic and social processes. Volume 5. Man and the three environments surrounding him. – M: Janus-K. 2013. pp. 326-414. 2. Baevsky R. M., Kudryavtseva V. I., Tarko A. M., Nikulina G. A., Polyakov B. I., Semenova T. D., Tazetdinov I. G., Experimental study of the possibility of predicting the reactions of the human body under certain extreme influences and functional loads. // Questions of cybernetics in physiological research. M., Publishing House of the USSR Academy of Sciences, Issue 22, 1976, pp. 38-53. 3. Moiseev N. N. The world community and the fate of Russia. Essays,. vol. 2, M., Publishing house of MNEPU, 1997, 269 P. 4. Pospelov I. G. Mathematical model of eco- nomic mechanisms of capitalist economy. // In the book: Methods of system analysis in the problems of rational use of resources, Moscow: Computing Center the USSR Academy of Sciences, 1977, pp. 18-116. 5. Tarko A.M. The reverse side of growth. Mod- ern structural economic crises and ways to overcome them. // Free thought. 2015. No. 5 (1653), pp. 81-94. 6. Tarko A.M. About the present and future of Russia and the world. – Tula. Publishing house Prompilot. – 2016 – – 196 P. 7. Tarko A.M. Twenty six years of development: What the countries of the USSR and the Warsaw Pact have achieved. - The Age of Globalization. Studies of modern global processes. 2018, No. 1, pp. 68-82. DOI: 10.30884/vglob/2018.01.07 8. Tarko A. M. Application of the integral index for the analysis of the economic and social develop- ment of Russia. // Norwegian journal of development of the international science. Publishing House: Global Science Center LP. ISSN: 3453-9875, No 43, Vol. 2, 2020 pp. 3-22. 9. Tikhonova N. E. Changing the socio-psycho- logical state of Russian society. // Twenty years of re- forms through the eyes of Russians: the experience of many years of sociological measurements. // Edited by M. K. Gorshkov, R. Krumma, V. V. Petukhov. – M. The Whole world, 2011. pp. 55-76. 10. Federal State Statistics Service (ROSSTAT). (2021). Unified Interdepartmental Information and Sta- tistical System (EMISS) Electronic resource] http://www.gks.ru (accessed: 20.05.2021) 11. Chumakov A. N., Stychinsky M. S. Cultural and civilization dialogue and its possibilities in the con- ditions of the global world. // The Age of Globalization: No. 1, 2018 pp. 3-13. 12. Expert. - 2010. - No. 1 (Special issue). 13. Statistical Review of World Energy. (2021). [Electronic resource] http://www.bp.com/statisticalre- view (accessed: 20.07.2021) 1 14. World Bank Open Data. (2021). World Devel- opment Indicators. [Electronic resource] https://data- bank.worldbank.org/data/home.aspx (accessed: 11.08.2021)