Module 3 Targeted Practice Summarizing EDA insights
•Download as DOCX, PDF•
0 likes•4 views
The document provides instructions for an assignment to create a PowerPoint deck summarizing key insights from an exploratory data analysis in a visually engaging way. The deck must include 5-7 insight slides highlighting important findings, an executive summary slide, and follow specific formatting and design requirements to minimize clutter and focus the audience's attention. The deck will be shared with the COO to help focus her attention on the most important components of the analysis in less than 10 minutes.
Report
Share
Report
Share

Recommended
Recommended
More Related Content
Similar to Module 3 Targeted Practice Summarizing EDA insights
Similar to Module 3 Targeted Practice Summarizing EDA insights (14)
CIS 498 Effective Communication - snaptutorial.com
CIS 498 Effective Communication - snaptutorial.com
Project Deliverable 1 TemplateProject Plan InceptionProject .docx
Project Deliverable 1 TemplateProject Plan InceptionProject .docx
CIS 518 STUDY Achievement Education--cis518study.com
CIS 518 STUDY Achievement Education--cis518study.com
CIS 518 STUDY Introduction Education--cis518study.com
CIS 518 STUDY Introduction Education--cis518study.com
CIS 518 STUDY Redefined Education--cis518study.com
CIS 518 STUDY Redefined Education--cis518study.com
CIS8000 Global Information Systems StrategyAssignment 2Assig.docx
CIS8000 Global Information Systems StrategyAssignment 2Assig.docx
More from MoseStaton39
More from MoseStaton39 (20)
(U) WHAT INSIGHTS ARE DERIVED FROM OPERATION ANACONDA IN REGARDS T
(U) WHAT INSIGHTS ARE DERIVED FROM OPERATION ANACONDA IN REGARDS T
(This is provided as an example of the paper layout and spac
(This is provided as an example of the paper layout and spac
(Student Name)Date of EncounterPreceptorClinical SiteCl
(Student Name)Date of EncounterPreceptorClinical SiteCl
(TITLE)Sung Woo ParkInternational American UniversityFIN
(TITLE)Sung Woo ParkInternational American UniversityFIN
(Student Name) UniversityDate of EncounterPreceptorClini
(Student Name) UniversityDate of EncounterPreceptorClini
(Student Name)Miami Regional UniversityDate of Encounter
(Student Name)Miami Regional UniversityDate of Encounter
(Student Name)Miami Regional UniversityDate of EncounterP
(Student Name)Miami Regional UniversityDate of EncounterP
(Monica)Gender rarely shapes individual experience in isolation bu
(Monica)Gender rarely shapes individual experience in isolation bu
(Monica) A summary of my decision-making process starts with flipp
(Monica) A summary of my decision-making process starts with flipp
(Note This case study is based on many actual cases. All the name
(Note This case study is based on many actual cases. All the name
(Minimum 175 words)In your own words, explain class conflict the
(Minimum 175 words)In your own words, explain class conflict the
(Individuals With Disabilities Act Transformation Over the Years)D
(Individuals With Disabilities Act Transformation Over the Years)D
(Kaitlyn)To be very honest I know next to nothing about mythology,
(Kaitlyn)To be very honest I know next to nothing about mythology,
(Harry)Dante’s Inferno is the first of the three-part epic poem, D
(Harry)Dante’s Inferno is the first of the three-part epic poem, D
(Lucious)Many steps in the systems development process may cause a
(Lucious)Many steps in the systems development process may cause a
(Eric)Technology always seems simple when it works and it is when
(Eric)Technology always seems simple when it works and it is when
(ELI)At the time when I first had to take a sociology class in hig
(ELI)At the time when I first had to take a sociology class in hig
(Click icon for citation) Theme Approaches to History
(Click icon for citation) Theme Approaches to History
(Executive Summary)MedStar Health Inc, a leader in the healthc
(Executive Summary)MedStar Health Inc, a leader in the healthc
Recently uploaded
This presentation was provided by William Mattingly of the Smithsonian Institution, during the third segment of the NISO training series "AI & Prompt Design." Session Three: Beginning Conversations, was held on April 18, 2024.Mattingly "AI & Prompt Design: The Basics of Prompt Design"
Mattingly "AI & Prompt Design: The Basics of Prompt Design"National Information Standards Organization (NISO)
God is a creative God Gen 1:1. All that He created was “good”, could also be translated “beautiful”. God created man in His own image Gen 1:27. Maths helps us discover the beauty that God has created in His world and, in turn, create beautiful designs to serve and enrich the lives of others.
Explore beautiful and ugly buildings. Mathematics helps us create beautiful d...
Explore beautiful and ugly buildings. Mathematics helps us create beautiful d...christianmathematics
Mehran University Newsletter is a Quarterly Publication from Public Relations OfficeMehran University Newsletter Vol-X, Issue-I, 2024
Mehran University Newsletter Vol-X, Issue-I, 2024Mehran University of Engineering & Technology, Jamshoro
Recently uploaded (20)
Seal of Good Local Governance (SGLG) 2024Final.pptx
Seal of Good Local Governance (SGLG) 2024Final.pptx
Mattingly "AI & Prompt Design: The Basics of Prompt Design"
Mattingly "AI & Prompt Design: The Basics of Prompt Design"
ICT Role in 21st Century Education & its Challenges.pptx
ICT Role in 21st Century Education & its Challenges.pptx
Measures of Dispersion and Variability: Range, QD, AD and SD
Measures of Dispersion and Variability: Range, QD, AD and SD
Explore beautiful and ugly buildings. Mathematics helps us create beautiful d...
Explore beautiful and ugly buildings. Mathematics helps us create beautiful d...
SECOND SEMESTER TOPIC COVERAGE SY 2023-2024 Trends, Networks, and Critical Th...
SECOND SEMESTER TOPIC COVERAGE SY 2023-2024 Trends, Networks, and Critical Th...
Unit-V; Pricing (Pharma Marketing Management).pptx
Unit-V; Pricing (Pharma Marketing Management).pptx
Measures of Central Tendency: Mean, Median and Mode
Measures of Central Tendency: Mean, Median and Mode
Basic Civil Engineering first year Notes- Chapter 4 Building.pptx
Basic Civil Engineering first year Notes- Chapter 4 Building.pptx
Ecological Succession. ( ECOSYSTEM, B. Pharmacy, 1st Year, Sem-II, Environmen...
Ecological Succession. ( ECOSYSTEM, B. Pharmacy, 1st Year, Sem-II, Environmen...
Module 3 Targeted Practice Summarizing EDA insights
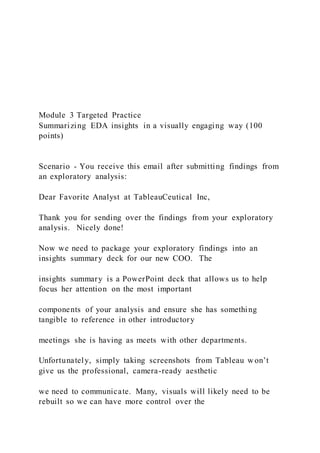
- 1. Module 3 Targeted Practice Summarizing EDA insights in a visually engaging way (100 points) Scenario - You receive this email after submitting findings from an exploratory analysis: Dear Favorite Analyst at TableauCeutical Inc, Thank you for sending over the findings from your exploratory analysis. Nicely done! Now we need to package your exploratory findings into an insights summary deck for our new COO. The insights summary is a PowerPoint deck that allows us to help focus her attention on the most important components of your analysis and ensure she has something tangible to reference in other introductory meetings she is having as meets with other departments. Unfortunately, simply taking screenshots from Tableau w on’t give us the professional, camera-ready aesthetic we need to communicate. Many, visuals will likely need to be rebuilt so we can have more control over the
- 2. final look. We’ll want to add text annotations to further explain what the visual is communicating, but without making our COO digest whole paragraphs. As you can imagine, COOs have more demands on their time and attention they have hours in the day, so we’ll need to make sure she has the most important information served up in a simple, clean, and concise way. She needs to be able to consume the insights in less than 10 minutes, so we’ll need to be deliberate about what we highlight, what we deemphasize, and how it flows. If the summary insights go over well, I wouldn’t be surprised if she asks us to build a dashboard for her in the next week or two (Module 5) so she can have the information she needs at her fingertips. As you build the deck, please review the assignment objectives, requirements, and submission expectations below. They are pretty details, but much of credibility stems from following directions. Please send the slide deck (PowerPoint or Google Slides) along with the packaged Tableau workbook from last week by the end of week (11:59 pm CT on Sunday). PDFs and unpackaged Tableau workbooks won’t be accepted.
- 3. Thank you again for your help! Sincerely, Lack of Context Leonard Visually Communicating Insights Assignment Objectives: I. Demonstrate you can minimize unnecessary cognitive load by a. using consistent formatting (punctuation yes or no, font size, color, annotation methods, spacing, indentation, etc.) b. eliminating clutter (chart borders, gridlines, data markers, clean-up axis labels, labeling data directly instead of legends & matching color, non-strategic use of contrast, etc). c. eliminate distractions (misalignments, blurry pictures, unnecessary complexity, wordy, etc.) II. Demonstrate that you can focus your audience’s attention by a. Creating a visual hierarchy to follow
- 4. b. Leveraging pre-attentive attributes in your graphics (orientation, shapes, line length, line width, size, curvature, added marks, enclosure, hue, color intensity, special position, motion, etc.) c. Leveraging pre-attentive attributes in your text (color, size, case, outline/enclosure, bold, italics, spatial separation, underline/added marks). III. Demonstrate that you can communicate insights by combining visual elements with concise text and annotation. Dataset to use for practice assignment (located in Canvas): M2_PracticeChallenge_SuperDrug Leverage exploratory findings from TableauCeutical Assignment from Module 2 Assignment Requirements 1. Set-up an aesthetically pleasing PowerPoint (or Google Slides) deck that contains a title page, executive summary, insights slides, and an appendix (10 points) a. Title page must look different than content pages and must contain a title, your name, course section title, and term. b. Executive summary is to be no longer than 1 page
- 5. c. Minimum of 5, but no more than 7 insight slides d. Appendix section must be clearly labeled using a slide the looks different than your insights slides and similar to, but not the same as your title slide. e. Appendix slides are not required, but you are allowed up to 3 appendix slides. f. Max size of 13 slides; title page (1), executive summary (1), insight slides (7), appendix cover (1), appendix slides (3). g. Saved you deck as FirstName_LastName_MPractice_InsightsSummary.pptx h. PDFs will not be accepted. 2. Executive Summary Slide (10 points) a. Summarize the key findings from each of the 5-7 insight slides on one page in bullet point form with no visuals. b. Leverage pre-attentive attributes in your bullet points
- 6. (assignment objective II.c) c. Provide details about the dataset, methodology, & assumptions, as footnotes (data dates, calculations, records not used because they weren’t clean/complete, etc). d. Executive summary is to be no more than 1 page. 3. Insight Slides (60 points) a. Minimum of 5, but no more than 7 insights slides b. Insight slides must contain a headline statement that communicates the most important thing the reader should take- away from the slide (in case they’re skimming it) c. Communicate insights discovered in your Module 2 exploratory analysis in a clear, concise, and visually engaging way. d. Use pre-attentive attributes to call attention to the insights displayed in your visuals while deemphasizing or eliminating clutter (assignment objective II.b) e. No more than 3 visuals can be copied and pasted from Tableau, rebuild the visual in PowerPoint so pre-attentive attributes can be leveraged. f. Use text annotations to enhance your visual by adding context, communicating findings, connecting the dots to other
- 7. findings on other pages, etc. g. Ensure the reader can understand the structure of your visual by labeling axes and communicating the data being graphed. This can be in a sub header or as a chart title. h. At least 2 slides should contain more than 1 visual from your exploratory analysis (you built 10 exploratory visuals, but are only allowed 7 insight slides so it’s good to practice fitting more than one visual onto a page without overwhelming the reader). i. Provide details about the insight, methodology, & assumptions, as footnotes (data dates, formulas, records not used because they weren’t clean/complete, etc). j. Insight slides should have similar theme, but not have the exact same structure from page to page. I.e. font size, color choice, how insights are highlighted, etc. should be consistent. However, don’t always put the chart on the left and the text on the right or the chart on top and the text below. Don’t always have just one graphic with bullet points. 4. General Aesthetics & Content Flow (20 points) a. Ensure the deck is free of grammar, spelling, alignment, and formatting issues.
- 8. b. Ensure the deck flows naturally from topic to topic (don’t summarize one topic go on to another then come back to a previous topic, etc). c. Ensure the deck is free of inconsistent theming (assignment objective I.a) Submission Requirements Upload the following to Canvas by 11:59 pm CT on Sunday, June 20. 1. PowerPoint deck as titled in Assignment Requirement 1 2. Packaged Tableau workbook from Module 2 (so final visuals can be compared to exploratory visuals). Assets Cash $ 500 Machinery and equipment 14,500 Suppliers 24,000 Hugues Légaré – Capital 36,000 $ 75,000 Liabilities and equity Unused parts and supplies $ 32,000 Customers 25,500 Prepaid rents 2,500 Bank loan 15,000 $ 75,000
- 9. Home work 1.Hugues Légaré started operating an auto repair shop in early November. An inexperienced clerk prepared the following report as at November 30, 2018. Work to do 1.1 Draw up the corrected balance sheet if you disagree with this presentation. Scenario 2 Lucie Belloeuil, optician, opened a clinic on October 1, 2018 by investing $ 8,000 in cash. Ms. Belloeuil was disappointed with the following financial statements, prepared by the bookkeeper.
- 10. LUCIE BELLOEUIL, OPTICIAN BALANCE SHEET OCTOBER 30, 2019 A Cash $ 1350 Prepaid rents 1,200 Medical supplies used 700 Material 22,800 $ 26,050 Equity Bank loan $ 12,000 Lucie Belloeuil - Capital 14,050 ______ $ 26,050 LUCIE BELLOEUIL, OPTICIAN Status of the results OCTOBER 30, 2019 Exploitation product Fees earned $ 10,000. Customers 2,450 Total products 12,450 Exploitation charges
- 11. Salaries 2,300 Rent 1,200 Unused medical supplies 5,000 Phone 200 Suppliers 4000 Total operating expenses 12,700 Net loss $ 250
- 12. In order to ensure the validity of these financial statements, Ms. Belloeuil asks you to review them. Work to do 2.1 Draw up the corrected balance sheet and financial statement of Ms. Lucie Belloeuil, optician.