1. Morgan Hamer ∙ May 2014
1
WILMORE ARTIST STUDIOS
FEASIBILITY REPORT
INTRODUCTION
The purpose of this site feasibility study is to evaluate the viability of converting an
existing warehouse into artist studio rental units with an attached gallery space. The facility
will contain 41 individual studios ranging from 300 to 1,500 square feet. The gallery will be
open to the public and feature resident artists’ work. The warehouse is located at 2213 Toomey
Avenue in the Wilmore neighborhood, two miles south-west of Uptown Charlotte, in the center
of Mecklenburg County (Map 1 & Map 2). It is positioned within a mile of the Remount Rd exit
on I-77, and a block away from Tremont Ave. and South Tryon St. The warehouse is
approximately 29,925 square feet on a 2.09 acre lot. The current asking price for the property
is $725,000.
The optimal locations of artist studios and fine art galleries are in culturally established,
diverse, and affordable neighborhoods and communities within proximity of the city center.
Older industrial and retail buildings provide an ideal location for studios due to their large
amount of available space, unique architecture, and the relatively inexpensive cost of
renovation and conversion into studio spaces. Locations that are within a reasonable commute
or walking distance of cultural attractions--restaurants and bars, other studios and galleries,
music venues, museums, theaters—often generate the traffic and exposure necessary to
sustain art studios and galleries. While surrounding galleries and studios generate traffic, they
may also act as competition.
The primary customers are the artists renting the studio spaces, and secondary
customers are the gallery visitors and art purchasers. The renters will be drawn from
surrounding Charlotte neighborhoods, and visitors will be primarily those who are patrons of
galleries and near-by attractions in Historic SouthEnd. IBIS World identifies some of the key
economic drivers for independent artists and consumers of art which include households
earning over $100,000/year, high rates of population growth, educational attainment, and per
capita disposable income. The presence of colleges and universities also indicates demand for
art and artists in a given market area.
2. Morgan Hamer ∙ May 2014
2
MAP 1: SITE LOCATION
GOALS
There are multiple goals for converting the existing warehouse into studios and
a gallery. The primary goal is to provide functional, affordable studio spaces for local
artists specializing in fine arts including painting, drawing, sculpting, printmaking, and
mixed media. Additionally, the purpose of this project is to create an environment that
facilitates and promotes creativity, community interaction, and collaboration among
the resident artists, as well as visitors from the greater Charlotte area. The secondary
goal is to create a gallery and viewing space open to the public where tenants and
outside artists may display and sell their work. The art displayed at the gallery will be
from the resident artists, and a standard, thirty (30) percent commission of all sales
will go to the studio.
3. Morgan Hamer ∙ May 2014
3
MAP 2: SITE LOCATION IN MECKLENBURG COUNTY
4. Morgan Hamer ∙ May 2014
4
CONSUMER PROFILE
The primary consumers of artist studio spaces are artists who specialize in different
mediums ranging from painting and graphic design to sculpture and installation. Artists will be
drawn from a variety of sources in the Charlotte area: professors, students, and graduates from
surrounding colleges and universities including UNC Charlotte, Charlotte Art Institute, Central
Piedmont Community College, and Queens University; residents of SouthEnd and near-by
bohemian art districts; and those already established artists in the surrounding communities.
There is no definitive profile for artists due to a variety of reasons. First, artists specialize
in an array of media ranging from traditional fine art, such as painting and sculpture, to more
contemporary work such as installation and graphic design. Second, artists come from various
backgrounds; some artists have little or no training, while others have completed high levels of
formal training. Third, sales of artwork may not be an artist’s primary income, creating
challenges when trying to use US Census data to assess the number of artists in a population.
Very few studio artists within the industry are able to support themselves financially with
consistent work and many are forced to find employment in other industries, such as retail,
education, or the service industry, to supplement their income (IBIS World, 2013).
GALLERY VISITOR AND BUYERS
Secondly, customers will be the patrons and visitors of the galleries within the trade
area. Gallery visitors come from a variety of sources in the Charlotte area. Because of the site’s
proximity to SouthEnd, a significant amount of visitors will be from those visiting restaurants,
bars, and other galleries nearby. Additional traffic will be generated by the monthly
studio/gallery crawl in SouthEnd. Art collectors and interior designers from the surrounding
market are also secondary customers.
APPRAISAL
Three recent sales of three properties within a mile of the site were identified as
comparable to the subject property. Each property evaluated is a warehouse sold in 2013. They
were each built within seven (7) years of the subject, which was constructed in 1969. The
average lot size of the three properties is 0.96 acres, which is significantly smaller than the
subject’s 2.09 acre lot. The average price per square foot in the selling price of these properties
was $27.44 per square foot (Table 1). The asking price of the property is currently $725,000,
which equals $24.23 per square foot. Given the average cost per square foot of the recent
comparable sales, the site would be valued at $821,142.
5. Morgan Hamer ∙ May 2014
5
TABLE 1: COMPARABLE SALES
Parcel
Address
Sale Date Sale Price Square
Feet
Price per
Square
foot
Zoning Year
built
Land Area (acres)
2000
Hawkins St.
3/21/2013 $750,000 28,400 $26.41 TOD-M 1962 1.03
3115 Griffith
St.
11/26/2013 $595,000 25,590 $23.25 I-2 1964 1.02
2250
Toomey Ave.
1/10/2013 $467,000 14.300 $32.66 I-1 1972 0.82
Average $27.44 0.96 acres
Source: Polaris 2014
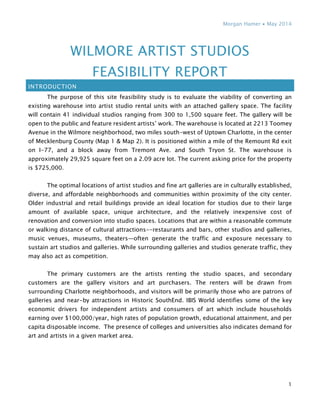
IMAGE 1: EXISTING STRUCTURE
Source: LoopNet
6. Morgan Hamer ∙ May 2014
6
MARKET ANALYSIS
CHARLOTTE MARKET
The site is located in the center of the Charlotte-Concord-Gastonia, NC-SC Metropolitan
Statistical Area consisting of ten counties as of 2013 according to the US Census Bureau. These
include Cabarrus County, NC; Gaston County, NC; Iredell County, NC; Lincoln County, NC;
Mecklenburg County, NC; Rowan County, NC; Union County, NC; Chester County, SC; Lancaster
County, SC; and York County, SC. 274 of the Fortune 500 companies have facilities in there,
eight of which are headquartered in Charlotte, ranking Charlotte sixth nationally in the number
of headquartered firms (Charlotte Chamber of Commerce, 2012). In addition, the MSA is home
to a multitude of colleges and universities including the Art Institute of Charlotte, Central
Piedmont Community College, UNC Charlotte, Davidson College, Johnson and Wales University,
and Pfeiffer University.
The primary city, Charlotte, NC, has undergone substantial growth for artists and
creative industries over the past decade. There are several colleges and universities with
prestigious Fine Art programs that offer BFA and MFA programs in the market area. The growth
of this artist community creates a growing demand for affordable studio space. The addition
of three large-scale, internationally-recognized art museums in uptown Charlotte—the Bechtler
Museum of Fine Art, The Light Factory, and The Mint Museum-- is a reflection the city’s growing
cultural presence. Charlotte is also home to the McColl center, an artist residency program
which hosts prominent artists from all over the world.
According to the 2012 Creative Vitality Index (CVI), the total employment of fine artists
including Painters, Sculptors, and Illustrators rose from 351 in 2011 to 589 in 2012, a 68%
change. In Mecklenburg County alone, there was an estimated total of 271 fine artists in 2012,
growing 46% since the previous year. The CVI measures a carefully selected set of economic
inputs related to the arts and creativity in a given geographic area, with measurements of both
for-profit and non-profit arts-related activities. The index has two major components including
measurements of community participation based on per capita revenues of arts-related goods
and services, and measurements of per capita occupational employment in the arts using data
from the US Census Bureau and Bureau of Labor Statistics.
The number of artist studios and galleries is continually fluctuating in the Charlotte MSA.
As different neighborhoods have undergone notable gentrification, increases in rent and
affordability have forced many of these tenants out. Consequently, small-scale studios and
galleries have appeared in some Charlotte’s smaller outlying cities, such as Concord and Rock
Hill, as these places have made attempts to rejuvenate vacant down-town spaces and improve
their city’s image.
7. Morgan Hamer ∙ May 2014
7
MAP 3: CHARLOTTE-CONCORD-GASTONIA, NC-SC MSA (2013)
Source: STDB and ESRI
There are only four comparable artist-studio locations identified in the Charlotte MSA.
In order to be considered comparable, the facility must have six or more rentable studio units
and include a gallery where resident or outside artists may display their work to the public. The
number of rental units is significant due to the benefits from agglomeration for artist
communities. These benefits include networking opportunities, creative inputs, sharing of tools
and materials, among many others. Indirect competitors include smaller-scale studio rental
properties, independent artist studios and galleries, and other art galleries. There is not
definitive data available both direct and indirect competition, however through Facebook,
Google search, Yellow Pages, and word-of-mouth, these locations were identified (Table 2).
Given my experience in the artist community in the market area over the past decade, I believe
my findings are accurate.
8. Morgan Hamer ∙ May 2014
8
TABLE 2: DIRECT COMPETITORS
# OF
RENTAL
UNITS
UNIT SIZE
RANGE
(SF)
RENT
PER SF
RENT RANGE LOCATION
ARTS COUNCIL
OF YORK
COUNTY
26 202-
1,400
$0.32 $135-$395 121 E. Main Street
Rock Hill, SC
X-FOUNDATION 7 300-500 $1 $300-$500 1900 N. Brevard St.
Charlotte, NC 28206
HART WITZEN 18 200-600 $1 N/A 136 E. 36th St.
Charlotte, NC 28206
CHARLOTTE
ARTS LEAGUE
17 50-300 N/A $68-$300 1517 Camden Road
Charlotte, NC 2820
Source: Collected by Author, March 2014
The majority of competitors are located within three miles of the city center (Map 4). All
have no vacant studio spaces available at this time. The first competitor identified is the X-
Foundation, housing seven working studios and Mona Gallery. It is located in the outskirts of
the NoDa neighborhood in a renovated warehouse. The owners of the X-Foundation came to
the North Davidson neighborhood in the mid 1980’s and purchased a block of vacant shops,
eventually creating a community of artist studios and galleries. As popularity increased in
NoDa’s art district, rents increased and those studios have all relocated to the outskirts of the
neighborhood and elsewhere. The Hart Witzen Gallery and Studio, also situated just outside of
the center NoDa, is another direct competitor located in a restored industrial building. Hart
Witzen is a privately owned, self-sustaining arts venue supported through rental of the gallery
and artist studios allowing it to function as an independent alternative arts space. Both Hart
Witzen and the X-Foundation also rent out space in their facilities for private events such as
meetings and weddings and feature work in their gallery by significant artists from all over the
world.
The third competitor identified is the Charlotte Arts League, a non-profit organization
featuring studios and a gallery located in the SouthEnd neighborhood. The final competitor is
Arts Council of York County’s Center for the Arts, centrally located in historic Old Town Rock
Hill, South Carolina. The Arts Council is a non-profit arts anchor on three blocks of Main Street,
housed in two 100-year-old buildings. It is currently home to the Arts Council offices,
classroom space, artist studios and three gallery spaces.
9. Morgan Hamer ∙ May 2014
9
MAP 4: MAP OF DIRECT COMPETITION IN MARKET AREA
Source: Google Maps
COMPARABLE MARKETS
The Charlotte-Concord-Gastonia Metropolitan Statistical Area is contrasted with to two
comparable market areas-- Winston-Salem, NC MSA and Greenville-Mauldin-Easley MSA-- to
determine the level of demand for an artist studio space in the Charlotte market area (Map 5).
These market areas were selected for several similarities with the Charlotte MSA: first, the
locations of similar studio facilities are close to, or within, historic districts close to the city-
center that have undergone notable gentrification; second, the locations of similar studio
facilities are in buildings that have been appropriated or converted into artist studio space;
Hart-Witzen
X-Foundation
Charlotte
Arts League
Site
Arts Council of
York County
10. Morgan Hamer ∙ May 2014
10
third, each market area contains several colleges and universities where artists may be sourced;
finally, each of the market areas are located in the South East and have not yet achieved
international recognition for artists or a fine art presentence.
MAP 5: REGIONAL MAP OF COMPARABLE MARKETS
WINSTON-SALEM, NC MSA
The Winston-Salem, NC MSA contains Davidson County, Davie County, Forsyth County,
Stokes County, and Yadkin County (Map 6). The primary city is Winston-Salem, where the two
comparable artist studios identified are located. This MSA is home to several prominent
colleges and universities, including Wake Forest University and the University of North Carolina
School of the Arts. Winston-Salem, like Charlotte, is home to several corporate headquarters
including BB&T, Lowes Food, and Reynolds American. It is also home to several companies in
the fast-growing medical research and has been designated as the Piedmont Triad Research
Park for biomedical and information technology research and development.
11. Morgan Hamer ∙ May 2014
11
MAP 6: WINSTON-SALEM, NC MSA
Source: STDB and ESRI
GREENVILLE-ANDERSON-MAULDIN, SC MSA
The Greenville-Anderson-Mauldin, SC MSA is the largest MSA in SC containing Anderson
County, Greenville County, Laurens County, and Pickens County (Map 7). Downtown Greenville,
the primary city in this MSA has undergone significant urban renewal in past decades, creating
an inviting atmosphere for creative class individuals. This is where the three comparable studios
are located.
12. Morgan Hamer ∙ May 2014
12
MAP 7: GREENVILLE-ANDERSON-MAULDIN, SC MSA
Source: STDB and ESRI
CURRENT AND FUTURE DEMAND
There are few ways to measure the number of artists in a population. This is due in part
to a lack of data, and also because artist’s primary income may be from other forms of
employment. Because art is a luxury instead of a necessity, the surrounding market area must
have the economic means for purchasing art work in order to create a sustainable environment
for artists to create and sell work. IBIS World identifies some of the key economic drivers for
independent artists and consumers of art that include households earning over $100,000/year,
high population growth rates, high educational attainment, and per capita disposable income.
The presence of Colleges and Universities also indicate demand for art and artists in a given
market area.
13. Morgan Hamer ∙ May 2014
13
MARKET POTENTIAL
In order to gauge the existing artistic and cultural community in the Charlotte MSA,
cultural indicators in each trade area are compared. According to ArtPlace America--a
collaboration among 14 foundations, 8 federal agencies, and 6 financial institutions dedicated
to strengthening the field of creative place-making-- there a several variables that indicate the
cultural vibrancy and feasibility of creative development in a given location. Some of these
relevant creative indicators from each market area have been assessed and compared. These
include the percentage of workers creative occupations, the percentage of creative
establishments, and the percentage of independent, creative businesses in each MSA. (Table
3). This employment information for each of the Metropolitan Statistical Areas was collected by
the US Census Bureau in the 2011 MSA Business Patterns. The Nonemployer data for the
number of independent artists, writers, and performers originate from tax return information
of the Internal Revenue Service and was also provided in the 2011 Nonemployer Statistics from
the US Census Bureau. This data may not account for the total number of artists in each market
area if resident artists no not declare their trade as their primary form of employment.
TABLE 3: VIBRANCY INDICATORS WITHIN MARKET AREAS
Charlotte Greenville Winston Average
Total # Paid Employees 736,199 249,787 181,219
Paid Employees
Arts, entertainment & recreation
17,545 3,534 2,176
% of total paid employees 2.38 % 1.41 % 1.2 % 1.66 %
Charlotte Greenville Winston Average
Total # Establishments 43,955 14,950 10,158
Total Establishments
Arts, entertainment & recreation
673 207 162
% of total establishments 1.53 % 1.38 % 1.59 % 1.5 %
Charlotte Greenville Winston Average
Total Population 1,795,472 647,401 482,025
Total # Non Employer
establishments: Independent artists,
writers, and performers
3,675 1,055 991
% Non-Employer establishments:
Independent artists, writers, and
performers total population
0.20 % 0.16% 0.21% .19%
Source: US Census Bureau 2011 Non-employer Statistics and MSA Business Patterns
14. Morgan Hamer ∙ May 2014
14
The comparisons reveal that the Charlotte market ranks above average among the three
market areas for cultural vibrancy (Table 3). The percentage of paid employees in arts,
entertainment, and recreation in the Charlotte market far exceeds those in the Greenville and
Winston Salem MSAs. Additionally, the percentage of establishments in the arts, entertainment,
and recreation categories, along with the percent of nonemployer establishments who are
independent artists, writers, and performers within the Charlotte MSA exceeds the average of
the three MSAs.
Additional demographic factors are considered within each MSA (Table 4). According to
Esri’s 2013-2018 Demographic Updates, the population growth projection ranks highest in the
Charlotte-Gastonia-Concord MSA, and lowest in the Winston-Salem MSA. Population growth is
a key factor in predicting the cultural vibrancy of a market and trade area, and is indicative of
other underlying trends that create a favorable atmosphere for artists and art collectors
including employment growth and cultural diversity. In addition, the Charlotte-Concord-
Gastonia MSA ranks highest in income and income growth projections of the three comparable
market areas, according to Esri’s growth model.
Esri’s population predictions for 2000 to 2010 were relatively accurate, and with
improvements in technology, data sources, and modeling, the 2013/2018 population estimates
appear to provide a reliable growth forecast. Esri’s 2013/2018 population predictions are
created by current population change by block group from three primary sources: Experian, the
US Postal Service (USPS), and Metrostudy, in addition to several ancillary sources. Metrostudy
provides information on new and planned residential construction in the top US housing
markets. This database identifies individual construction projects by location by evaluating: 1)
Inventory of units under construction, sold, and/or closed; 2) types of housing—detached
homes, townhomes, condominiums, etc.; and 3) target markets such as families, seniors, and
empty nesters.
Esri's income forecast base is the income that was reported in the 2007–2011
American Community Survey. Esri evaluates an extensive list of sources for household income
trends that includes both federal and proprietary sources. The review of national surveys
includes the Bureau of Economic Analysis's local personal income series, the Current
Population Survey, and the Bureau of Labor Statistics’ Consumer Price Index. Esri's updates
emphasize the use of time series data from household surveys to establish a base trend line
(Esri, 2013).
15. Morgan Hamer ∙ May 2014
15
TABLE 4: DEMOGRAPHIC PROFILE IN MARKETS
Charlotte Greenville Winston-Salem
Population 2013 Est. Population 2,302,347 850,047 650,711
2018 Est. Population 2,465,303 893,643 669,585
2013-2018 Annual Rate 1.38% 1.01% 0.57%
Income 2013 Median HHI $50,909 $43,225 $43,942
2018 Median HHI $58,008 $51,871 $52,529
2013 Avg. HHI $71,376 $60,444 $60,869
2018 Avg. HHI $82,844 $71,217 $69,870
2013 Average Disposable
Income
$52,902 $47,585 $46,374
2013 Median Disposable
Income
$40,884 $36,827 $36,495
2013 HHI > $100,000/yr 19.3 % 14.3 % 14.1%
2018 Average HHI >
$100,000
22.6 % 17 % 16.9%
2013
Population
25+
High School Graduate 25.7% 29.4% 31.5%
by Educational
Attainment
Some College, No Degree 21.5% 19.5% 20.3%
Bachelors, Graduate, and
Professional Degree
30.3 % 25.5% 24.4%
Data Note: Disposable Income is after-tax household income. Disposable income forecasts are based on the Current
Population Survey, U.S. Census Bureau. Detail may not sum to totals due to rounding.
Data Note: Income reported for July 1, 2018 represents annual income for the preceding year, expressed in current
(2017) dollars, including an adjustment for inflation.
Income Source: U.S. Census Bureau, Census 2010 Summary File 1. Esri forecasts for 2013 and 2018.
Education Source: U.S. Census Bureau, Census 2010 Summary File 1. Esri forecasts for 2013 and 2018. Esri converted
Census 2000 data into 2010 geography.
16. Morgan Hamer ∙ May 2014
16
The Charlotte MSA ranks well above Greenville and Winston Salem as a suitable market
for sustaining creative industries. The presence of households making over $100,000 a year
was identified as an important factor in a sustainable market for artists, and the Charlotte MSA
leads the other market areas in current (19.3%) and future estimates (22.8%). Charlotte’s
population growth was estimated at 1.38% by Esri’s growth forecast, which was higher than the
other market areas. Additionally, the educational attainment levels in the Charlotte MSA were
higher than Greenville and Winston-Salem.
MARKET PENETRATION
To assess the current demand for an artist-studio in the Charlotte market, the number
of studios per creative employee is assessed in each market area MSA. The closest measure of
the number of artists within a given MSA was the number of employed independent artist,
writers, and performers reported to the US Census Bureau in 2011 (Table 5). The number of
creative employees and total population is compared with the total number of studio rentals in
each market area, revealing far Charlotte exceeds the average for numbers of creative
employees and total population per studio rental facility. The average is approximately 22
creative employees per studio rental facility and 394,764 total people per studio rental facility.
If the proportion of Charlotte’s artist-studio facilities matched the average of those in the three
market areas, according to the number of creative employees, Charlotte would have the
capacity for 7 studio facilities, and according to the total population, Charlotte would be able
to hold 6 studio facilities.
TABLE 5: MARKET PENETRATION COMPARISONS
Charlotte Greenville Winston Avg.
Total # Studio Competitors (2013) 4 3 2
Total # Independent artists, writers,
and performers (2010)
156 20 38
Estimated Total Population (2010) 1,795,472 647,401 482,025
Number of independent artists,
writers, and performers per Studio
Competitors (2010)
39 7 19 22
2013 Estimated Population (Esri) 2,302,347 850,047 650,711
Number of Total Population per Studio
(2013)
575,587 283,349 325,355 394,764
Source: US Census Bureau 2011 Non-employer Statistics and MSA Business Patterns
17. Morgan Hamer ∙ May 2014
17
CHARLOTTE GROWTH FORECAST
Given Esri’s growth projection for the total population in the Charlotte, there is the
availability for two additional studio facilities within the Charlotte Market (Table 6). However,
when considering the population per number of individual studio rentals within each unit, the
Charlotte Market can only sustain five more individual studio rental spaces in 2018. Given that
all of the available studio rentals in the Charlotte market are currently at full capacity with wait-
lists that range from a few months to two to three years, it is plausible to assume that the
capacity for individual rentals has not been currently met. Unfortunately, the number of
individual rental units within each studio facility in the alternate market areas was not available
to find an average saturation rate for units per population.
TABLE 6: CHARLOTTE GROWTH FORECAST
Total
Population
Number of
People per
Studio
Avg. # of
People Per
Studio in 3
MA’s
Avg. Capacity
for Studio-
Facility per
Person
# of Studio
Units in
Facility
Population per # of
Individual Studio
Rentals
2013 2,302,347 575,587 394,764 6 68 33,858
2018 2,465,303 616,323 6 73
18. Morgan Hamer ∙ May 2014
18
TRADE AREA ANALYSIS
CHARLOTTE TRADE AREA
The trade area of my proposed site is located in the southwest portion of Charlotte’s city
center, spanning along the I-77 corridor from I-485 to Statesville Road. It primarily
encompasses Uptown Charlotte, Wilmore, Dilworth, and SouthEnd (Map 8). The existing
warehouses and industrial spaces stretching from South Blvd to I-77 have slowly been
converted into spaces with alternative uses. Tremont Music Hall, a few blocks from the studio
site was an industrial building converted into a music venue. Other industrial building and mills
have been converted into retail spaces, restaurants, offices, and upscale residential spaces.
There are several popular methods used to delineate trade areas. Gravity modeling is
one method that is often accurate, but is not sufficient for determining the trade area of the
given site because it assumes that no physical, social or information barriers exist. The space
filling approach is another common method of trade area delineation. This approach assumes
a rational firm does not intend to cannibalize its own sales, therefore its trade area is half the
distance between similar firms. The Space Filling approach is not a sufficient method of
measuring the trade area of an artist-studio rental property because of the benefits of
agglomeration in artist communities. Drive-time analysis factors in the average amount of time
to commute to a given location. For the purpose of this study, it is a suitable method of
assessing the trade area of artist studio rentals because these locations need to be relatively
easy to access by car or public transportation. The trade area is based from a seven minute
drive time model provided by TAS Online.
The Wilmore and SouthEnd neighborhoods lie within the site’s trade area, and play a key
role in the selection of this site. Southern Living Magazine recently listed Wilmore/SouthEnd in
the top ten “comeback” neighborhoods in the south. The growth of SouthEnd and proximity to
downtown facilitated the appeal of restoring and developing the once dilapidated Wilmore
neighborhood. The Historic SouthEnd neighborhood self-proclaims it is “where retro mixes
with contemporary, historical bumps up against trendy, and art intersects commerce, resulting
in a pulsing, vibrant neighborhood in the city with meteoric growth.” Historic SouthEnd hosts a
monthly gallery crawl featuring several notable galleries and the one competitor in the trade
area, the Charlotte Arts League. In addition, it is home to many of Charlotte’s most popular
restaurants and bars, and hosts a weekly gathering of Charlotte’s food-trucks
(Historicsouthend.com, 2014). The presence of growing prosperity, the cultivation of cultural
activity, and the recent development initiatives in the surrounding trade area provide a
favorable environment for artist communities and creative development.
19. Morgan Hamer ∙ May 2014
19
MAP 8: SITE TRADE AREA
Source: TAS Online
TRADE AREA COMPETITION
A direct competitor is a large-scale, artist studio rental property that also provides an
area or gallery for the public to view art. Indirect competition includes other art galleries,
museums, and artist studios within the trade area. Because of the nature of the art industry,
proximity to other artist studios, galleries, nightlife, restaurants, and other cultural activities is
essential. The only direct competitor within this trade area is the Charlotte Arts League in
Historic SouthEnd.
20. Morgan Hamer ∙ May 2014
20
TRADE AREA DEMAND
Demand within the trade area may be measured by a few different variables. These
include the number of artists per available studio space, education attainment levels within the
trade area, disposable income per capita, and average household income within the trade area.
Disposable income per capita is a large indicator of demand for arts: Disposable income is
affected by changes in real GDP growth, interest and tax rates, employment levels and the
household savings rate (IBIS World, 2013). The same growth forecast provided by Esri for the
market area is applied to the trade area analysis. As indicated in Table 7, the site’s trade area
is composed of a growing population, with growing income, and high educational attainment
rates.
ALTERNATE TRADE AREAS
Two alternative trade areas have been identified within close range of Uptown Charlotte.
They are NoDa and Plaza Midwood. These trade areas were selected due to their proximity to
the city center, their diverse residents, and their reputation for being creative, bohemian
districts in Charlotte.
NoDa, centered around the intersection of North Davidson St. and 36th street, was a
prominent neighborhood for Charlotte’s artist and gallery spaces from the late 1990’s through
2011 (Map 9). The neighborhood is described as “Charlotte’s historic arts and entertainment
district – a neighborhood where the people are as diverse as the art, live music, craft beers,
restaurants, custom gifts and tattoos you will find here. NoDa is dedicated to promoting the
arts, living eco-friendly lifestyles, supporting small businesses, encouraging diversity and
aiding fellow charities” (Noda.org). A bi-monthly gallery-crawl was hosted here for almost a
decade, but gentrification has forced resident artists to the outskirts of this neighborhood, as
previously mentioned.
Plaza Midwood is a Charlotte neighborhood known for its bohemian atmosphere and
unique restaurants, bars, shopping, and music venues (Map 9). “The Plaza Midwood business
district features an exciting blend of antique and consignment stores and art galleries. Boutique
shops offer unique clothing and home furnishings and accessories. Locally-owned restaurants
give diners the choice of everything from Southern home-style cooking to authentic ethnic
cuisine” (plazamidwood.org). This neighborhood is also planning a gallery crawl among the
shops, galleries, and restaurants that feature artwork.
21. Morgan Hamer ∙ May 2014
21
MAP 9: THREE TRADE AREAS
Source: TAS Online
Each of the trade areas are favorable due to projected growth rates, however Plaza
Midwood has a higher rate of growth in median house hold income for 2018. NoDa has a higher
projected population growth, in part due to proposed development, but the average income in
NoDa is still below the other two trade areas. Though Plaza Midwood ranks slightly above the
site trade area, the site’s trade area is favorable overall, with high-levels of educational
attainment, households making over $100k a year, disposable income, and income growth
projections for 2018 (Table 7). The rise in income and population growth in Plaza Midwood
may also be an indication of an unfavorable environment for artists, due to a decline in
affordability as this location increases in wealth and popularity.
22. Morgan Hamer ∙ May 2014
22
TABLE 7: ALTERNATE TRADE AREA CHARACTERISTICS
SUBJECT TRADE
AREA
NODA PLAZA MIDWOOD
POPULATION 2013 62,935 53,078 76,013
2018 68,081 57,620 81,417
TRENDS:
2013 - 2018
ANNUAL RATE
Population 1.58% 1.66% 1.38%
Median
Household
Income
4.27% 3.22% 4.43%
HOUSEHOLDS
BY INCOME
Average
Household
Income (2013)
$65,930 $51,519 $70,668
Average
Household
Income (2018)
$76,424 $57,333 $81,893
Median
Household
Income (2013)
$37,812 $32,974 $40,460
Median
Household
Income (2018)
$46,614 $38,636 $50,257
$100,000 +
(2013)
16.8% 10.1% 18.4%
DISPOSABLE
INCOME
Average
Disposable
Income (2013)
$47,390 $39,268 $50,151
EDUCATIONAL
ATTAINMENT
25+ (2013)
High School 20.1% 24.9% 19.3%
Bachelors and
Professional
Degrees
40.5% 26.8% 42.8%
Source: STDB and Esri
23. Morgan Hamer ∙ May 2014
23
TABLE 8: TRADE AREA LIFESTYLE TAPESTRY
Site Metro Renters 31.9%
Metro City Edge 21.34%
Metropolitans 10.33%
NoDa Inner City Tenants 24.36%
Metro renters 15.21
Metropolitans 10.32%
Plaza Midwood Metro Renters 33.49 %
Great Expectations 13.33 %
Inner City Tenants 12.98 %
Metro
Renters
Young, educated singles, residents of Metro Renters neighborhoods are just beginning their
professional careers in some of the largest U.S. cities such as New York, Chicago, and Los Angeles.
Residents will sometimes share housing with a roommate to help defray the cost of their high rent.
Households are either single person or shared. The median age of 32.1 years is younger than the
U.S. median of 37.3 years. Approximately 30 percent are in their 20s; 14 percent are in their early
30s. This younger population is also more diverse than the U.S. population. Median household
income is $49,852.
Inner City
Tenants
: Inner City Tenants residents are a microcosm of urban diversity; their population is represented
primarily by white, black, and Hispanic cultures. This multicultural market is younger than average,
with a median age of 28.9 years. Household types are mixed; 34 percent are singles, 28 percent are
married-couple families, 21 percent are single parents, and 10 percent share housing. Turnover is
high in these neighborhoods because many are enrolled in nearby colleges and work part-time.
These neighborhoods have an annual population growth of 0.46 percent.
Great
Expectations
Young singles who live alone and married-couple families dominate the Great Expectations market,
although all household types are represented. The median age is 33.2 years. Some residents are just
beginning their careers or family lives. Compared to the U.S. figures, this segment has a higher
proportion of residents who are in their 20s and a higher proportion of householders younger than
35 years. The median household income of $33,993 is lower than the US median. Nearly half of the
population aged 25 years and older has some postsecondary education; 18 percent hold a bachelor’s
or graduate degree.
Metro City
Edge
Married couples, single parents, and multigenerational families are the household types found in
Metro City Edge neighborhoods. The median age of this segment is 31 years because of the children,
including adult children who still live at home. The average family size of 3.5 is slightly higher than
the U.S. average. Seventy-two percent of the residents are black; 17.3 percent are white; and 4
percent are American Indian—four times the U.S. level. The median household income for this
segment is $27,875.
Metropolitans Residents of Metropolitans communities prefer to live in older city neighborhoods. Approximately
half of these households are singles who live alone or with others; 40 percent are married-couple
families. One in four of the residents is aged 20–34 years; the median age is 37.1 years. Most of the
population is white. Half of the residents who are employed work in professional or managerial
positions. More than 77 percent of the population aged 25 years and older have attended college or
completed a degree program. Thirty percent have earned a bachelor’s degree, and 22 percent hold
a graduate degree. The median household income is $54,926.
Data Note: This report identifies neighborhood segments in the area. The index is a comparison of the percent of households or
population in the area, by Tapestry segment, to the percent of households or population in the United States, by segment. An
index of 100 is the US average. Source: Esri.
24. Morgan Hamer ∙ May 2014
24
One final comparison among the trade areas was completed using Esri’s Lifestyle
Tapestry Segmentation report (Table 8). Segmentation explains customer diversity, describes
lifestyle and life-stages, and incorporates a wide range of data. Esri implements a large, well-
selected array of attributes to capture this diversity with the most powerful data available. Data
sources include Census 2000; Census 2010; the American Community Survey; Esri's
demographic updates; Experian's INSOURCESM consumer database; and consumer surveys,
such as the Survey of the American Consumer from GfK MRI, to capture the subtlety and
vibrancy of the US marketplace The selection process draws on Esri's experience in working
with the 1980, 1990, and 2000 censuses and includes a range of multivariate statistical
methods, in addition to factor analysis, principal components analysis, correlation matrices,
and graphic methods (Esri Tapestry Segmentation Methodology, 2013).
The top three lifestyle types and their profile for each trade area are listed in Table 8.
The site’s trade area and Plaza Midwood are most highly represented by “Metro Renters,” which
is also an indication of being favorable environments for creative communities. “Metro Renters”
are younger, highly educated, and more diverse than the rest of the US Population (Esri, 2013).
Diversity is an additional cultural vibrancy indicator according ArtPlace America. In addition,
locations closer to the city center with younger populations and cultural diversity are favorable
for artists because these factors act to stimulate creativity and create an environment for an
alternative lifestyles not found in outlying suburban areas (Ley, 2003).
25. Morgan Hamer ∙ May 2014
25
SITE ANALYSIS
SITE CHARACTERISTICS
The site is located at 2213 Toomey Ave in Charlotte, NC in the 28203 zip-code in an
industrial and warehouse district just south of Charlotte’s CBD. The residential Wilmore
neighborhood, is directly adjacent to the north of the site. To the west is I-77, which acts as a
boundary to the industrial and warehouse district. The building was constructed in 1969, and
has since been used as a warehouse for trucking supplies. Of the 29,925 square foot building
currently owned by Truck Equipment Manufacturing Co, 26,682 square feet is used as a
warehouse and the remaining 3,243 square feet is used for office space that may potentially
be converted into studio units.
The site features 50 parking spaces and excess land for outdoor storage on a 2.09 acre
lot (CIMLS). The excess land may be used as a community garden and picnic area for artists
and visitors. According to Polaris, the site is not located in a FEMA Flood zone (Map 10).
MAP 10: FEMA FLOOD ZONE PANEL # 3710454300K
26. Morgan Hamer ∙ May 2014
26
IMAGE 2: AERIAL VIEW OF SUBJECT SITE
Source: CoStar, 2014
IMAGE 3: AERIAL MAP OF SITE
Source: CoStar, 2014
27. Morgan Hamer ∙ May 2014
27
ZONING
The site is zoned I-1. Allowable uses include: studios for artists, designers,
photographers, musicians, sculptors, gymnasts, potters, wood and leather craftsmen, glass
blowers, weavers, silversmiths, and designers of ornamental and precious jewelry; and Retail
establishments, shopping centers, and business, personal, and recreational services, up to
70,000 square feet. The parcels surrounding the subject are primarily zoned I-1, I-2, and
various residential and mixed use zoning types (Map 11).
MAP 11: ADJACENT ZONING
Source: Mecklenburg County GIS
28. Morgan Hamer ∙ May 2014
28
ACCESSIBILITY AND TRANSPORTATION
According to WalkScore.com, the site has a Walk Score of 66 out of 100. This location is
considered “somewhat walkable” so some errands can be accomplished on foot. The Hart
Witzen Gallery has a walk-score of 78, Charlotte Arts League has a walk-score of 86, the York
County Arts Council’s score is 72, and the X-Foundation has a walk-score of 63. Nearby parks
include Abbott Park, Revolution Park and Clark Griffith Park. The Charlotte-Douglas
International Airport is within 6 miles of the site, and the LYNX Blue Line is within walking
distance, as well multiple bus stops located on North Tryon Street (Table 8).
TABLE 8: TRANSPORTATION AND WALK-TIME
Travel Time Distance
Airport Charlotte-Douglas Airport 13 min drive time 5.6 miles
Light Rail East/West (LYNX Blue lines) 13 minute walk
New Bern (LYNX Blue line) 17 minute walk
Source: CoStar
MAP 12: SURROUNDING AMENITIES
29. Morgan Hamer ∙ May 2014
29
ALTERNATE SITES
Two similar sites were selected in proximity to the proposed site to assess the overall
quality of the proposed site location (Tables 9 & 10). The site of the proposed studios ranked
last among the comparable sites. This is impart due to the location of the site. The alternative
sites were closer to transportation and to the heart of Historic SouthEnd, however these sites
have significantly higher appraisal value and less space available.
The neighborhood’s reaction to the sites was not a factor considered in the comparison
because it would be viewed as favorable for each location. This is due, in part, to the trends of
converting industrial spaces for other uses in the surroundings of this area. Additionally, adding
creative space offers economic and cultural opportunities in the SouthEnd/Wilmore
neighborhoods.
IMAGE 4: SITE 1 LOCATED AT 222 RAMPART ST
Image Source: Polaris
IMAGE 5: SITE 2 LOCATED AT 3115 GRIFFITH ST
Image Source: Polaris
30. Morgan Hamer ∙ May 2014
30
TABLE 9: ATTRACTIVENESS MATRIX
PROXIMITY TO
ENTERTAINMENT
AVAILABLE
SPACE
SURROUNDING
ENVIRONMENT
TRANSIT
ACCESS
ZONING WALK
SCORE
BUILDING
CONDITION
PRICE TOTAL
Subject 5 10 6 6 10 6 7 8 52
Site 1 4 8 7 8 8 5 7 9 56
Site 2 7 7 8 9 10 8 9 0 58
TABLE 10: ALTERNATE SITE COMPARABLES
Subject Site 1 Site 2
Acres 2.09 1.03 1
Total SF 29,925 27,180 24,582
Type Warehouse Warehouse Warehouse
Year Built 1969 1964 1959
Appraisal (2011) $307,000 $789,500 $1,262,400
Sale Price $725,000 $595,000 $2,550,000
Zoning I-1 I-2 (CD) I-2
Walk Score 66 52 82
Source: Polaris and Walkscore.com
31. Morgan Hamer ∙ May 2014
31
FINANCIAL ANALYSIS
This section evaluates the financial feasibility of the project. The property value is
assessed by recent sales of similar properties within close rage of the site. One of the most
important factors in the feasibility of this project is maintaining affordability for the rental units.
Often, artist-developers invest in the creation of creative spaces to address the immediate
needs of the surrounding community and artist peers, as well as creating a facility to for their
own production. For this reason, the profits from developing a creative studio-space
community may be undermined by the gains in networking and public-recognition for the
individual or group of artist-developers (Walker, 2007).
Financing options for creating affordable artist studios are numerous and complex.
Studio spaces may be leveraged as a means of economic development for the city and
surrounding community. Donations by individuals and investors may be acquired by campaigns
sponsored by developers promoting community development. Funding from local, state, and
national CDC’s (Community Development Corporations) with creative initiatives may be
acquired for such projects (Walker, 2007). One such organization in Charlotte is the Arts and
Science Council which is dedicated to the creation of a strong cultural environment in the city.
In addition, creation of artist spaces in the SouthEnd and Wilmore neighborhoods further
reinforces local efforts to create a positive image of this area.
NET INCOME FIGURE
The overall net income is evaluated with consideration of low-range and high-range
renovation cost estimates, occupancy rates and rent from studio units, operating expenses,
and the cost of debt services. All of these factors are evaluated over a five-year time period.
ACQUISITION AND CONSTRUCTION COSTS
Estimating the costs of renovation and conversion of the existing warehouse into
individual studio rental units is challenging. Factors such as zoning, building-codes, and design
must be considered in effectively estimating the cost, however some of the most experienced
contractors face challenges in making these evaluations. Fortunately, the existing zoning
allows for office and studio rentals.
32. Morgan Hamer ∙ May 2014
32
Property acquisition and renovation costs are shown in Table 11. Hard renovation costs
including plumbing, interior and exterior refitting, and electricity are estimated individually in
the low-range estimate. The property sale price is also reduced $25,000 from the current
asking price in the low-range estimate. The property asking price and half the estimated cost
of construction for a similar warehouse as indicated by RS Means are summed to determine the
high-range estimate for acquisition and renovations. The total cost of the property and
renovation with the low-range estimate is $1,109,625 and the total cost of the high-range
estimate is $1,784,250, roughly a $700,000 pricing difference.
TABLE 11: PROPERTY ACQUISITION AND RENOVATION ESTIMATES
Price Per SF Low-Range
Estimates
High-Range
Estimates
Property Sale Price $700,000 Property Sale Price $725,000
Renovations Estimated Cost Of
Construction (RS MEANS)
Plumbing $40,000 $2,118,500.00/2 $1,059,250
Interior-Refitting $90,000
Electricity $5/SF $149,625
Exterior-Refitting $1/SF $30,000
Parking and landscape $100,000
Total Cost $1,109,625 $1,784,250
ESTIMATED REVENUE
The typical in the Charlotte Market is approximately $1 rent per square foot. In an
attempt to remain competitive in the Charlotte market, the proposed studio facility offers four
different sized studios, available for one-year leases, below market rate (Table 12). Given the
pricing structure, the maximum yearly income at capacity will be $208,200. Table 13 displays
a modest estimate of the five year annual income projection assuming a growth in occupancy
of the studio units over time with increased exposure to the market, increases in favorable
market characteristics, and the growing artist population in the area.
33. Morgan Hamer ∙ May 2014
33
TABLE 12: UNIT SIZE AND PRICING STRUCTURE
Studio Type Individual
Studio Sizes
# of Rental
Units
Total SF Rent Total
Small 300 SF 22 6600 $275/month $6,050
Medium 500 SF 12 6000 $450/month $5,400
Large 1000 SF 5 5000 $800/month $4,000
Extra Large 1500 SF 2 3000 $950/month $1,900
Total 41 20,600 $17,350
Maximum Income Potential $208,200
TABLE 13: 5 YEAR ANNUAL INCOME PROJECTION
Year Small
Unit
$275
Medium
Unit
$450
Large
Unit
$800
X Large
Unit
$950
Total
Monthly
Income
Total Annual
Income From
Rent
Annual
Gallery
Sales
Annual
Gallery
Income
Total
Annual
Income
2014 12 5 2 1 $8,100 $97,200 $5,000 $1,500 $98,700
2015 20 5 2 1 $10,300 $123,600 $8,000 $2,400 $126,000
2016 20 8 4 2 $14,200 $170,400 $10,00 $3,000 $173,400
2017 21 11 4 2 $15,825 $189,900 $12,000 $3,600 $193,500
2018 22 12 5 2 $17,350 $208,200 $14,000 $4,200 $212,400
ANNUAL OPERATING EXPENSES
Operating costs tend to be quite low, are variable depending on utilities use, and
typically are paid by individual unit occupants. Rough estimates of electricity, water, building
maintenance, and a management fee are all considered (Table 14). The management fee is
estimated at $18,000/year assuming management works roughly 20 to 30 hours per week
earning $1,500/month.
TABLE 14: ANNUAL OPERATING COST ESTIMATES
Water Heat/Electricity Building
Maintenance
Management Fee Total
$2,400 $12,000 $35,000 $18,000 $67,400
COST OF CAPITAL
The cost of capital for low- and high-range estimates is considered with a 4% interest
rate and a 25% down payment for a 30 year mortgage (Table 15). The annual cost of debt
services for the low-range estimate is $47,676 and is $76,656 for the high-range estimate.
34. Morgan Hamer ∙ May 2014
34
TABLE 15: DEBT SERVICES SUMMARY
Low Estimate High Estimate
25 % Down Payment $277,406.25 $446,062.5
Remaining $832,218.75 $1,338,187.50
Annual Debt Service $47,676 $76,656
After 5 Years $749,787 $1,205,640
FIVE YEAR CASH FLOW ANALYSIS
The five year cash flow estimates are calculated with both property acquisition and
renovation scenarios (Table 16 & Table 17). The estimated revenue, taxes, loan payment, and
operating expenses are all considered. The tax estimates are based on the current city and
county tax-rate for the property, which is 1.3012%. The total cumulative profit over five years
is $174,475 for the low estimate, however, due to the increased debt payment and tax rate,
cumulative profit is -$3,342 for the high estimate.
TABLE 16: FIVE YEAR CASH FLOW: LOW RENOVATION ESTIMATE
Year 1 Year 2 Year 3 Year 4 Year 5
Revenue $98,700 $126,000 $173,400 $193,500 $212,400
Taxes -$10,828.83 -$10,828.83 -$10,828.83 -$10,828.83 -$10,828.83
Loan
Payment
-$47,676 -$47,676 -$47,676 -$47,676 -$47,676
Operating
Expenses
-$67,400 -$67,400 -$67,400 -$67,400 -$67,400
Profit -$27,204.83 $95.17 $47,495.17 $67,595.17 $86,495.17
Cumulative
Profit
-$27,204.83 -$27,109.66 $20,385.51 $87,980.68 $174,475.85
TABLE 17: FIVE YEAR CASH FLOW HIGH RENOVATION ESTIMATE
Year 1 Year 2 Year 3 Year 4 Year 5
Revenue $98,700 $126,000 $173,400 $193,500 $212,400
Taxes -$17,412.50 -$17,412.50 -$17,412.50 -$17,412.50 -$17,412.50
Loan
Payment
-$76,656 -$76,656 -$76,656 -$76,656 -$76,656
Operating
Expenses
-$67,400 -$67,400 -$67,400 -$67,400 -$67,400
Profit -$62,768.50 -$35,468.50 $11,931.50 $32,031.50 $50,931.50
Cumulative
Profit
-$62,768.50 -$98,237 -$86,305.50 -$54,274 -$3,342.50
35. Morgan Hamer ∙ May 2014
35
RETURN ON INVESTMENT
The return on investment is evaluated with low-range and high-range estimated
renovation costs with no land appreciation and 2% land appreciation (Table 18 & Table 19). The
ROI’s were evaluated based on the risk-free rate of return. Each scenario reveals a favorable
annual return on investment. The most favorable ROI is the low renovation estimate with 2%
land appreciation returning a 42% annual compounded ROI. The least favorable ROI is returned
by the high renovation estimate with no land appreciation yielding a 16% annual compounded
ROI, however this is still favorable. Compared to other national and local financial investments,
the ROI for each scenario is also favorable. The annual yield on a 5- year CD in Charlotte is
0.49% APY and the average money market account in Charlotte is 0.04% APY. The national
average for a 5-year CD is 0.73% APY and the national average for money market accounts is
0.07% APY (Gower, 2014).
TABLE 18: RETURN ON INVESTMENT WITH NO LAND APPRECIATION
Low Estimate High Estimate
Sale Price $1,109,625.00 $1,784,250.00
5% Sales Commission -$55,481.25 -$89,213.50
Loan Balance -$749,787.00 -$1,338,187.50
Net Profit from Sale $304,356.75 $356,850.00
5 Year ROI 173% 79%
Annual compounded ROI 34.5% 15.9%
TABLE 19: RETURN ON INVESTMENT WITH 2% LAND APPRECIATION
Low Estimate High Estimate
Sale Price $1,225,116.00 $1,931,330.00
5% Sales Commission -$61,256.00 -$96,567.00
Loan Balance -$749,787.00 -$1,338,187.50
Net Profit from Sale $414,073.00 $496,575.50
5 Year ROI 212% 111%
Annual compounded ROI 42% 22%
36. Morgan Hamer ∙ May 2014
36
STATEMENT OF FEASIBILITY
Development of the proposed artist studio rentals and gallery space is viable based upon
the evaluations provided in the feasibility analysis. The Charlotte market and the site trade
area‘s economic, demographic, and cultural characteristics provide an optimal location and
sufficient demand for artists. There are potential issues and additional strengths that may
impact the feasibility of the project not mentioned in the previous analysis. A sensitivity analysis
is conducted to better assess risks involved with this project proposal.
Additional factors associated with the site’s surroundings that may create challenges to
the project were not previously mentioned. Some of the residential areas immediately
surrounding the site have high crime rates, poor housing quality, and high rates of poverty. In
addition, the relatively low walkability score may hinder access for some potential customers.
Additionally, issues of affordability may arise due to rising income, demand for housing, and
cost of living in the adjacent Historic SouthEnd and Wilmore neighborhoods. Though high rates
of income help foster creative industries, increases in affordable housing and amenities may
be an obstacle to attracting artists to the location.
There are additional factors not addressed in the feasibility analysis that may enhance
opportunities for the proposed site development. The LYNX Blue Line Extension of the Charlotte
light rail scheduled to begin operating in 2017 can potentially create extensive opportunities
for the project. The extension will connect the site to Uptown Charlotte, NoDa, and UNC
Charlotte, making it easier for customers to access this location from school, work, and other
creative districts in Charlotte. Also, there is potential for increased volume of gallery visitors
from the extension.
Another factor that may contribute to the project’s success is the potential for similar
creative development in sites surrounding the project’s location. There is still a number of
industrial buildings, warehouses, and vacant sites that could eventually be converted into
creative spaces, lofts, and galleries. Artist communities thrive in environments that allow for
organic, creative-development promoted by the availability of affordable space and potential
for additional creative development opportunities.
The last factor not previously addressed that may enhance the project’s success is the
availability of a variety of opportunities to offset costs. The project may fit requirements to
receive funding and grants from local and national programs that encourage creative-
development, cultural initiatives, and the arts. In addition, “if public policy declares that projects
37. Morgan Hamer ∙ May 2014
37
like these merit public investments, outright subsidies that pay for the uneconomical portions
of projects can allow them to go forward” (Walker, 2007).
Cost reductions and increased revenue may be sourced in-house, as well. There is
potential to utilize excess land and building space and unoccupied units in the property for
event rentals such as weddings, workshops, private parties, and performances. The use of
“sweat-equity” by investors and tenants in the initial renovations and building maintenance
may offset costs. Examples of using “sweat-equity” include having the artist-investors or
potential tenants be responsible for painting walls, finishing floors, removing debris,
landscaping duties, and other light renovations for discounted rental rates. Also, this could be
implemented by requiring some form of shared maintenance responsibilities for renters, such
as cleaning or landscaping, to help maintain affordable rental rates.
RISK ASSESSMENT
Despite the feasibility of the proposed project, there are a number of various risks and
potential disruptions associated with this project. These are a few potential challenges to the
feasibility of this project. Unforeseen changes in market demand for artist studios may disrupt
the studio’s projected annual income. Changes in demand may result from lower population
and income growth rates than predicted that may be caused by a slow economic recovery in
the region. In addition, increasing the number of artist studio rentals in the next five years may
exceed the market demand. This is especially risky given the shortage of information necessary
to estimate the market saturation rates for studio-rental units.
Though the annual income projection for the studio was conservative, it may be too
optimistic. This may be due to challenges in advertising the available spaces, lower gallery
sales, or inadequate amenities. There are potential difficulties reaching the target market—
studio artists-- given the site’s distance from other art-related facilities and a weak artist-
network in the trade area.
There may be limited capital and human resources necessary to support the proposed
investment. The amount of capital required for a down-payment in both scenarios is relatively
large for an individual or small group of artist-investors. Outside funding from grants or
development by a commercial firm may be necessary to generate appropriate funding. The
estimated costs of renovation and operating expenses may be too low and/or the total
development costs go above the market value of the project after completion.
38. Morgan Hamer ∙ May 2014
38
SENSITIVITY ANALYSIS
Two scenarios are evaluated that would reverse the feasibility of the project. The first
scenario is used to illustrate the importance of a attaining a low interest rate on a mortgage
with a sizable down payment, and the significance of slight increases in operating expenses.
Table 20 demonstrates the financial outcome if interest rates on a thirty-year mortgage were
increased to 8%, with a 15% down payment of $180,846, and slightly higher operating expenses
of $80,000 per year using the high acquisition estimate. The cumulative profit after five years
is -$317,761, which exceeds the net profit from sale ($276,636.50).
The second scenario illustrates the unfavorable results from increases in the operating
expenses and total acquisitions and renovation costs. This scenario assumes total cost of
acquisition and renovation is $2 million with a 30 year mortgages with 6% interest and 20%
down ($400,000). Operating expenses are increased to $125,000 per year. Again, the total
cumulative profit after five years (-$500,665) does not exceed the net profit from sale, which
is $300k.
TABLE 20: ALTERNATE SCENARIO 1
Year 1 Year 2 Year 3 Year 4 Year 5
Revenue $98,700.00 $126,000.00 $173,400.00 $193,500.00 $212,400.00
Taxes -$18,456.22 -$18,456.22 -$18,456.22 -$18,456.22 -$18,456.22
Loan Payment -$124,896.00 -$124,896.00 -$124,896.00 -$124,896.00 -$124,896.00
Operating
Expenses
-$80,000.00 -$80,000.00 -$80,000.00 -$80,000.00 -$80,000.00
Profit -$124,652.22 -$97,352.22 -$49,952.22 -$29,852.22 -$10,952.22
Cumulative Profit -$124,652.22 -$222,004.44 -$271,956.66 -$301,808.88 -$312,761.10
High Estimate
Sale Price $1,784,250.00
5% Sales Commission -$89,213.50
Loan Balance -$1,418,400.00
Net Profit from Sale $276,636.50
39. Morgan Hamer ∙ May 2014
39
TABLE 21: ALTERNATE SCENARIO 2
Year 1 Year 2 Year 3 Year 4 Year 5
Revenue $98,700 $126,000 $173,400 $193,500 $212,400
Taxes -$20,819 -$18,456.22 -$18,456.22 -$18,456.22 -$18,456.22
Loan
Payment
-$115,114 -$124,896 -$124,896 -$124,896 -$124,896
Operating
Expenses
-$125,000 -$125,000 -$125,000 -$125,000 -$125,000
Profit -$162,233 -$134,933 -$87,533 -$67,433 -$48,533
Cumulative
Profit
-$162,233 -$297,166 -$384,699 -$452,132 -$500,665
High Estimate
Sale Price $2,000,000
5% Sales Commission -$100,000
Loan Balance -$1,600,000
Net Profit from Sale $300,000
CONCLUSION
There are a few factors that key to ensuring the success of this project. Reduction of the
costs of renovation and acquisition of the property is essential. There are a variety of ways this
may be accomplished if the developers and investors are resourceful. Maximizing the amount
of capital invested upfront and a attaining a low mortgage rate will also ensure the feasibility
of this project. Once the facility is operating, diversifying methods of revenue production in
addition to individual studio-leases—through event rentals, gallery sales, etc.--will also
increase the profitability of the project.
Effectively marketing the studio facility is another essential component of its success.
These types of projects do not require the same type of marketing strategies used for leasing
office-spaces or residential units because artists’ locational decisions are influenced by factors
that deviate from a majority of the population. Marketing strategies must accommodate the
following concepts: 1) artists are more likely to be attracted to community-based, grass-roots
organizations than to highly commercialized spaces due to the perceived loss of “authenticity”
in these types of locations; 2) artist are drawn to networking opportunities via exposure to
other artists, galleries, and visitors; 3) contemporary artists are attracted to diverse settings,
so marketing to artists of various ages, cultures, experience-levels, and media will help
establish a customer-base that will attract additional artists in the future; and 4) marketing
40. Morgan Hamer ∙ May 2014
40
artist studio space is most effective through personal, informal networks such as community
blogs, social media, and word-of-mouth within local creative communities. Promoting the
studio spaces to art programs in nearby colleges in universities to students and professors is
one way to attract potential tenants. Advertising in locations such as local art-supply stores,
coffee-shops, alternative music venues, theaters, and art-related events are additional
examples of appropriate venues for marketing for this type of facility.
41. Morgan Hamer ∙ May 2014
41
WORKS CITED
1. "About Plaza Midwood." Plaza Midwood Neighborhood. 2013. Plaza Midwood Neighborhood
Association. 05 May 2014 <http://www.plazamidwood.org/about>.
2. Carter, Britanny. “IBISWorld Industry Report 71151 Performers & Creative Artists in the US.” Dec.
2013. IBIS World. 22 April 2014 <
http://clients1.ibisworld.com.librarylink.uncc.edu/reports/us/industry/default.aspx?entid=163
7>.
3. "Charlotte Overview." Charlotte Chamber of Commerce. Nov. 2012. 05 May 2014
<http://charlottechamber.com/eco-dev/charlotte-overview/>.
4. CIMLS. 22 Apr. 2014 <http://www.cimls.com/sale-listing/654626-213-Toomey-Ave-
Charlotte-North-Carolina-28203>.
5. CoStar. 14 Feb. 2014 <http://www.costar.com/>.
6. Google Maps. 2014. 05 May 2014 <http://maps.google.com/>.
7. Gower, John. "Savings Account & CD Interest Rates: Winter 2014." NerdWallet Finance. 4 Jan.
2014. 05 May 2014 <http://www.nerdwallet.com/blog/banking/studies/savings-
rates/#average-rates-money-market>.
8. Ley, David. "Artists, Aestheticisation and the Field of Gentrification." Urban Studies (2003):
2527-544. 5 May 2014.
9. Lindsley, Scott. "Living in Historic Wilmore & South End." 2009 WIlmore Living. 05 May 2014
<http://www.liveinwilmore.com/>.
10. LoopNet. 9 Oct. 2013. 04 May 2014 <http://www.loopnet.com/>.
11. “Methodology Statement: 2013/2018 Esri US Demographic Updates.” Aug. 2013. Esri. 22 Mar.
2014
<http://www.esri.com/data/esri_data/~/media/Files/Pdfs/library/whitepapers/pdfs/demograp
hic-update-methodology-2013.pdf>.
12. "Methodology Statement: Esri Data-- Tapestry Segmentation." May 2013. Esri White Paper. 5
May 2014 <http://www.esri.com/~/media/Files/Pdfs/library/whitepapers/pdfs/esri-data-
tapestry-segmentation.pdf>.
42. Morgan Hamer ∙ May 2014
42
13. "Metropolitan and Micropolitan." Current Statistical Area Lists and Delineations. Feb. 2013. US
Census Bureau. 23 Apr. 2014 http://www.census.gov/population/metro/data/metrodef.html
14. "NoDa." 22 Apr. 2014 <http://www.noda.org/>.
15. Polaris 3G - Mecklenburg County GIS. 22 Apr. 2014
<http://polaris3g.mecklenburgcountync.gov/>.
16. RSMeans Online. 2014. Reed Construction Data Inc. 05 May 2014
<http://www.rsmeansonline.com/>.
17. STDB. 05 May 2014 <http://stdbinc.com/>.
18. TAS Online | Trade Area Systems. 05 May 2014 <http://tasonline.com/>.
19. "The Edge of Town." Historic SouthEnd Charlotte. 05 May 2014
<http://www.historicsouthend.com/>.
20. "The South's Best Comeback Neighborhoods." Southern Living. 05 May 2014
<http://www.southernliving.com/home-garden/best-neighborhoods/best-neighborhoods-
wilmore-south-end-charlotte_2>.
21. “Vibrancy Indicators." ArtPlace America. 22 Apr. 2014
<http://www.artplaceamerica.org/vibrancy-indicators/>.
22. Walk Score. 2014. 05 May 2014 <http://www.walkscore.com/>.
23. Walker, Chris. "Artist Space Development: Financing." Urban Institute (2007). 5 May 2014.
43. Morgan Hamer ∙ May 2014
43
APPENDIX
SELF-ASSESSMENT
Though a significant amount of time, research, and attention to detail were invested in
this study, additional investigation and resources would have strengthened this feasibility
report. Insufficient information on the local artist population, studios in the current and
alternative markets, and the cost of renovations and operations reduced the accuracy of this
feasibility study. In addition to insufficient data, my inexperience and lack of exposure to this
type of project created some challenges. The following elements are those that I feel would
have strengthened this report:
A means of finding a more accurate measure of the number of artists in a given location
would have assisted measuring the supply and demand for studios in the market area.
Financial information, such as operating expenses, construction/renovation costs, and
revenue from similar facilities in the market would have helped estimate these expenses
for my own project and determine an estimation of potential revenue.
More information on rentals in the Charlotte and alternate market areas, including the
number of units, square footage, and rental rates would have be applied to find a more
accurate saturation rate.
Taking a physical tour of the proposed site and getting a professional estimation of the
costs of this project would have significantly aided the financial analysis.
More investigation on acquiring grants and financial aid for projects of this kind would
have also benefited the financial analysis of this proposal.
Assessing the feasibility of this project as a non-profit establishment and exploring
different funding opportunities and local incentives for creative development would offer
an alternative way of implementing this project.
Overall, I believe I was successful in creating a reliable, objective assessment of this project
given the available information.