Intelibiz Reporting Solution

Intelibiz is a highly scalable cloud based BI platform that provides real time time actionable insights to business across all important functions like Merchandising, Finance, Operations, Supply chain etc. Unlike traditional ERP reporting solutions that are siloed in their architecture, Intelibiz provides businesses with the ability to generate cross functional insights in a matter of seconds. The platform is powered by Industry renowned tableau software leading to highly efficient data architecture and world class security standards. Its cloud based architecture removes the need of having extensive IT hardware on premise leading to better ROI for the business. All the reports and dashboards can be accessed from anywhere in the world across multiple devices enabling faster insights. The entire platform is highly configurable and can be customized as per the specific needs of the business. Deployment takes anywhere between 2 weeks to 6 depending upon the specific need and existing data architecture at the business.

Recommended
Recommended
More Related Content
What's hot
What's hot (20)
Similar to Intelibiz Reporting Solution
Similar to Intelibiz Reporting Solution (20)
Recently uploaded
Recently uploaded (20)
Intelibiz Reporting Solution
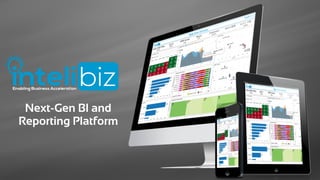
- 1. Next-Gen BI and Reporting Platform
- 2. Our dashboard features The Intelibiz Edge: What are Intelibiz dashboards? We believe that evaluating your business should be easy, effortless, affordable and quick Intelibiz is a fully customisable solution for your business enabling you to get insights at the speed of light Intelligent Dashboards that not only report but help you generate insights Fast Getting to any data at the speed of light Flexible Deployed and modified as per your business needs and preferences
- 3. Meet Our reporting solution Business owners understand and communicate better when exposed to visuals, as compared to plain content. A combination of intuitive design, robust engineering and responsive interface, our intelibiz solution adds effectiveness and purpose to data. Highly responsive dashboards, which enable insights from millions of rows within seconds without the inconvenience of switching views/ reports Completely interactive dashboards with information condensed in few views unlike ERP reporting solutions which has information scattered across multiple reports 100% automated reporting framework with zero manual intervention to update reports, which can be access from anywhere in the world with secure login Flexible and scalable solution which can handle data from practically any datasource and intuitive views which can be designed based on user preference Built on industry leader in visualisation software, tableau, with Best in class visualisations which can make complex data easy-to-understand Rapid fire intelligence Built on tableau Complete Automation & Easy Access Flexible and scalable framework Interactive dashboards Dashboards with Intelligence Dashboards which not only represent data but also have intelligent algorithms built in which would help you evaluate your business performance better and faster
- 4. Dashboards ERP System Reporting Parameters built into reports enabling quick changes 01 Reports to be regenerated for changes in any parameters Ability to handle data external to ERP system02 Only the data that is in ERP can be included in reports Completely customisable and scalable solution03 Only scalable solution Interactive dashboards04 Static dashboards Cross-functional reports and insight generation05 No ability to generate cross-functional reports Pre processed reports lead to quick access to insights06 Time consuming process due to no pre processing Compelling and intuitive visualisations 07 None or Traditional-uninspiring visuals Completely secure solution with easy access with secure login form a computer, tablet or a mobile device 08 Accessible from only within the company network VS
- 5. Modules of InteliBiz reporting solution Executive Dashboards Merchandising Dashboards Marketing Dashboards Inventory Dashboards Operations Dashboards Ecommerce Dashboards Customer Intelligence Dashboards Brand Evaluation Dashboards Business Summary dashboards for high level business overview In-depth Performance review of the assortment Comprehensive view of the promotions and Marketing Dashboards to help review your past and current inventory Dashboards for the supply chain and logistics review In depth performance review of the E-commerce business Dashboards with customer lens to help you understand customer better Comprehensive comparisons and review of the various brands
- 6. How we help businesses stay updated with the latest information?
- 7. Monitor business metrics on the go with automated notifications Receive performance updates on a “whatsapp” like client Enables group discussion on the performance metrics Receive reports at any desired level Accessible from anywhere in the world at low data usage
- 8. Enable stores teams take prompt actions based on regular performance updates Hourly emails with live sales performance Track and Monitor targets real time enabling faster decisions Ground staff gets almost “Real time” feedback on performance Prompt decision making by enabling store owners with insights
- 9. Our dashboard featuresExecutive Dashboards The dashboards not only give a high level overview, but also the ability to dig into any specific area of the business through the filters and drill downs, that gives executives a quick and easy way to view their company’s performance in real-time and take critical decisions A powerful tool for executives which summarises key business performance metrics and presents it in an easy-to-understand and actionable way.
- 10. Our dashboard featuresBrand Dashboards With retailers selling multiple brands, it is crucial for them to monitor brand performance to be able to take timely corrective actions. Our brand evaluation dashboards integrate financial and marketing metrics and provides you a comprehensive platform to evaluate all management efforts
- 11. Our dashboard featuresMarketing Dashboards Traditionally, marketing managers tend to get bogged down in spreadsheets and complex reports to evaluate Marketing strategy. Our suite of Marketing Dashboards combines data from all your marketing sources to get “at-a-glance” insight and weave a complete story about your marketing performance.
- 12. Our dashboard featuresMerchandising Dashboards Merchants and buyers seek to maximize margins through intelligent buying decisions which requires near real time data. Our dashboards address the analytical needs required in the merchandise function by enabling data analysis with the appropriate granularity coupled with access to key product attributes like color, size, style, and vendor
- 13. Our dashboard featuresOperations Dashboards Logistics decisions can make or break a retailer due to the multi-tier supply chain that sits behind almost every enterprise retailer. Poor visibility into the supply chain results in inefficiencies that can be quite costly to the business. Our dashboards enable investigative business discovery capabilities and provide an up- to-date ‘single source of truth allowing supply chain executives to make fast and better decisions
- 14. Our dashboard featuresInventory Dashboards Inventory is the largest balance sheet asset in most multichannel businesses; its effective management largely determines a business’s level of customer service and profit. Our dashboards helps you to monitor inventories by product type, season,cost, customer and a host of other key metrics leading to a more efficient and accurate demand forecasting ultimately resulting in improved customer satisfaction
- 15. Our dashboard featuresCustomer Dashboards Strong customer relationships are key to the success of any business, and even more so in the today’s hyper-competitive market conditions. Our Customer Dashboards are an omni-channel customer intelligence systems that not only integrate customer data but also enriches it with customer segmentation, social media data and profitability to empower marketers to focus on the customer and increase loyalty
- 16. Our dashboard featuresEcommerce Dashboards Our e-commerce dashboards integrate deeply with all the platforms used on your site and allow you to analyze purchase activity , site performance, consumer behaviour and overall business performance. For many ecommerce businesses, reports from sources like google analytics and excel can feel like a confusing set of technical reports and information that’s difficult to navigate and understand.
- 17. Our experience across Industry verticals and Analytics tools Retail Hospitality Technology Banking Healthcare Insurance Industry Verticals Analytics Tools
- 18. Why we chose to develop our solution on Tableau Tableau is a leader in the Gartner Magic Quadrant for Business Intelligence and Analytics Platforms report Cost effective solution which is significantly cheaper than other BI solutions Best in class data visualisation and BI reporting capabilities Broad and sustainable adoption with easy to deploy and learn BI reporting solutions Tableau is the choice of many of the fortune 500 companies for it’s versatility and ease of use
- 19. Hardware requirements We need only a desktop to access the data virtually Our solution based on ✴ Is hosted on a secure cloud or on premise server eliminating the need for physical server. ✴ Tableau infrastructure is hosted in a SAS-70 compliant data centre which provides numerous controls and safeguards over customer data. ✴ Accessible from anywhere in the world with login credentials. ✴ Can be set up and accessed from upto two devices. ✴ Scalable from a few users to many users. ✴ Extremely time efficient and flexible to design and create new reports. VPN
- 20. Solution deployment details Solution Deployed Understanding Business requirements Defining Scope of work Understanding Data and setting up ETLs Report creation Report updation process Data Understanding and Data mart creation Report views created Users provided access to reports Changes made based on business feedback Setting up process for report refreshes Training of the team on how to access reports Training material handed over Benefits - Eliminates the need for a physical server and in- house IT support staff - Data secure in the Tableau environment - Analytics solutions provided in addition to reporting solutions - Actionable insights extracted from the dashboard and shared Data access Reports can be accessed at this point At the time of data availability 3 weeks 3 weeks 1 week 1 week
- 21. you THANK