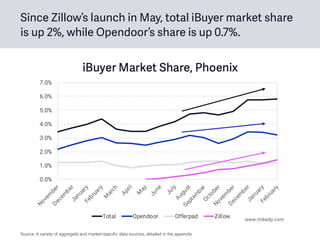
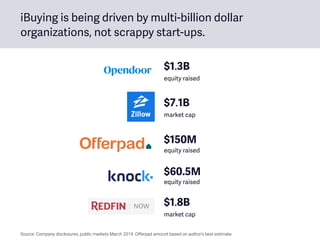
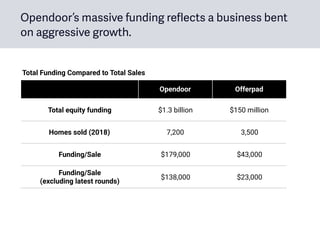
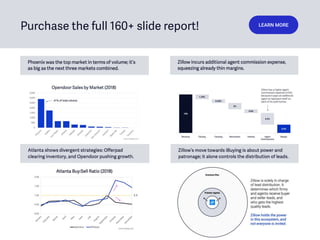
2 0 1 9
The iBuyer Report
Instant buyers, or iBuyers, represent one of the
most revolutionary changes to occur in real estate.
They aim to transform how consumers buy and
sell houses – shaking up a large industry.
Billions of dollars have been invested into iBuying
since 2014, and the field is led by ambitious, well-
funded, and well-equipped disruptors.
I’ve been studying iBuyers for years: conducting
extensive research, talking to the top players, and
extracting strategic insights. Let this report
calibrate our thinking on iBuyers and the impact
they are – and will – have on the global industry.
Mike DelPrete
April 2019
Introducing The iBuyer Report
“I've been impressed with Mike's ability to extract insights from
the current market and consumer trends, and have the foresight
to make predictions of what's coming next.”
Eric Wu, CEO & Co-founder, Opendoor
iBuyer Report Testimonials
Brian Bair, CEO & Co-founder, Offerpad
“Mike’s comprehensive analysis is the best in the industry. The
knowledge he provides to the market is unparalleled.”
Table of Contents
1. Overview
2. Funding
3. Revenues
4. Unit Economics
5. iBuyer Markets
6. Market Expansion
7. Phoenix Deep Dive
8. Zillow’s iBuyer Strategy
9. The Consumer Journey
10. Working with Agents
11. Opendoor vs. Zillow
12. Incumbents React
13. International iBuyers
14. Future of iBuying
Overview
iBuyers buy homes directly from consumers, turning
the traditional home selling process on its head.
The iBuyer movement is led by Opendoor, founded in
2014, and currently the world’s largest iBuyer.
• Opendoor buys homes directly from consumers, quickly
spruces them up, and resells them on the open market.
• As of April 2019, Opendoor has raised over $1.3 billion in
equity, $3 billion in debt, and is valued at close to $4 billion.
• Opendoor offers a compelling customer proposition focused
on speed, certainty, and simplicity.
Nationally, in 2018, iBuyers accounted for over 25,000
transactions, or 0.2 percent market share.
0.2%

National Market Share
Includes over 15,000 purchases and over 10,000 sales.
National market share includes all transactions, and is
not limited by geography or price range.
Total iBuyer purchases 15,000+
Total iBuyer sales 10,000+
Total national transactions 5.5 million
National iBuyer market share 0.2%
National Market Share Calculations: 2018
Source: A variety of aggregate and market-specific data sources, detailed in the appendix.
In Phoenix (the biggest iBuyer market), iBuyers have
nearly 6% market share, with Opendoor the largest.
6%

All iBuyers
Based on February 2019 transactions.
3%

Opendoor
iBuyer market share in Phoenix has steadily increased,
up to nearly 6 percent in Feb 2019.
Source: A variety of aggregate and market-specific data sources, detailed in the appendix.
Since Zillow’s launch in May, total iBuyer market share
is up 2%, while Opendoor’s share is up 0.7%.
Source: A variety of aggregate and market-specific data sources, detailed in the appendix.
Included Excluded
Single-family detached, townhouse and condos New homes
Short sales and pre-foreclosures Mobile and manufactured homes
Normal sales through MLS and outside MLS Bank-owned homes
Investor purchases and sales GSE-owned homes
Maricopa and Pinal counties HUD-owned homes
All price ranges Trustee sales
Sheriff sales
IRS sales
Sales under eminent domain
Bulk sales (e.g. investor to investor)
7,347 + 7,347
446 + 409
= 5.8%February:
Total market share numbers are based on reasonable
criteria to define the “total market.”
Funding
iBuying is being driven by multi-billion dollar
organizations, not scrappy start-ups.
$150M

equity raised
$60.5M

equity raised
$7.1B

market cap
$1.3B

equity raised
$1.8B 

market cap
Source: Company disclosures, public markets March 2019. Offerpad amount based on author’s best estimate.
In the world of pure-play iBuyers,
there is a widening gap between
Opendoor and the rest.
Opendoor has raised nearly 10 times the amount of
equity funding than its closest competitor.
Source: Company disclosures. Offerpad amount based on author’s best estimate.
In 2018, Opendoor purchased more than 3 times the
number of homes than its closest competitor.
Source: A variety of aggregate and market-specific data sources, detailed in the appendix.
In 2018, Opendoor purchased more than 3 times the
number of homes than its closest competitor.
While Redfin claims it is neither the most nor least aggressive
iBuyer in the space, the data suggests otherwise.
And Opendoor sold twice the number of homes than
its nearest competitor in 2018.
Source: Company press releases and direct sources.
In terms of headcount, Opendoor has three times the
number of employees than the competition.
Offerpad Knock
Total equity funding 9x 21x
Homes purchased (2018) 3x 43x
Homes sold (2018) 2x 36x
Employees 3x 13x
Opendoor’s Size vs. Competitors
With its massive funding and growth, Opendoor is
exponentially pulling ahead of direct competitors.
Opendoor Offerpad
Total equity funding $1.3 billion $150 million
Homes sold (2018) 7,200 3,500
Funding/Sale $179,000 $43,000
Funding/Sale

(excluding latest rounds)
$138,000 $23,000
Total Funding Compared to Total Sales
Opendoor’s massive funding reflects a business bent
on aggressive growth.
The iBuyer business model works best at scale: higher
profits, less risk, and economies of scale.
Few markets
• Low profits and low revenues
(low margin)
• Market concentration risk in
single-market slowdowns
• Limited economies of scale 

(tech, procurement, other)
• Per market advertising, one-
off and expensive
• Less volume, less favorable
financing terms
Many markets
• Higher profits and higher
revenues (low margin)
• Market diversification hedges
against single-market slowdown
• Ecosystem economies of scale
(greater buying power)
• National brand marketing
economies of scale
• More volume, more favorable
financing terms
From a funding perspective, VCs, investors and
smaller start-ups face two key questions.
• Is the iBuyer model winner take all or winner take most; does
the company with the deepest pockets win?
• Will an iBuyer model work in a small(er) geographic footprint,
or does it only work at scale?
With small profit margins, iBuyer businesses are only
meaningfully profitable at scale (like Amazon).
Revenues
iBuyers have two sources of revenue: service fees, and
the spread on the houses they buy and sell.
Revenue = Service fee + Price appreciation
The difference between
what an iBuyer buys and
subsequently sells a
house for.
The fee
charged to the
home seller.
3%–8%6%–10%
Note: These are gross revenue numbers, and don’t include costs. More details in the unit economics section.
Unlike traditional home flippers, the data suggests
that iBuyers are making fair offers on homes.
• A recent analysis shows Zillow and other iBuyers making
offers around 98% of a home’s Zestimate value.
• Offerpad tracks the eventual sale price of the homes it makes
an offer on but doesn’t end up buying, and the sale price is
2.3% higher.
• The most recent month’s buy/sell spread in Phoenix is
between 4%–6% (this doesn’t include fix-up costs, and a sale
price premium for new paint, carpets, and other upgrades).
The evidence suggests that iBuyers make fair offers on the
homes they buy: perhaps 1%–3% below market value.
There are different ways to account for revenue which
include or exclude the full value of the home.
Gross revenue Includes the total home sale value as revenue.
Net revenue
Only includes the service fee and price appreciation 

as revenue.
The big iBuyers operate high gross revenue
businesses, with small profit margins.
Opendoor Offerpad Zillow
Total home sales 7,200 3,500 177
Gross revenue $1.7 billion $840 million $52 million
Net revenue $200 million $118 million $4.5 million
Net revenue per home $27,800 $33,600 $25,000
Net margin Anywhere from 0%–5% 0%–1%
Revenue Build-up: 2018
Note: Net revenue calculations based on 7% service fee and the average price appreciation and sold home price for each iBuyer. Net margin
based on author’s estimates, and Zillow’s public disclosures.
Zillow’s 3–5 year target is $20 billion in revenues,
60,000 houses per year, and a net margin of 0%–3%.
Opendoor Offerpad Zillow Zillow Target
Total home sales 7,200 3,500 177 60,000
Gross revenue $1.7 billion $840 million $52 million $20 billion
Net revenue $200 million $118 million $4.5 million $1.9 billion
Net revenue per home $27,800 $33,600 $25,000 $32,300
Net margin Anywhere from 0%–5% 0%–1% 0%–3%
Revenue Build-up: 2018 and Beyond
Note: Net revenue calculations based on 7% service fee and the average price appreciation and sold home price for each iBuyer. Net margin
based on author’s estimates, and Zillow’s public disclosures.
Zillow’s 3–5 year goals are aggressive, both in volumes
and profitability.
Current Target
Houses Bought per Month ~250 5,000
National Market Share - 1%
EBITDA* 0%–0.6% 0%–3%
Target EBITDA per Home* $0–$1,700 $0–$10,000
*Range includes “Adjusted EBITDA” vs. EBITDA with share-based compensation included. It’s an accounting thing.
Zillow Offers Per Home Profit: Actuals vs. Target
Opendoor’s net revenue is increasing – and
accelerating – nicely over time.
Source: Estimates based on market traction figures.
Opendoor’s net revenue build-up includes actuals
from in-market performance.
2018
Total home sales 7,200
Average home price $240,000
Service fee 7%
Price appreciation per home $11,000
Net revenue $200,000,000
Opendoor Net Revenue Build-up
Based on Phoenix
From its web site
Based on Phoenix
Or plug in whatever
estimates you like!
Purchase the full 160+ slide report! LEARN MORE
• Unit Economics
• iBuyer Markets
• Market Expansion
• Phoenix Deep Dive
• Zillow’s iBuyer Strategy
• The Consumer Journey
• Working with Agents
• Opendoor vs. Zillow
• Incumbents React
• International iBuyers
• Future of iBuying
Get the full picture – don’t miss the following sections:
I’m a global real estate tech strategist, and a
scholar-in-residence at the University of Colorado
Boulder. I’m a former tech entrepreneur, CEO, and
strategy director with broad expertise in online real
estate tech.
I’ve travelled the world talking to and working with
leading property portals and real estate tech
businesses, gathering first-hand knowledge and
insights on industry trends and themes. I advise
corporates, work with startups, mentor founders
and executives, and work on challenging
entrepreneurial projects.
About the author: Mike DelPrete
www.mikedp.com Mailing list mike@mikedp.com
I split my time between research & writing, teaching,
and working with select clients.
Start-up

Advisor
I’m leading the University’s new
Real Estate Tech program, one of
the world’s first.

www.curealestatetech.com
I’m a strategy and new ventures
consultant for businesses of all sizes,
with a focus on real estate portals
and disruptive models in real estate
tech. Learn more ⟶
I advise and invest in a select group
of real estate tech start-ups and
growth-stage businesses around
the world. Learn more ⟶
Strategy

Consultant
My other industry reports
An evidence-based, 130+ slide
presentation looking at the top real
estate portals from around the world.
A 190+ slide presentation where I take
a global view of emerging models in
real estate that are changing the way
consumers buy and sell houses.
Appendix:

Data Accuracy
The data is based on tracking over
60 different buying entities used
by the major iBuyers.
Source: https://www.opendoor.com/w/blog/opendoor-year-in-review-celebrating-the-moves-you-made-in-2018
Data accuracy is important! A number of data points
confirm the accuracy of the data in this report.
Buys Sales
Opendoor’s first blog post 10,400 6,800
Opendoor’s revised blog post “Over 10,000” “Over 6,000”
My numbers 10,409 7,252
Difference 0.08% 6.2%
Opendoor released some 2018 numbers in a blog post, which it
subsequently revised. Both data points align with this report’s data.
This is likely a timing issue.
Multiple external data sources have been used. In
Phoenix, the difference is less than 3 percent.
Buys Sells
Data Source #1 3,053 2,903
Data Source #2 3,124 2,837
Difference 2.3% 2.2%
Phoenix Data Accuracy
In discussions with me, Opendoor and Offerpad have
offered slightly higher volume numbers.
• In both cases, the claims for 2018 volumes (purchases and
sales) were 2%–9% higher than the numbers in this report.
• I believe the discrepancy is timing: signed agreements,
finalized contracts, closing, and recording the public property
record all leave open a margin of error.
• No market data will be 100% accurate. However, the evidence
suggests differences of only a few percentage points – quite

enough for a broad analysis.
A note on data sources
The data sources include company reports, investor presentations, earnings
calls (and transcripts), public property records, MLS data, company web site
listing data, and public records sourced from various listing portals. All
information used is in the public domain. No confidential information has been
used in this report. Some data has been estimated from financial statements
and other known data points.
Additional aggregate market data provided by Attom Data Solutions.
Copyright © Mike DelPrete

The iBuyer Report (Preview)

  • 1.
    2 0 19 The iBuyer Report
  • 2.
    Instant buyers, oriBuyers, represent one of the most revolutionary changes to occur in real estate. They aim to transform how consumers buy and sell houses – shaking up a large industry. Billions of dollars have been invested into iBuying since 2014, and the field is led by ambitious, well- funded, and well-equipped disruptors. I’ve been studying iBuyers for years: conducting extensive research, talking to the top players, and extracting strategic insights. Let this report calibrate our thinking on iBuyers and the impact they are – and will – have on the global industry. Mike DelPrete April 2019 Introducing The iBuyer Report
  • 3.
    “I've been impressedwith Mike's ability to extract insights from the current market and consumer trends, and have the foresight to make predictions of what's coming next.” Eric Wu, CEO & Co-founder, Opendoor iBuyer Report Testimonials Brian Bair, CEO & Co-founder, Offerpad “Mike’s comprehensive analysis is the best in the industry. The knowledge he provides to the market is unparalleled.”
  • 4.
    Table of Contents 1.Overview 2. Funding 3. Revenues 4. Unit Economics 5. iBuyer Markets 6. Market Expansion 7. Phoenix Deep Dive 8. Zillow’s iBuyer Strategy 9. The Consumer Journey 10. Working with Agents 11. Opendoor vs. Zillow 12. Incumbents React 13. International iBuyers 14. Future of iBuying
  • 5.
  • 6.
    iBuyers buy homesdirectly from consumers, turning the traditional home selling process on its head.
  • 7.
    The iBuyer movementis led by Opendoor, founded in 2014, and currently the world’s largest iBuyer. • Opendoor buys homes directly from consumers, quickly spruces them up, and resells them on the open market. • As of April 2019, Opendoor has raised over $1.3 billion in equity, $3 billion in debt, and is valued at close to $4 billion. • Opendoor offers a compelling customer proposition focused on speed, certainty, and simplicity.
  • 8.
    Nationally, in 2018,iBuyers accounted for over 25,000 transactions, or 0.2 percent market share. 0.2%
 National Market Share Includes over 15,000 purchases and over 10,000 sales.
  • 9.
    National market shareincludes all transactions, and is not limited by geography or price range. Total iBuyer purchases 15,000+ Total iBuyer sales 10,000+ Total national transactions 5.5 million National iBuyer market share 0.2% National Market Share Calculations: 2018 Source: A variety of aggregate and market-specific data sources, detailed in the appendix.
  • 10.
    In Phoenix (thebiggest iBuyer market), iBuyers have nearly 6% market share, with Opendoor the largest. 6%
 All iBuyers Based on February 2019 transactions. 3%
 Opendoor
  • 11.
    iBuyer market sharein Phoenix has steadily increased, up to nearly 6 percent in Feb 2019. Source: A variety of aggregate and market-specific data sources, detailed in the appendix.
  • 12.
    Since Zillow’s launchin May, total iBuyer market share is up 2%, while Opendoor’s share is up 0.7%. Source: A variety of aggregate and market-specific data sources, detailed in the appendix.
  • 13.
    Included Excluded Single-family detached,townhouse and condos New homes Short sales and pre-foreclosures Mobile and manufactured homes Normal sales through MLS and outside MLS Bank-owned homes Investor purchases and sales GSE-owned homes Maricopa and Pinal counties HUD-owned homes All price ranges Trustee sales Sheriff sales IRS sales Sales under eminent domain Bulk sales (e.g. investor to investor) 7,347 + 7,347 446 + 409 = 5.8%February: Total market share numbers are based on reasonable criteria to define the “total market.”
  • 14.
  • 15.
    iBuying is beingdriven by multi-billion dollar organizations, not scrappy start-ups. $150M
 equity raised $60.5M
 equity raised $7.1B
 market cap $1.3B
 equity raised $1.8B 
 market cap Source: Company disclosures, public markets March 2019. Offerpad amount based on author’s best estimate.
  • 16.
    In the worldof pure-play iBuyers, there is a widening gap between Opendoor and the rest.
  • 17.
    Opendoor has raisednearly 10 times the amount of equity funding than its closest competitor. Source: Company disclosures. Offerpad amount based on author’s best estimate.
  • 18.
    In 2018, Opendoorpurchased more than 3 times the number of homes than its closest competitor. Source: A variety of aggregate and market-specific data sources, detailed in the appendix.
  • 19.
    In 2018, Opendoorpurchased more than 3 times the number of homes than its closest competitor. While Redfin claims it is neither the most nor least aggressive iBuyer in the space, the data suggests otherwise.
  • 20.
    And Opendoor soldtwice the number of homes than its nearest competitor in 2018.
  • 21.
    Source: Company pressreleases and direct sources. In terms of headcount, Opendoor has three times the number of employees than the competition.
  • 22.
    Offerpad Knock Total equityfunding 9x 21x Homes purchased (2018) 3x 43x Homes sold (2018) 2x 36x Employees 3x 13x Opendoor’s Size vs. Competitors With its massive funding and growth, Opendoor is exponentially pulling ahead of direct competitors.
  • 23.
    Opendoor Offerpad Total equityfunding $1.3 billion $150 million Homes sold (2018) 7,200 3,500 Funding/Sale $179,000 $43,000 Funding/Sale
 (excluding latest rounds) $138,000 $23,000 Total Funding Compared to Total Sales Opendoor’s massive funding reflects a business bent on aggressive growth.
  • 24.
    The iBuyer businessmodel works best at scale: higher profits, less risk, and economies of scale. Few markets • Low profits and low revenues (low margin) • Market concentration risk in single-market slowdowns • Limited economies of scale 
 (tech, procurement, other) • Per market advertising, one- off and expensive • Less volume, less favorable financing terms Many markets • Higher profits and higher revenues (low margin) • Market diversification hedges against single-market slowdown • Ecosystem economies of scale (greater buying power) • National brand marketing economies of scale • More volume, more favorable financing terms
  • 25.
    From a fundingperspective, VCs, investors and smaller start-ups face two key questions. • Is the iBuyer model winner take all or winner take most; does the company with the deepest pockets win? • Will an iBuyer model work in a small(er) geographic footprint, or does it only work at scale? With small profit margins, iBuyer businesses are only meaningfully profitable at scale (like Amazon).
  • 26.
  • 27.
    iBuyers have twosources of revenue: service fees, and the spread on the houses they buy and sell. Revenue = Service fee + Price appreciation The difference between what an iBuyer buys and subsequently sells a house for. The fee charged to the home seller. 3%–8%6%–10% Note: These are gross revenue numbers, and don’t include costs. More details in the unit economics section.
  • 28.
    Unlike traditional homeflippers, the data suggests that iBuyers are making fair offers on homes. • A recent analysis shows Zillow and other iBuyers making offers around 98% of a home’s Zestimate value. • Offerpad tracks the eventual sale price of the homes it makes an offer on but doesn’t end up buying, and the sale price is 2.3% higher. • The most recent month’s buy/sell spread in Phoenix is between 4%–6% (this doesn’t include fix-up costs, and a sale price premium for new paint, carpets, and other upgrades). The evidence suggests that iBuyers make fair offers on the homes they buy: perhaps 1%–3% below market value.
  • 29.
    There are differentways to account for revenue which include or exclude the full value of the home. Gross revenue Includes the total home sale value as revenue. Net revenue Only includes the service fee and price appreciation 
 as revenue.
  • 30.
    The big iBuyersoperate high gross revenue businesses, with small profit margins. Opendoor Offerpad Zillow Total home sales 7,200 3,500 177 Gross revenue $1.7 billion $840 million $52 million Net revenue $200 million $118 million $4.5 million Net revenue per home $27,800 $33,600 $25,000 Net margin Anywhere from 0%–5% 0%–1% Revenue Build-up: 2018 Note: Net revenue calculations based on 7% service fee and the average price appreciation and sold home price for each iBuyer. Net margin based on author’s estimates, and Zillow’s public disclosures.
  • 31.
    Zillow’s 3–5 yeartarget is $20 billion in revenues, 60,000 houses per year, and a net margin of 0%–3%. Opendoor Offerpad Zillow Zillow Target Total home sales 7,200 3,500 177 60,000 Gross revenue $1.7 billion $840 million $52 million $20 billion Net revenue $200 million $118 million $4.5 million $1.9 billion Net revenue per home $27,800 $33,600 $25,000 $32,300 Net margin Anywhere from 0%–5% 0%–1% 0%–3% Revenue Build-up: 2018 and Beyond Note: Net revenue calculations based on 7% service fee and the average price appreciation and sold home price for each iBuyer. Net margin based on author’s estimates, and Zillow’s public disclosures.
  • 32.
    Zillow’s 3–5 yeargoals are aggressive, both in volumes and profitability. Current Target Houses Bought per Month ~250 5,000 National Market Share - 1% EBITDA* 0%–0.6% 0%–3% Target EBITDA per Home* $0–$1,700 $0–$10,000 *Range includes “Adjusted EBITDA” vs. EBITDA with share-based compensation included. It’s an accounting thing. Zillow Offers Per Home Profit: Actuals vs. Target
  • 33.
    Opendoor’s net revenueis increasing – and accelerating – nicely over time. Source: Estimates based on market traction figures.
  • 34.
    Opendoor’s net revenuebuild-up includes actuals from in-market performance. 2018 Total home sales 7,200 Average home price $240,000 Service fee 7% Price appreciation per home $11,000 Net revenue $200,000,000 Opendoor Net Revenue Build-up Based on Phoenix From its web site Based on Phoenix Or plug in whatever estimates you like!
  • 35.
    Purchase the full160+ slide report! LEARN MORE
  • 36.
    Purchase the full160+ slide report! LEARN MORE • Unit Economics • iBuyer Markets • Market Expansion • Phoenix Deep Dive • Zillow’s iBuyer Strategy • The Consumer Journey • Working with Agents • Opendoor vs. Zillow • Incumbents React • International iBuyers • Future of iBuying Get the full picture – don’t miss the following sections:
  • 38.
    I’m a globalreal estate tech strategist, and a scholar-in-residence at the University of Colorado Boulder. I’m a former tech entrepreneur, CEO, and strategy director with broad expertise in online real estate tech. I’ve travelled the world talking to and working with leading property portals and real estate tech businesses, gathering first-hand knowledge and insights on industry trends and themes. I advise corporates, work with startups, mentor founders and executives, and work on challenging entrepreneurial projects. About the author: Mike DelPrete www.mikedp.com Mailing list mike@mikedp.com
  • 39.
    I split mytime between research & writing, teaching, and working with select clients. Start-up
 Advisor I’m leading the University’s new Real Estate Tech program, one of the world’s first. www.curealestatetech.com I’m a strategy and new ventures consultant for businesses of all sizes, with a focus on real estate portals and disruptive models in real estate tech. Learn more ⟶ I advise and invest in a select group of real estate tech start-ups and growth-stage businesses around the world. Learn more ⟶ Strategy
 Consultant
  • 40.
    My other industryreports An evidence-based, 130+ slide presentation looking at the top real estate portals from around the world. A 190+ slide presentation where I take a global view of emerging models in real estate that are changing the way consumers buy and sell houses.
  • 41.
  • 42.
    The data isbased on tracking over 60 different buying entities used by the major iBuyers.
  • 43.
    Source: https://www.opendoor.com/w/blog/opendoor-year-in-review-celebrating-the-moves-you-made-in-2018 Data accuracyis important! A number of data points confirm the accuracy of the data in this report. Buys Sales Opendoor’s first blog post 10,400 6,800 Opendoor’s revised blog post “Over 10,000” “Over 6,000” My numbers 10,409 7,252 Difference 0.08% 6.2% Opendoor released some 2018 numbers in a blog post, which it subsequently revised. Both data points align with this report’s data.
  • 44.
    Data accuracy isimportant! A number of data points confirm the accuracy of the data in this report. Buys Sales Opendoor’s first blog post 10,400 6,800 Opendoor’s revised blog post “Over 10,000” “Over 6,000” My numbers 10,409 7,252 Difference 0.08% 6.2% Opendoor released some 2018 numbers in a blog post, which it subsequently revised. Both data points align with this report’s data. This is likely a timing issue.
  • 45.
    Multiple external datasources have been used. In Phoenix, the difference is less than 3 percent. Buys Sells Data Source #1 3,053 2,903 Data Source #2 3,124 2,837 Difference 2.3% 2.2% Phoenix Data Accuracy
  • 46.
    In discussions withme, Opendoor and Offerpad have offered slightly higher volume numbers. • In both cases, the claims for 2018 volumes (purchases and sales) were 2%–9% higher than the numbers in this report. • I believe the discrepancy is timing: signed agreements, finalized contracts, closing, and recording the public property record all leave open a margin of error. • No market data will be 100% accurate. However, the evidence suggests differences of only a few percentage points – quite
 enough for a broad analysis.
  • 47.
    A note ondata sources The data sources include company reports, investor presentations, earnings calls (and transcripts), public property records, MLS data, company web site listing data, and public records sourced from various listing portals. All information used is in the public domain. No confidential information has been used in this report. Some data has been estimated from financial statements and other known data points. Additional aggregate market data provided by Attom Data Solutions.
  • 48.