1. Determination of Peak Pressure Using
F-Scan ® Sensors
Dr. Valdevit, Michelle Osorio, Bijan Mohazab
Introduction
• The Tekscan® F-Scan ® system : in-shoe
plantar pressure analysis used effectively
in gait analysis to provide dynamic
pressure values.
• The system was tested to find peak
pressure and location of peak pressure by
having each subject engage in a multitude
of positions with his/her eyes opened or
closed on both two feet and on the
dominant foot.
Results
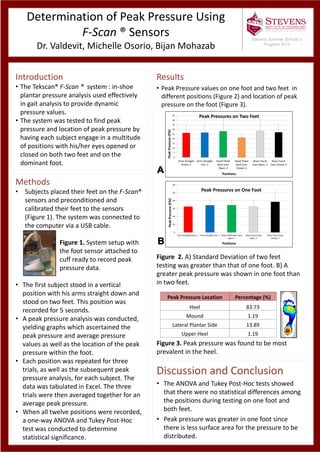
• Peak Pressure values on one foot and two feet in
different positions (Figure 2) and location of peak
pressure on the foot (Figure 3).
Figure 2. A) Standard Deviation of two feet
testing was greater than that of one foot. B) A
greater peak pressure was shown in one foot than
in two feet.
Figure 3. Peak pressure was found to be most
prevalent in the heel.
Methods
• Subjects placed their feet on the F-Scan®
sensors and preconditioned and
calibrated their feet to the sensors
(Figure 1). The system was connected to
the computer via a USB cable.
Figure 1. System setup with
the foot sensor attached to
cuff ready to record peak
pressure data.
• The first subject stood in a vertical
position with his arms straight down and
stood on two feet. This position was
recorded for 5 seconds.
• A peak pressure analysis was conducted,
yielding graphs which ascertained the
peak pressure and average pressure
values as well as the location of the peak
pressure within the foot.
• Each position was repeated for three
trials, as well as the subsequent peak
pressure analysis, for each subject. The
data was tabulated in Excel. The three
trials were then averaged together for an
average peak pressure.
• When all twelve positions were recorded,
a one-way ANOVA and Tukey Post-Hoc
test was conducted to determine
statistical significance.
Discussion and Conclusion
• The ANOVA and Tukey Post-Hoc tests showed
that there were no statistical differences among
the positions during testing on one foot and
both feet.
• Peak pressure was greater in one foot since
there is less surface area for the pressure to be
distributed.
Stevens Summer Scholar’s
Program 2014
0
5
10
15
20
25
30
35
40
45
Arms Straight
Down, 2
Arms Straight
Out, 2
Head Tilted
Back Eyes
Open, 2
Head Tilted
Back Eyes
Closed, 2
Nose Touch
Eyes Open, 2
Nose Touch
Eyes Closed, 2
PeakPressure(PSI)
Positions
Peak Pressures on Two Feet
0
10
20
30
40
50
60
Arms Straight Down, 1 Arms Straight Out, 1 Head Tilted Back Eyes
Open, 1
Nose Touch Eyes
Open, 1
Nose Touch Eyes
Closed, 1
PeakPressure(PSI)
Positions
Peak Pressures on One Foot
Peak Pressure Location Percentage (%)
Heel 83.73
Mound 1.19
Lateral Plantar Side 13.89
Upper Heel 1.19