1. Determination of Average Foot Pressure Using
F-Scan ® Sensors
Dr. Antonio Valdevit, Bijan Mohazab, Michelle Osorio
Introduction
• The Tekscan F-Scan ® system : in-shoe
plantar pressure analysis provided
dynamic pressure values through gait
analysis that were studied and statistically
analyzed.
• The average foot pressure generated was
determined by having each subject engage
in a multitude of positions with his/her
eyes opened or closed on both two feet
and on the dominant foot.
Results
• For each position, the three trials were
averaged and separated into graphs based
on the use of two feet (A) or one foot (B).
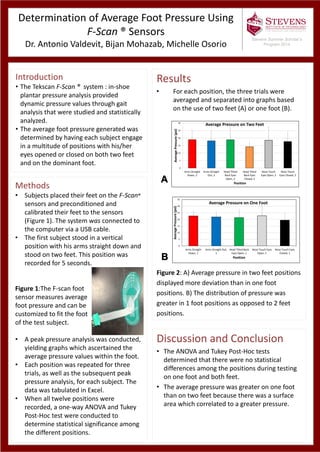
Figure 2: A) Average pressure in two feet positions
displayed more deviation than in one foot
positions. B) The distribution of pressure was
greater in 1 foot positions as opposed to 2 feet
positions.
Methods
• Subjects placed their feet on the F-Scan®
sensors and preconditioned and
calibrated their feet to the sensors
(Figure 1). The system was connected to
the computer via a USB cable.
• The first subject stood in a vertical
position with his arms straight down and
stood on two feet. This position was
recorded for 5 seconds.
Figure 1:The F-scan foot
sensor measures average
foot pressure and can be
customized to fit the foot
of the test subject.
• A peak pressure analysis was conducted,
yielding graphs which ascertained the
average pressure values within the foot.
• Each position was repeated for three
trials, as well as the subsequent peak
pressure analysis, for each subject. The
data was tabulated in Excel.
• When all twelve positions were
recorded, a one-way ANOVA and Tukey
Post-Hoc test were conducted to
determine statistical significance among
the different positions.
Discussion and Conclusion
• The ANOVA and Tukey Post-Hoc tests
determined that there were no statistical
differences among the positions during testing
on one foot and both feet.
• The average pressure was greater on one foot
than on two feet because there was a surface
area which correlated to a greater pressure.
Stevens Summer Scholar’s
Program 2014
0
5
10
15
20
25
30
35
Arms Straight
Down, 1
Arms Straight Out,
1
Head Tilted Back
Eyes Open, 1
Nose Touch Eyes
Open, 1
Nose Touch Eyes
Closed, 1
AveragePressure(psi)
Position
Average Pressure on One Foot
0
5
10
15
20
25
30
Arms Straight
Down, 2
Arms Straight
Out, 2
Head Tilted
Back Eyes
Open, 2
Head Tilted
Back Eyes
Closed, 2
Nose Touch
Eyes Open, 2
Nose Touch
Eyes Closed, 2AveragePressure(psi)
Position
Average Pressure on Two Feet