SlideShare a Scribd company logo
1 of 88
All Microbes Live in an Aqueous
Environment
• Ecology of aquatic
environments is complex
• Most aquatic
environments are
teaming with life
• Microbes have evolved to
live in:
– Saturated salt solutions
– Below freezing to >110°C
– Waters full of toxic
substance , i.e. copper,
cyanide, lead, silver,
gasoline, oil, benzene, and
many others
Water Quality in TN (2004)*
• Sources of Agricultural Pollution in
Assessed Streams and Rivers
– Grazing related 60 %
– Crop related 37 %
– Intensive Animal Ops. 3 %
* TN 305 (b) Report 2004
Terminology
• Potable - (clean) water – free of all
objectionable material, including pathogens,
tastes, odors, colors, toxins, radioactive material,
organisms, oils, gases, etc.
• Fresh – non-salt or sea water
• Pollution – anything that makes it Non-Potable
• Sewage – the community waste or garbage that
mother nature and we dump onto sewers or land
Typical Water Quality Standards
• Drinking Water
– No coliforms contamination
acceptable
• Recreational water
– 200 fecal coliforms /100 ml
• Fish and wildlife habitat
– 5000 fecal coliforms/100 ml
• Shellfish
– 14 fecal coliforms/100 ml
Most Probable Number
• 10 ml, 1 ml and 0.1ml of water inoculated
in lactose broth
• Coliforms identified by gas production
• Refer to tables and determine statistical
range of number of coliforms
Does not:
Detect total number of bacteria
Specific pathogens
Bacteria Disease/ infection Symptoms
Aeromonas Enteritis Very thin, blood- and
mucus-containing diarrhea
Campylobacter jejuni Campilobacteriose Flue, diarrhea, head- and
stomachaches, fever,
cramps and nausea
Escherichia coli Urinary tract infections,
neonatal meningitis,
intestinal disease
Watery diarrhea,
headaches, fever, homiletic
uremia, kidney damage
Plesiomonas shigelloides Plesiomonas-infection Nausea, stomachaches and
watery diarrhea, sometimes
fevers, headaches and
vomiting
Typhus Typhoid fever Fevers
Salmonella
Salmonellosis Sickness, intestinal cramps,
vomiting, diarrhea and
sometimes light fevers
Streptococcus (Gastro) intestinal disease Stomach aches, diarrhea
and fevers, sometimes
vomiting
Vibrio El Tor (freshwater) (Light form of) Cholera Heavy diarrhea
Bacteria Found In Surface Water
Pathogens of Most Concern on
Fresh Produce
• Salmonella Shigella
• Escherichia coli Campylobacter
• Yersinia entercolitica Staphylococcus aureus
• Clostridium species Bacillus cereus
• Vibrio species
• Viruses (Hepatitis A, Norwalk)
• Parasites/Protozoa- (Giardia, Entamoeba, Toxoplasma,
Sarccystis, Isopora, Cryptosporidium, Eimeria, Cyclospora)
Vibrio species
Waterborne Infectious Disease
(U.S. 1997-1998)
Disease Agent Outbreaks Cases
Shigellosis Shigella sonnei 1 183
Giardiasis Giardia lambia 4 159
Cryptoporidiosis Cryptosporidium parvum 2 1432
Gastroenteritis E. Coli 0157:H7 3 164
Acute Unknown 5 163
gastrointestinal
illness
Shigella
Other Important Water Transmitted Organisms
• Vibrio cholerae
– Prevalent in U. S. in 1800’s
– Currently common in Asia, Africa, Latin
America
– Over 100,000 deaths and 2345 deaths in
2004
– Transmitted through water, fresh vegetables
and shellfish
Microrganism Disease Symptoms
Amoeba Amoebic dysentery Severe diarrhea, headache, abdominal pain,
chills, fever; if not treated can cause liver
abscess, bowel perforation and death
Cryptosporidium
parvum
Cryptosporidiosis Feeling of sickness, watery diarrhea, vomiting,
lack of appetite
Giardia Giardiasis Diarrhea, abdominal cramps, flatulence, belching,
fatigue
Toxoplasm
gondii
Toxoplasmosis Flu, swelling of lymph glands
With pregnant women subtle abortion and brain
infections
Protozoa Found in Surface Water
Giardiasis and Cryptosporidiosis
• Both are protozoans
• Transmission through
water (97% of all surface water
carry cysts)
• Resistant to chlorine, but
can be filtered
• 1993 Milwaukee outbreak
(100,000)
Some Costly Cases
• Cryptosporidium, 1993, Milwaukee, $55
million
• Pfiesteria piscicida, 1997, Chesapeake
bay, $43 million
• 3700 beach closing in 1996
Mild case of diarrhea cost ~$280 for
treatment and diagnosis
Life cycle of Cryptospoidium
Transmission occurs mainly through
Contaminated water.
Agricultural Water
• Identify source and distribution of
water used
• Be aware of current and historical
use of land
• Review existing practices and
conditions to identify potential
sources of contamination.
• Maintain wells in good working
condition
• How are you applying the water?
Minimize contact of edible portion
of fresh produce with contaminated
irrigation water.
Water Source Irrigation Pesticide App. Hand Produce
wash wash
Open source, canal,
Reservoir, pond, etc.
Munciple water source
Capped well, Annual test date
Uncapped well, canal,
reservoir, etc.
Quarterly test date
Municipal water source
Quality report date
Y N Y N Y N
Y N Y N Y N
Y N
Y N
Water Quality Evaluation Log
Public Health and Water Supply
Routine monitoring of water quality using
indicator organisms, indicating fecal
contamination.
To determine if fecal coliforms are from
humans or other animals – must test for
fecal streptococci
Fecal coliform/fecal streptococci ratios
for humans and other animals
Human 4.4
Duck 0.6
Sheep 0.4
Chicken 0.4
Pig 0.4
Cow 0.2
Turkey 0.1
Characteristics of a Useful Indicator
• Useful for all water types
• Always present when pathogens
are present
• Not present in the absence of the
pathogen
• Correlated with degree of
pollution
• More easily detectable than a
pathogen
• Survive longer than the pathogen
• Not dangerous to work with
Bacterial-Indicator Organisms
Common Groups
• Coliforms
 Total coliforms
 Fecal coliforms
 Escherichia coli
• Streptococci
 fecal streptococci
 enterococci
• Spore Formers
Clostridium
perfringens
Indicator Organisms
• General coliforms – indicate
water in contact with plant or
animal life (universally present)
• Fecal coliforms – mammal or
bird feces in water
• Enterococcus bacteria (type of
fecal streptococci)– feces from warm
blooded animals in water
These are not what generally make
people sick
Problems With the Coliform Indicator Test
False Positives
Enterobacter areogenes
False Negatives
Salmonella typhi
Some Factors Affecting Ratio of Indicator
Organisms to Pathogens
• Feces from human populations with higher
infection rates are of greater concern
• All treatment methods and environmental
conditions affect pathogens and indicators
differently
- Chlorinated water may have zero indicators and pathogens, but
loaded with viruses.
- Pathogens can “hide” from treatment inside suspended solids.
The ratio of indictors to actual pathogens is not fixed
Direct Tests For Pathogens
• Involves selective cultivation to large
numbers
– Time consuming
– Expensive
– Potentially dangerous to lab personnel
• Molecular tests
– Require testing for each pathogen
– Expensive
– Require expertise
Viral Sources of Waterborne
Disease
• Hepatitis A: inflammation and
necrosis of liver
• Norwalk-type virus: acute
gastroenteritis
• Rotaviruses: acute
gastroenteritis, especially in
children
• Enteroviruses: many types
affect intestines and upper
respiratory tract
• Reoviruses: infects intestines
and upper respiratory tract
Virus Detection
Very difficult and costly
– Electron microscopy
– Immunoassays
– Cell cultures
– Reverse transcription-polymerase chain reaction
(RT-PCR)
Chlorination of Water
The most commonly used sanitizer!
Methods of Treatment
• Shock Chlorination (50-100 ppm, contact of at
least 6 hours)
• Continuous Chlorination – for recurring bacterial
contamination problems – a measurable amount of free
residual chlorine
Chlorine Terms
• Chlorine Dosage – total added
• Chlorine Demand - inorganic
• Combined Residual Chlorine - organic
• Free Residual Chlorine
Chlorine Dosage
Chlorine Dosage
Chlorine
Demand
Residual
Chlorine
Chlorine Dosage
Combined
Residual
Chlorine
Chlorine
Demand
Free
Residual
Chlorine
Inorganic
Organic
Kill
Free Residual Chlorine
• Chlorine remaining after combining with organic
matter
• Bacteria kill rate proportional to
concentration of free residual
DPD, N,N-diethyl-p-phenylene-diamine
Bottom Line
• Test your water as required and
anytime you suspect a problem
• Work with your County Environmental
Health Department
• Seek advise on interpreting the results
– what do they mean?
• If you question the results, resample
and retest
Characteristics of
Wastewater
Physical
Solids
Total – remaining residue upon evaporation at 103°C to 105°C
Settleable – solids that will settle to the bottom of the Imhoff cone in
a 60-minute period
Nonfilterable (Suspended)
Filterable – allowed to pass through filters with size of about 1.2µm
Colloidal – particulate matter with an approximate size range of
from 0.001 to 1µm.
- cannot be removed by settling
Dissolved – organic and inorganic molecules and ions that are
present in true solution in water
Physical
Odor
produced by decomposition of organic matter or by substances added
to wastewater
Effects
psychological stress
poor appetite
lowered water consumption
impaired respiration
nausea and vomiting
mental perturbation
Effects
deterioration of personal and community pride
interfere with human relation
discourage capital investment
lower socio-economic status
 deter growth
Detection – use of olfactory system
Odor Threshold, ppvVb
Odorous Compound Detection Recognition
Ammonia 17 37
Chlorine 0.08 0.314
Dimethyl Sulfide 0.001 0.001
Diphenyl Sulfide 0.0001 0.0021
Hydrogen Sulfide <0.00021 0.00047
Indole 0.0001 --
Methyl Amine 4.7 --
Methyl Mercaptan 0.0005 0.001
Skatole 0.001 0.019
Odor Thresholds Odorous Compounds Associated
With Untreated Wastewater
Factors that must be considered for the complete
characterization of an odor
Factor Description
Character Relates to the mental associations
Detectabilit
y
The number of dilutions required to reduce an odor to its
minimum detectable threshold odor concentration (MDTOC)
Hedonics The relative pleasantness or unpleasantness of the odor
sensed by the subject
Intensity Strength of odor; usually measured by the butanol
olfactometer of from the dilutions to threshold (D/T) when the
relationshipp is established
Physical
Temperature
usually wastewater posses higher temperature than of the water
supply
affects chemical reaction and reaction rates, aquatic life, and
suitability of water for beneficial use
oxygen is less soluble in warm water than in cold water
abnormally high temperatures can foster the growth of undesirable
water plants and fungus
25°C to 35°C – optimum temperatures for bacterial activity
50°C – anaerobic digestion and nitrification stop
15°C – methane-producing bacteria become quite inactive
 5°C – autotrophic-nitrifying bacteria practically cease functioning
 2°C – chemoheterotrophic bacteria acting on carbonaceous material
become essentially dormant
Physical
Density
formation of density currents in sedimentation tanks
Solid
Concentration,%
Type of sludge SG Range Typical
Primary
Medium-strength wastewater 1.03 4-12 6
From combined sewer system 1.05 4-12 6.5
Primary and waste activated sludge 1.03 2-6 3
Primary and trickling-filter humus sludge 1.03 4-10 5
Typical information on the specific gravity and
concentration of sludge from primary sedimentation
tanks
Physical
Color
readily determines the condition of wastewater
fresh water is usually light brownish-gray
septic water is depicted by black color
Turbidity
measures the light-transmitting properties of water
affected by colloidal and suspended matter
Chemical
Organic Matter
Matter composed or made up of C, H, O, together with N
Principal Groups of Organic Substances Found in Wastewater
Proteins – 40%-60%
Carbohydrates – 25%-50%
Fats, Oils and Grease – 10%
Urea – decomposes rapidly and undecomposed urea is found in
very fresh wastewater
Protein
Chemical
Principal constituents of the animal organism
High and constant proportion of N, thus main source of N in
wastewater.
When present in large quantities, foul odor are produced by their
decomposition
Carbohydrates
Widely distributed in nature
Includes sugar, starches, cellulose, and wood fiber
Sugar is soluble in water, when decompose certain bacteria aids
fermentation and produces alcohol and CO2
FOGs
Chemical
Contributed to domestic wastewater in butter, lard, margarine,
and vegetable fats and oils.
More stable organic compound thus does not decomposes easily
Interfere with the biological life in the surface water and create
unsightly floating matter and films
Surfactants
Causes foaming in wastewater treatment plants
Methylene blue active substance (MBAS)
Volatile Organic Compounds
Chemical
Organic compounds that have a boiling point ≤ 100°C and/or a
vapor pressure > 1mmHg at 25°C
Once in vapor state it is more likely to be released to the
environment
Presence of such compounds in the atmosphere may pose
significant public health risk
Contribute to a general increase in reactive hydrocarbons in the
atmosphere ,which can lead to the formation of photochemical
oxidant
Pesticides and Agricultural Chemicals
Chemical
Toxic to most life forms
Derived from farm run-offs
Inorganic Matter
Exhibited by presence minerals such as N, P, S, Cl
pH
Chemical
The term pH is used to describe the acid or base properties of
water solutions.
A pH value less than 7 in the wastewater plant influent may
indicate septic conditions of wastewater.
Pretreatment of these wastes at the source is usually required
since extreme pH values may damage biological treatment units.
The pH values less than 5 and more than 10 usually indicate
that industrial wastes exist and are not compatible with
biological wastewater operations.
Chlorides
Presence of chlorides in natural water is the result from leaching
of chloride-containing rocks and soil with which water comes in
contact
Chemical
Infiltration of groundwater into sewers adjacent to saltwater is
also a potential source of high chlorides
Alkalinity
Presence of hydroxides, carbonates, and bicarbonates of
elements such as Ca, Mg, Na, K, NH4
Helps resist changes in pH
Nitrogen
Presence of nitrogen can aid the excessive growth of algae
Chemical
Phosphorus
Essential to growth of algae
Used to evaluate treatability of wastewater
Sulfur
Forms deposits in pipes when H2S generated is not vented fully
Heavy Metals
Mostly toxic and carcinogenic
Gases
Dissolved Oxygen
Required for the respiration of aerobic microorganisms and
other aquatic life forms
Rotten egg smell
Chemical
Hydrogen Sulfide
Not formed in the presence of an abundant supply of oxygen
Colorless, odorless, and combustible hydrocarbon which is a
principal by-product of anaerobic decomposition of organic
matter
Methane
Bacteria
Fungi
Biological
Decomposes and stabilized organic matter
Single-celled prokaryotic eubacteria
Aerobic, multicellular, nonphotosynthetic, chemoheterotropic,
eukaryotic protist
Can grow in low moisture and low pH environment
Without the presence of fungi, the carbon cycle would soon
cease to exist and organic mater would accumulate
Algae
Protozoa
Biological
Rapidly reproduce in bodies of water wherein high level of N and
P are present
Single-celled eukaryotic microorganisms without cell walls
Aereobic or facultatively anaerobic
Feed on bacteria and other microscopic microorganisms
 Tanks or vessels used to perform physical,
chemical, and biochemical reactions.
Types of Reactors:
1. Single Batch Reactors
2. CSTR (Continuously Stirred Tank Reactor)
3. Plug Flow Reactor
1. Single Batch
Reactor
 The fill-and-draw
type. Materials are
added to the tank,
mixed for sufficient
time to allow the
reaction to occur,
and then drained.
2. CSTR
(Continuously
Stirred Tank
Reactor)
 Also called a
Completely Mixed
Flow reactor
(CMF).
 The composition of
the effluent is the
same as the
composition in the
tank
3. Plug flow reactors
 fluid particles pass
through the tank in
sequence.
Specific factors affecting rate of Chemical
Reaction:
1. Nature of Reactant
2. Physical State
3. Concentration
4. Temperature
5. Pressure
6. Catalysts
Two major reactor types that are used in
biologically based treatment systems:
1. Suspended growth reactor – the waste and the
microorganisms move through the reactor,
with the microorganism suspended in the flow.
2. Fixed film reactor – the organisms grow on an
inert surface that is maintained in the reactor.
 Mixing (or rapid mixing) – the process
whereby the chemicals are quickly and
uniformly dispersed in the water.
 Probably the most important physical
operation affecting coagulant dose
efficiency.
 Precipitates are ideally formed and slow,
gentle, continuous mixing will form flocs.
 Rapid mix tanks seldom exceed 8m³ in
volume.
 Flocculation – the most important factor
affecting particle-removal efficiency.
 Objective is to bring particles into contact
so that they will collide, stick together, and
grow in size.
 Modern plants provide about 20 minutes
of flocculation time.
Flocculation
 Axial flow impeller
 Paddle flocculator
 Baffled chamber
Typical flow pattern in a baffled tank with a
propeller
In the treatment of water and wastewater, the
degree of mixing is measured by the velocity
gradient, G.
G = velocity gradient
P = power input to the water
U = absolute viscosity of water
V = mixer or flocculator volume
G =
√P/VU (1/sec)
 Removal of particles that settle within a
reasonable period of time.
 Circular
sedimentation
 Rectangular
sedimentation
Types of Sedimentation:
 Type I sedimentation – particles that settle
discretely at a constant settling velocity (sand
and grit)
 Type II sedimentation – particles that flocculate
during sedimentation.
 Type III (zone sedimentation) – particles are at
high concentration (greater than 1,000 mg/L)
such that particles tend to settle as a mass.
 Process for separating suspended or colloidal
impurities from water by passage through a
porous medium, usually a bed of sand or
other medium.
Classifying filters:
 According to type of medium used:
 Sand
 Coal (anthracite)
 Dual media (coal plus sand)
 Mixed media (coal, sand, garnet)
 According to allowable loading rate:
 Slow sand filters
 Rapid sand filters
 High rate sand filters
 Rapid sand filters were
developed in early
1900s to prevent
epidemics.
 Filters have graded
sand within the bed
 Grain size distribution is
selected to optimize
passage of water while
minimizing the passage
of particulate matter
The size distribution or variation of a sample of
granular material is determined by the
sieving sample through a series of standard
sieves (screens).
Sieve
designation
number
Size of
opening (mm)
Sieve
designation
number
Size of
opening (mm)
200 0.074 20 0.84
140 0.105 18 1.00
100 0.149 16 1.19
70 0.210 12 1.68
50 0.297 8 2.38
40 0.42 6 3.36
30 0.59 4 4.76
 To reduce pathogens (disease producing
microorganisms) to an acceptable level
 Disinfection ≠ Sterilization
 Drinking water need not be sterile
 Categories of human enteric pathogens:
bacteria, viruses, and amoebic cysts
 Purposeful disinfection must be capable of
destroying all three
To be of practical service, water disinfectants
must:
 Destroy the kinds and numbers of
pathogens that may be introduced into
water within a practicable period of time
over an expected range in water
temperature
 Must meet possible fluctuations in
composition, concentration, and condition
of the water or wastewater
 Must neither be toxic to humans and domestic
animals nor unpalatable or otherwise
objectionable in required concentrations
 Reasonable cost , safe and easy to store,
transport, handle, and apply
 Strength or concentration must be determined
easily, quickly, and (preferably) automatically
 Must persist within disinfected water in a
sufficient concentration to provide reasonable
residual protection against its possible
recontamination before use
 A substance is transferred from the liquid
phase to the surface of a solid where it is
bound by chemical or physical forces
PAC (Powdered Activated Carbon)
 fed to raw water in a slurry
 Used to remove taste- and odor-causing
substances
 Some removal of SOCs
GAC (Granulated Activated Carbon)
 added to existing filter system or by an
additional contactor after primary filtration
 Predominately for taste and odor removal
 GAC typically last 90-120 days until it loses
adsorptive capacity – short life – GAC would
need to be regenerated or be destroyed by
burning in a high temp furnace – expensive
proposition.
Satisfactory treatment and disposal of water treatment
plant sludge can be the single most complex and
costly operation in the plant.
 Sludge – the precipitated chemicals and other materials
removed from raw water to make it potable and palatable.
 Sludge withdrawn from coagulation and softening
plants may have as much as 98% water.
Categories of water treatment plants (according to the
wastes they produce):
1. Plants that coagulate, filter and oxidize a surface water for
removal of turbidity, color, bacteria, algae, some organic
compounds, and often iron and/or manganese.
2. Plants that practice softening for the removal of calcium
and magnesium by the addition of lime, sodium hydroxide,
and/or soda ash.
3. Plants that are designed to specifically remove trace
organics such as nitrate, fluoride, radium, arsenic, etc.
4. Plants that produce air-phase wastes during the stripping
of volatile compounds.
Major water treatment plant wastes:
Solid/liquid wastes
-alum sludges -polymeric sludges
-iron sludges -softening sludges
-backwash wastes -slow sand filter wastes
-wastes from iron and manganese removal plants
-spent precoat filter media
Liquid phase wastes
-ion-exchange regenerant brine
-waste regenerant from activated alumina
-reverse osmosis waste streams
Gas phase wastes
-air stripping off-gases
The most logical sludge management program attempts to
use the following approach in disposing of sludge:
 Minimization of sludge generation
 Chemical recovery of precipitates
 Sludge treatment to reduce volume
 Ultimate disposal in an environmentally safe manner
Wastewater Treatment (Part I).ppt

More Related Content

Similar to Wastewater Treatment (Part I).ppt

Water and food culture
Water and food cultureWater and food culture
Water and food culture
Musa Khan
 

Similar to Wastewater Treatment (Part I).ppt (20)

WATER QUALITY STANDARDS.ppt
WATER QUALITY STANDARDS.pptWATER QUALITY STANDARDS.ppt
WATER QUALITY STANDARDS.ppt
 
Microbiol a ms 201014 0.2
Microbiol a ms 201014  0.2Microbiol a ms 201014  0.2
Microbiol a ms 201014 0.2
 
Water quality
Water qualityWater quality
Water quality
 
Microbial removal during sewage treatment
Microbial removal during sewage treatmentMicrobial removal during sewage treatment
Microbial removal during sewage treatment
 
ug class environment 1
ug class environment 1ug class environment 1
ug class environment 1
 
Water Treatment.pdf
Water Treatment.pdfWater Treatment.pdf
Water Treatment.pdf
 
Food borne animal parasites, viruses and food borne biohazards
Food borne animal parasites, viruses and food borne biohazardsFood borne animal parasites, viruses and food borne biohazards
Food borne animal parasites, viruses and food borne biohazards
 
Water analysis ppt rv (14-07-2020)
Water analysis ppt rv (14-07-2020)Water analysis ppt rv (14-07-2020)
Water analysis ppt rv (14-07-2020)
 
STOOL EXAMINATION.pdf
STOOL EXAMINATION.pdfSTOOL EXAMINATION.pdf
STOOL EXAMINATION.pdf
 
Examination of water
Examination of waterExamination of water
Examination of water
 
In situ analysis of bottled water technical staff
In situ analysis of bottled water technical staffIn situ analysis of bottled water technical staff
In situ analysis of bottled water technical staff
 
Water analysis webinar 23.06.2020
Water analysis webinar 23.06.2020Water analysis webinar 23.06.2020
Water analysis webinar 23.06.2020
 
pathogen in water
pathogen in waterpathogen in water
pathogen in water
 
Indicator organisms and water quality
Indicator organisms and water qualityIndicator organisms and water quality
Indicator organisms and water quality
 
Water and food culture
Water and food cultureWater and food culture
Water and food culture
 
Pollution and health
Pollution and health Pollution and health
Pollution and health
 
Water microbiology
Water microbiologyWater microbiology
Water microbiology
 
ENVIRONMENTAL MICROBIOLOGY SLIDES-B.pptx
ENVIRONMENTAL MICROBIOLOGY SLIDES-B.pptxENVIRONMENTAL MICROBIOLOGY SLIDES-B.pptx
ENVIRONMENTAL MICROBIOLOGY SLIDES-B.pptx
 
Water pollution and treatment pdf
Water pollution and treatment pdfWater pollution and treatment pdf
Water pollution and treatment pdf
 
Water quality.pptx
Water quality.pptxWater quality.pptx
Water quality.pptx
 

Recently uploaded

Seizure stage detection of epileptic seizure using convolutional neural networks
Seizure stage detection of epileptic seizure using convolutional neural networksSeizure stage detection of epileptic seizure using convolutional neural networks
Seizure stage detection of epileptic seizure using convolutional neural networks
IJECEIAES
 
21P35A0312 Internship eccccccReport.docx
21P35A0312 Internship eccccccReport.docx21P35A0312 Internship eccccccReport.docx
21P35A0312 Internship eccccccReport.docx
rahulmanepalli02
 
Final DBMS Manual (2).pdf final lab manual
Final DBMS Manual (2).pdf final lab manualFinal DBMS Manual (2).pdf final lab manual
Final DBMS Manual (2).pdf final lab manual
BalamuruganV28
 

Recently uploaded (20)

8th International Conference on Soft Computing, Mathematics and Control (SMC ...
8th International Conference on Soft Computing, Mathematics and Control (SMC ...8th International Conference on Soft Computing, Mathematics and Control (SMC ...
8th International Conference on Soft Computing, Mathematics and Control (SMC ...
 
Developing a smart system for infant incubators using the internet of things ...
Developing a smart system for infant incubators using the internet of things ...Developing a smart system for infant incubators using the internet of things ...
Developing a smart system for infant incubators using the internet of things ...
 
litvinenko_Henry_Intrusion_Hong-Kong_2024.pdf
litvinenko_Henry_Intrusion_Hong-Kong_2024.pdflitvinenko_Henry_Intrusion_Hong-Kong_2024.pdf
litvinenko_Henry_Intrusion_Hong-Kong_2024.pdf
 
Seizure stage detection of epileptic seizure using convolutional neural networks
Seizure stage detection of epileptic seizure using convolutional neural networksSeizure stage detection of epileptic seizure using convolutional neural networks
Seizure stage detection of epileptic seizure using convolutional neural networks
 
The Entity-Relationship Model(ER Diagram).pptx
The Entity-Relationship Model(ER Diagram).pptxThe Entity-Relationship Model(ER Diagram).pptx
The Entity-Relationship Model(ER Diagram).pptx
 
Augmented Reality (AR) with Augin Software.pptx
Augmented Reality (AR) with Augin Software.pptxAugmented Reality (AR) with Augin Software.pptx
Augmented Reality (AR) with Augin Software.pptx
 
Research Methodolgy & Intellectual Property Rights Series 1
Research Methodolgy & Intellectual Property Rights Series 1Research Methodolgy & Intellectual Property Rights Series 1
Research Methodolgy & Intellectual Property Rights Series 1
 
What is Coordinate Measuring Machine? CMM Types, Features, Functions
What is Coordinate Measuring Machine? CMM Types, Features, FunctionsWhat is Coordinate Measuring Machine? CMM Types, Features, Functions
What is Coordinate Measuring Machine? CMM Types, Features, Functions
 
Fuzzy logic method-based stress detector with blood pressure and body tempera...
Fuzzy logic method-based stress detector with blood pressure and body tempera...Fuzzy logic method-based stress detector with blood pressure and body tempera...
Fuzzy logic method-based stress detector with blood pressure and body tempera...
 
Theory of Time 2024 (Universal Theory for Everything)
Theory of Time 2024 (Universal Theory for Everything)Theory of Time 2024 (Universal Theory for Everything)
Theory of Time 2024 (Universal Theory for Everything)
 
Software Engineering Practical File Front Pages.pdf
Software Engineering Practical File Front Pages.pdfSoftware Engineering Practical File Front Pages.pdf
Software Engineering Practical File Front Pages.pdf
 
UNIT 4 PTRP final Convergence in probability.pptx
UNIT 4 PTRP final Convergence in probability.pptxUNIT 4 PTRP final Convergence in probability.pptx
UNIT 4 PTRP final Convergence in probability.pptx
 
Circuit Breakers for Engineering Students
Circuit Breakers for Engineering StudentsCircuit Breakers for Engineering Students
Circuit Breakers for Engineering Students
 
21P35A0312 Internship eccccccReport.docx
21P35A0312 Internship eccccccReport.docx21P35A0312 Internship eccccccReport.docx
21P35A0312 Internship eccccccReport.docx
 
Artificial Intelligence in due diligence
Artificial Intelligence in due diligenceArtificial Intelligence in due diligence
Artificial Intelligence in due diligence
 
Final DBMS Manual (2).pdf final lab manual
Final DBMS Manual (2).pdf final lab manualFinal DBMS Manual (2).pdf final lab manual
Final DBMS Manual (2).pdf final lab manual
 
Seismic Hazard Assessment Software in Python by Prof. Dr. Costas Sachpazis
Seismic Hazard Assessment Software in Python by Prof. Dr. Costas SachpazisSeismic Hazard Assessment Software in Python by Prof. Dr. Costas Sachpazis
Seismic Hazard Assessment Software in Python by Prof. Dr. Costas Sachpazis
 
Working Principle of Echo Sounder and Doppler Effect.pdf
Working Principle of Echo Sounder and Doppler Effect.pdfWorking Principle of Echo Sounder and Doppler Effect.pdf
Working Principle of Echo Sounder and Doppler Effect.pdf
 
Dynamo Scripts for Task IDs and Space Naming.pptx
Dynamo Scripts for Task IDs and Space Naming.pptxDynamo Scripts for Task IDs and Space Naming.pptx
Dynamo Scripts for Task IDs and Space Naming.pptx
 
Instruct Nirmaana 24-Smart and Lean Construction Through Technology.pdf
Instruct Nirmaana 24-Smart and Lean Construction Through Technology.pdfInstruct Nirmaana 24-Smart and Lean Construction Through Technology.pdf
Instruct Nirmaana 24-Smart and Lean Construction Through Technology.pdf
 

Wastewater Treatment (Part I).ppt

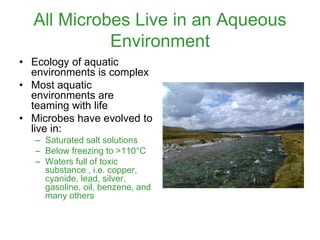
  • 1. All Microbes Live in an Aqueous Environment • Ecology of aquatic environments is complex • Most aquatic environments are teaming with life • Microbes have evolved to live in: – Saturated salt solutions – Below freezing to >110°C – Waters full of toxic substance , i.e. copper, cyanide, lead, silver, gasoline, oil, benzene, and many others
  • 2. Water Quality in TN (2004)* • Sources of Agricultural Pollution in Assessed Streams and Rivers – Grazing related 60 % – Crop related 37 % – Intensive Animal Ops. 3 % * TN 305 (b) Report 2004
  • 3. Terminology • Potable - (clean) water – free of all objectionable material, including pathogens, tastes, odors, colors, toxins, radioactive material, organisms, oils, gases, etc. • Fresh – non-salt or sea water • Pollution – anything that makes it Non-Potable • Sewage – the community waste or garbage that mother nature and we dump onto sewers or land
  • 4. Typical Water Quality Standards • Drinking Water – No coliforms contamination acceptable • Recreational water – 200 fecal coliforms /100 ml • Fish and wildlife habitat – 5000 fecal coliforms/100 ml • Shellfish – 14 fecal coliforms/100 ml
  • 5. Most Probable Number • 10 ml, 1 ml and 0.1ml of water inoculated in lactose broth • Coliforms identified by gas production • Refer to tables and determine statistical range of number of coliforms Does not: Detect total number of bacteria Specific pathogens
  • 6. Bacteria Disease/ infection Symptoms Aeromonas Enteritis Very thin, blood- and mucus-containing diarrhea Campylobacter jejuni Campilobacteriose Flue, diarrhea, head- and stomachaches, fever, cramps and nausea Escherichia coli Urinary tract infections, neonatal meningitis, intestinal disease Watery diarrhea, headaches, fever, homiletic uremia, kidney damage Plesiomonas shigelloides Plesiomonas-infection Nausea, stomachaches and watery diarrhea, sometimes fevers, headaches and vomiting Typhus Typhoid fever Fevers Salmonella Salmonellosis Sickness, intestinal cramps, vomiting, diarrhea and sometimes light fevers Streptococcus (Gastro) intestinal disease Stomach aches, diarrhea and fevers, sometimes vomiting Vibrio El Tor (freshwater) (Light form of) Cholera Heavy diarrhea Bacteria Found In Surface Water
  • 7. Pathogens of Most Concern on Fresh Produce • Salmonella Shigella • Escherichia coli Campylobacter • Yersinia entercolitica Staphylococcus aureus • Clostridium species Bacillus cereus • Vibrio species • Viruses (Hepatitis A, Norwalk) • Parasites/Protozoa- (Giardia, Entamoeba, Toxoplasma, Sarccystis, Isopora, Cryptosporidium, Eimeria, Cyclospora) Vibrio species
  • 8. Waterborne Infectious Disease (U.S. 1997-1998) Disease Agent Outbreaks Cases Shigellosis Shigella sonnei 1 183 Giardiasis Giardia lambia 4 159 Cryptoporidiosis Cryptosporidium parvum 2 1432 Gastroenteritis E. Coli 0157:H7 3 164 Acute Unknown 5 163 gastrointestinal illness Shigella
  • 9. Other Important Water Transmitted Organisms • Vibrio cholerae – Prevalent in U. S. in 1800’s – Currently common in Asia, Africa, Latin America – Over 100,000 deaths and 2345 deaths in 2004 – Transmitted through water, fresh vegetables and shellfish
  • 10. Microrganism Disease Symptoms Amoeba Amoebic dysentery Severe diarrhea, headache, abdominal pain, chills, fever; if not treated can cause liver abscess, bowel perforation and death Cryptosporidium parvum Cryptosporidiosis Feeling of sickness, watery diarrhea, vomiting, lack of appetite Giardia Giardiasis Diarrhea, abdominal cramps, flatulence, belching, fatigue Toxoplasm gondii Toxoplasmosis Flu, swelling of lymph glands With pregnant women subtle abortion and brain infections Protozoa Found in Surface Water
  • 11. Giardiasis and Cryptosporidiosis • Both are protozoans • Transmission through water (97% of all surface water carry cysts) • Resistant to chlorine, but can be filtered • 1993 Milwaukee outbreak (100,000)
  • 12. Some Costly Cases • Cryptosporidium, 1993, Milwaukee, $55 million • Pfiesteria piscicida, 1997, Chesapeake bay, $43 million • 3700 beach closing in 1996 Mild case of diarrhea cost ~$280 for treatment and diagnosis
  • 13. Life cycle of Cryptospoidium Transmission occurs mainly through Contaminated water.
  • 14. Agricultural Water • Identify source and distribution of water used • Be aware of current and historical use of land • Review existing practices and conditions to identify potential sources of contamination. • Maintain wells in good working condition • How are you applying the water? Minimize contact of edible portion of fresh produce with contaminated irrigation water.
  • 15. Water Source Irrigation Pesticide App. Hand Produce wash wash Open source, canal, Reservoir, pond, etc. Munciple water source Capped well, Annual test date Uncapped well, canal, reservoir, etc. Quarterly test date Municipal water source Quality report date Y N Y N Y N Y N Y N Y N Y N Y N Water Quality Evaluation Log
  • 16. Public Health and Water Supply Routine monitoring of water quality using indicator organisms, indicating fecal contamination. To determine if fecal coliforms are from humans or other animals – must test for fecal streptococci
  • 17. Fecal coliform/fecal streptococci ratios for humans and other animals Human 4.4 Duck 0.6 Sheep 0.4 Chicken 0.4 Pig 0.4 Cow 0.2 Turkey 0.1
  • 18. Characteristics of a Useful Indicator • Useful for all water types • Always present when pathogens are present • Not present in the absence of the pathogen • Correlated with degree of pollution • More easily detectable than a pathogen • Survive longer than the pathogen • Not dangerous to work with
  • 19. Bacterial-Indicator Organisms Common Groups • Coliforms  Total coliforms  Fecal coliforms  Escherichia coli • Streptococci  fecal streptococci  enterococci • Spore Formers Clostridium perfringens
  • 20. Indicator Organisms • General coliforms – indicate water in contact with plant or animal life (universally present) • Fecal coliforms – mammal or bird feces in water • Enterococcus bacteria (type of fecal streptococci)– feces from warm blooded animals in water These are not what generally make people sick
  • 21. Problems With the Coliform Indicator Test False Positives Enterobacter areogenes False Negatives Salmonella typhi
  • 22. Some Factors Affecting Ratio of Indicator Organisms to Pathogens • Feces from human populations with higher infection rates are of greater concern • All treatment methods and environmental conditions affect pathogens and indicators differently - Chlorinated water may have zero indicators and pathogens, but loaded with viruses. - Pathogens can “hide” from treatment inside suspended solids. The ratio of indictors to actual pathogens is not fixed
  • 23. Direct Tests For Pathogens • Involves selective cultivation to large numbers – Time consuming – Expensive – Potentially dangerous to lab personnel • Molecular tests – Require testing for each pathogen – Expensive – Require expertise
  • 24. Viral Sources of Waterborne Disease • Hepatitis A: inflammation and necrosis of liver • Norwalk-type virus: acute gastroenteritis • Rotaviruses: acute gastroenteritis, especially in children • Enteroviruses: many types affect intestines and upper respiratory tract • Reoviruses: infects intestines and upper respiratory tract
  • 25. Virus Detection Very difficult and costly – Electron microscopy – Immunoassays – Cell cultures – Reverse transcription-polymerase chain reaction (RT-PCR)
  • 26. Chlorination of Water The most commonly used sanitizer!
  • 27. Methods of Treatment • Shock Chlorination (50-100 ppm, contact of at least 6 hours) • Continuous Chlorination – for recurring bacterial contamination problems – a measurable amount of free residual chlorine
  • 28. Chlorine Terms • Chlorine Dosage – total added • Chlorine Demand - inorganic • Combined Residual Chlorine - organic • Free Residual Chlorine
  • 32. Free Residual Chlorine • Chlorine remaining after combining with organic matter • Bacteria kill rate proportional to concentration of free residual DPD, N,N-diethyl-p-phenylene-diamine
  • 33. Bottom Line • Test your water as required and anytime you suspect a problem • Work with your County Environmental Health Department • Seek advise on interpreting the results – what do they mean? • If you question the results, resample and retest
  • 35.
  • 36. Physical Solids Total – remaining residue upon evaporation at 103°C to 105°C Settleable – solids that will settle to the bottom of the Imhoff cone in a 60-minute period Nonfilterable (Suspended) Filterable – allowed to pass through filters with size of about 1.2µm Colloidal – particulate matter with an approximate size range of from 0.001 to 1µm. - cannot be removed by settling Dissolved – organic and inorganic molecules and ions that are present in true solution in water
  • 37.
  • 38. Physical Odor produced by decomposition of organic matter or by substances added to wastewater Effects psychological stress poor appetite lowered water consumption impaired respiration nausea and vomiting mental perturbation
  • 39. Effects deterioration of personal and community pride interfere with human relation discourage capital investment lower socio-economic status  deter growth Detection – use of olfactory system
  • 40.
  • 41. Odor Threshold, ppvVb Odorous Compound Detection Recognition Ammonia 17 37 Chlorine 0.08 0.314 Dimethyl Sulfide 0.001 0.001 Diphenyl Sulfide 0.0001 0.0021 Hydrogen Sulfide <0.00021 0.00047 Indole 0.0001 -- Methyl Amine 4.7 -- Methyl Mercaptan 0.0005 0.001 Skatole 0.001 0.019 Odor Thresholds Odorous Compounds Associated With Untreated Wastewater
  • 42. Factors that must be considered for the complete characterization of an odor Factor Description Character Relates to the mental associations Detectabilit y The number of dilutions required to reduce an odor to its minimum detectable threshold odor concentration (MDTOC) Hedonics The relative pleasantness or unpleasantness of the odor sensed by the subject Intensity Strength of odor; usually measured by the butanol olfactometer of from the dilutions to threshold (D/T) when the relationshipp is established
  • 43. Physical Temperature usually wastewater posses higher temperature than of the water supply affects chemical reaction and reaction rates, aquatic life, and suitability of water for beneficial use oxygen is less soluble in warm water than in cold water abnormally high temperatures can foster the growth of undesirable water plants and fungus 25°C to 35°C – optimum temperatures for bacterial activity 50°C – anaerobic digestion and nitrification stop 15°C – methane-producing bacteria become quite inactive  5°C – autotrophic-nitrifying bacteria practically cease functioning  2°C – chemoheterotrophic bacteria acting on carbonaceous material become essentially dormant
  • 44. Physical Density formation of density currents in sedimentation tanks Solid Concentration,% Type of sludge SG Range Typical Primary Medium-strength wastewater 1.03 4-12 6 From combined sewer system 1.05 4-12 6.5 Primary and waste activated sludge 1.03 2-6 3 Primary and trickling-filter humus sludge 1.03 4-10 5 Typical information on the specific gravity and concentration of sludge from primary sedimentation tanks
  • 45. Physical Color readily determines the condition of wastewater fresh water is usually light brownish-gray septic water is depicted by black color Turbidity measures the light-transmitting properties of water affected by colloidal and suspended matter
  • 46. Chemical Organic Matter Matter composed or made up of C, H, O, together with N Principal Groups of Organic Substances Found in Wastewater Proteins – 40%-60% Carbohydrates – 25%-50% Fats, Oils and Grease – 10% Urea – decomposes rapidly and undecomposed urea is found in very fresh wastewater
  • 47. Protein Chemical Principal constituents of the animal organism High and constant proportion of N, thus main source of N in wastewater. When present in large quantities, foul odor are produced by their decomposition Carbohydrates Widely distributed in nature Includes sugar, starches, cellulose, and wood fiber Sugar is soluble in water, when decompose certain bacteria aids fermentation and produces alcohol and CO2
  • 48. FOGs Chemical Contributed to domestic wastewater in butter, lard, margarine, and vegetable fats and oils. More stable organic compound thus does not decomposes easily Interfere with the biological life in the surface water and create unsightly floating matter and films Surfactants Causes foaming in wastewater treatment plants Methylene blue active substance (MBAS)
  • 49. Volatile Organic Compounds Chemical Organic compounds that have a boiling point ≤ 100°C and/or a vapor pressure > 1mmHg at 25°C Once in vapor state it is more likely to be released to the environment Presence of such compounds in the atmosphere may pose significant public health risk Contribute to a general increase in reactive hydrocarbons in the atmosphere ,which can lead to the formation of photochemical oxidant
  • 50. Pesticides and Agricultural Chemicals Chemical Toxic to most life forms Derived from farm run-offs
  • 51. Inorganic Matter Exhibited by presence minerals such as N, P, S, Cl pH Chemical The term pH is used to describe the acid or base properties of water solutions. A pH value less than 7 in the wastewater plant influent may indicate septic conditions of wastewater. Pretreatment of these wastes at the source is usually required since extreme pH values may damage biological treatment units. The pH values less than 5 and more than 10 usually indicate that industrial wastes exist and are not compatible with biological wastewater operations.
  • 52. Chlorides Presence of chlorides in natural water is the result from leaching of chloride-containing rocks and soil with which water comes in contact Chemical Infiltration of groundwater into sewers adjacent to saltwater is also a potential source of high chlorides Alkalinity Presence of hydroxides, carbonates, and bicarbonates of elements such as Ca, Mg, Na, K, NH4 Helps resist changes in pH
  • 53. Nitrogen Presence of nitrogen can aid the excessive growth of algae Chemical Phosphorus Essential to growth of algae Used to evaluate treatability of wastewater Sulfur Forms deposits in pipes when H2S generated is not vented fully Heavy Metals Mostly toxic and carcinogenic
  • 54. Gases Dissolved Oxygen Required for the respiration of aerobic microorganisms and other aquatic life forms Rotten egg smell Chemical Hydrogen Sulfide Not formed in the presence of an abundant supply of oxygen Colorless, odorless, and combustible hydrocarbon which is a principal by-product of anaerobic decomposition of organic matter Methane
  • 55. Bacteria Fungi Biological Decomposes and stabilized organic matter Single-celled prokaryotic eubacteria Aerobic, multicellular, nonphotosynthetic, chemoheterotropic, eukaryotic protist Can grow in low moisture and low pH environment Without the presence of fungi, the carbon cycle would soon cease to exist and organic mater would accumulate
  • 56. Algae Protozoa Biological Rapidly reproduce in bodies of water wherein high level of N and P are present Single-celled eukaryotic microorganisms without cell walls Aereobic or facultatively anaerobic Feed on bacteria and other microscopic microorganisms
  • 57.  Tanks or vessels used to perform physical, chemical, and biochemical reactions. Types of Reactors: 1. Single Batch Reactors 2. CSTR (Continuously Stirred Tank Reactor) 3. Plug Flow Reactor
  • 58. 1. Single Batch Reactor  The fill-and-draw type. Materials are added to the tank, mixed for sufficient time to allow the reaction to occur, and then drained.
  • 59. 2. CSTR (Continuously Stirred Tank Reactor)  Also called a Completely Mixed Flow reactor (CMF).  The composition of the effluent is the same as the composition in the tank
  • 60. 3. Plug flow reactors  fluid particles pass through the tank in sequence.
  • 61. Specific factors affecting rate of Chemical Reaction: 1. Nature of Reactant 2. Physical State 3. Concentration 4. Temperature 5. Pressure 6. Catalysts
  • 62. Two major reactor types that are used in biologically based treatment systems: 1. Suspended growth reactor – the waste and the microorganisms move through the reactor, with the microorganism suspended in the flow.
  • 63. 2. Fixed film reactor – the organisms grow on an inert surface that is maintained in the reactor.
  • 64.  Mixing (or rapid mixing) – the process whereby the chemicals are quickly and uniformly dispersed in the water.  Probably the most important physical operation affecting coagulant dose efficiency.  Precipitates are ideally formed and slow, gentle, continuous mixing will form flocs.  Rapid mix tanks seldom exceed 8m³ in volume.
  • 65.  Flocculation – the most important factor affecting particle-removal efficiency.  Objective is to bring particles into contact so that they will collide, stick together, and grow in size.  Modern plants provide about 20 minutes of flocculation time.
  • 66.
  • 67. Flocculation  Axial flow impeller  Paddle flocculator  Baffled chamber
  • 68. Typical flow pattern in a baffled tank with a propeller
  • 69. In the treatment of water and wastewater, the degree of mixing is measured by the velocity gradient, G. G = velocity gradient P = power input to the water U = absolute viscosity of water V = mixer or flocculator volume G = √P/VU (1/sec)
  • 70.  Removal of particles that settle within a reasonable period of time.
  • 73. Types of Sedimentation:  Type I sedimentation – particles that settle discretely at a constant settling velocity (sand and grit)  Type II sedimentation – particles that flocculate during sedimentation.  Type III (zone sedimentation) – particles are at high concentration (greater than 1,000 mg/L) such that particles tend to settle as a mass.
  • 74.  Process for separating suspended or colloidal impurities from water by passage through a porous medium, usually a bed of sand or other medium.
  • 75. Classifying filters:  According to type of medium used:  Sand  Coal (anthracite)  Dual media (coal plus sand)  Mixed media (coal, sand, garnet)  According to allowable loading rate:  Slow sand filters  Rapid sand filters  High rate sand filters
  • 76.  Rapid sand filters were developed in early 1900s to prevent epidemics.  Filters have graded sand within the bed  Grain size distribution is selected to optimize passage of water while minimizing the passage of particulate matter
  • 77. The size distribution or variation of a sample of granular material is determined by the sieving sample through a series of standard sieves (screens). Sieve designation number Size of opening (mm) Sieve designation number Size of opening (mm) 200 0.074 20 0.84 140 0.105 18 1.00 100 0.149 16 1.19 70 0.210 12 1.68 50 0.297 8 2.38 40 0.42 6 3.36 30 0.59 4 4.76
  • 78.  To reduce pathogens (disease producing microorganisms) to an acceptable level
  • 79.  Disinfection ≠ Sterilization  Drinking water need not be sterile  Categories of human enteric pathogens: bacteria, viruses, and amoebic cysts  Purposeful disinfection must be capable of destroying all three
  • 80. To be of practical service, water disinfectants must:  Destroy the kinds and numbers of pathogens that may be introduced into water within a practicable period of time over an expected range in water temperature  Must meet possible fluctuations in composition, concentration, and condition of the water or wastewater
  • 81.  Must neither be toxic to humans and domestic animals nor unpalatable or otherwise objectionable in required concentrations  Reasonable cost , safe and easy to store, transport, handle, and apply  Strength or concentration must be determined easily, quickly, and (preferably) automatically  Must persist within disinfected water in a sufficient concentration to provide reasonable residual protection against its possible recontamination before use
  • 82.  A substance is transferred from the liquid phase to the surface of a solid where it is bound by chemical or physical forces
  • 83. PAC (Powdered Activated Carbon)  fed to raw water in a slurry  Used to remove taste- and odor-causing substances  Some removal of SOCs GAC (Granulated Activated Carbon)  added to existing filter system or by an additional contactor after primary filtration  Predominately for taste and odor removal  GAC typically last 90-120 days until it loses adsorptive capacity – short life – GAC would need to be regenerated or be destroyed by burning in a high temp furnace – expensive proposition.
  • 84. Satisfactory treatment and disposal of water treatment plant sludge can be the single most complex and costly operation in the plant.  Sludge – the precipitated chemicals and other materials removed from raw water to make it potable and palatable.  Sludge withdrawn from coagulation and softening plants may have as much as 98% water.
  • 85. Categories of water treatment plants (according to the wastes they produce): 1. Plants that coagulate, filter and oxidize a surface water for removal of turbidity, color, bacteria, algae, some organic compounds, and often iron and/or manganese. 2. Plants that practice softening for the removal of calcium and magnesium by the addition of lime, sodium hydroxide, and/or soda ash. 3. Plants that are designed to specifically remove trace organics such as nitrate, fluoride, radium, arsenic, etc. 4. Plants that produce air-phase wastes during the stripping of volatile compounds.
  • 86. Major water treatment plant wastes: Solid/liquid wastes -alum sludges -polymeric sludges -iron sludges -softening sludges -backwash wastes -slow sand filter wastes -wastes from iron and manganese removal plants -spent precoat filter media Liquid phase wastes -ion-exchange regenerant brine -waste regenerant from activated alumina -reverse osmosis waste streams Gas phase wastes -air stripping off-gases
  • 87. The most logical sludge management program attempts to use the following approach in disposing of sludge:  Minimization of sludge generation  Chemical recovery of precipitates  Sludge treatment to reduce volume  Ultimate disposal in an environmentally safe manner

Editor's Notes

  1. The flocculation units are designed for slow mixing at 20min retention time. These units are designed to cause the particles to collide and increase in size without excessive shearing. Coagulation and flocculation can remove more than 80% of suspended solids.
  2. The flocculation units are designed for slow mixing at 20min retention time. These units are designed to cause the particles to collide and increase in size without excessive shearing. Coagulation and flocculation can remove more than 80% of suspended solids.
  3. Common rules-of-the-thumb for axial flow impellers: Flocculator basin should be divided into at least three compartments The diameter of the impeller is between 0.2 to 0.5 times the width of the chamber and the maximum impeller diameter is about 3m
  4. Change fig
  5. Change fig
  6. Change fig