
Recommended
More Related Content
Viewers also liked
Viewers also liked (13)
Similar to How Greenpeace USA Started Testing on Facebook
Similar to How Greenpeace USA Started Testing on Facebook (20)
Recently uploaded
Recently uploaded (20)
How Greenpeace USA Started Testing on Facebook
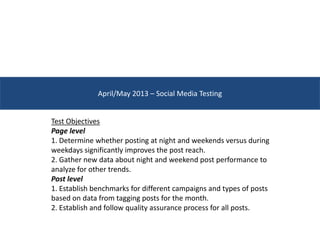
- 1. April/May 2013 – Social Media Testing Test Objectives Page level 1. Determine whether posting at night and weekends versus during weekdays significantly improves the post reach. 2. Gather new data about night and weekend post performance to analyze for other trends. Post level 1. Establish benchmarks for different campaigns and types of posts based on data from tagging posts for the month. 2. Establish and follow quality assurance process for all posts.
- 2. The Post Category has a very big effect on the popularity of the post. Over the 2 month period, “Informative” and “Awesome/Inspirational” categories were the most frequently posted, but their reach was limited. The best performing post categories were “Good News/Solutions”, “Fear-Mongering/Outrage”, and “Cute Animal”. “Funny”, “Sarcastic”, and “Informative” posts were generally the lowest performing. Are there ways to slightly alter “Informative” posts to be more like the better performing Post Categories, without fundamentally skewing the overall posting philosophy (nobody wants 24/7 Cute Animal pictures)? Post Category 0 10 20 30 40 50 60 70 - 20,000 40,000 60,000 80,000 100,000 120,000 Awesome/Inspirational Cute Animal Fear-Mongering/Outrage Funny Good News/Solutions Informative Sarcastic PostCount PostReach Average Post Reach/Total Post Count per Post Category Average of Lifetime Post Total Reach Post Count
- 3. The campaign topic of posts has a big effect on the reach they have. Key Takeaways: - Climate is the biggest GP campaign by post count, and the most popular in terms of reach - We post a lot on Arctic but the average reach is very low - Misc posts tend to do well, and we probably post them at the right frequency Campaign 0 10 20 30 40 50 60 - 20,000 40,000 60,000 80,000 100,000 120,000 Arctic Climate Democracy Forest Misc Ocean toxics Upworthy PostCount PostReach Average Post Reach/Total Post Counter per Campaign Average of Lifetime Post Total Reach Post Count Post Category Post Count Average of Lifetime Post Total Reach Awesome/Inspirational 12 21,218 Cute Animal 1 27,053 Fear-Mongering/Outrage 4 30,089 Funny 3 19,193 Good News/Solutions 8 20,384 Informative 25 25,095 Sarcastic 4 19,457
- 4. 0 2 4 6 8 10 12 14 - 100,000 200,000 300,000 400,000 500,000 600,000 6 Month Page Reach and Post Frequency # of Posts Daily Total Reach Linear (Daily Total Reach) Page Reach Determining whether the Arctic Shop Window had a tangible impact on our Facebook page is hard to determine, as it coincided with the Arkansas Oil Spill and the Boston Marathon bombings,. The average Daily Reach has increased steadily since December (despite the peaks and valleys) although we are posting less posts per day – individual posts are performing better and the “floor” has risen. Might this be a result of better timing and quality of posts?
- 5. Time of Day Breakdown of the # of times we posted in the past 6 months (Dec-Jan, Feb-Mar, Apr-Jun) and resulting Average Reach Focusing on Apr-Jun performance compared to Feb-Mar, for all time periods except 9AM-Noon, we posted as much if not more in Apr-Jun, and saw either similar Average Reach for each time or an increase in reach – This is a result of us reaching more people in total during these times. The Midnight-9AM and 6PM-9PM period stands out as an exceptionally good – we posted more frequently AND had higher average reach. *Note: Missing data for last week of May - 20 40 60 80 Midnight-9AM 9AM-Noon Noon-3PM 3PM-6PM 6PM-9PM 9PM-Midnight PostCount Post Count by Time of Day - 20,000 40,000 60,000 80,000 Midnight-9AM 9AM-Noon Noon-3PM 3PM-6PM 6PM-9PM 9PM-Midnight AverageReach Average Reach by Time of Day Dec-Jan Feb-Mar Apr-Jun
- 6. Day of Week Breakdown of the # of times we posted in the past 6 months (Dec-Jan, Feb-Mar, Apr-May) and resulting Average Reach The Online team made a conscious effort to post more during the weekend, as shown by the post count increase for Saturday/Sunday in Apr-Jun, relative to the other months. Saturday had a slight dip in average reach, but nothing significant, while Sunday saw a marked increase. Overall, posting more on weekends has been successful, as the total views/impressions has increased for those days. Tuesday had a few outliers that are responsible for boosting the average reach way above other days for Apr- Jun *Note: Missing data for last week of May - 20 40 60 Sunday Monday Tuesday Wednesday Thursday Friday Saturday Post Count by Day of Week - 20,000 40,000 60,000 80,000 Sunday Monday Tuesday Wednesday Thursday Friday Saturday Average Reach per Post by Day of Week Dec-Jan Feb-Mar Apr-Jun