Protein Supp-Taggar goats (UofK. J. Vet. Med. &Anim. Prod)
Schuster et al. 2016
1. Grazing intensities affect weed seedling emergence and the seed bank
in an integrated crop–livestock system
Mauricio Z. Schustera,
*, Adelino Pelissaria
, Anibal de Moraesa
, S. Kent Harrisonb
,
R. Mark Sulcb
, Sebastião B.C. Lustosac
, Ibanor Anghinonid
, Paulo C.F. Carvalhoe
a
Department of Crop Production and Protection, Federal University of Paraná, 1540 Rua dos funcionários Road, Curitiba, PR 80035-060, Brazil
b
Department of Horticulture and Crop Science, The Ohio State University, 2021 Coffey Road, Columbus, OH 43210-1086, USA
c
Department of Agronomy, Midwest State University of Paraná, 03 Simeão Camargo Varela de Sá road, Guarapuava, PR 85040-080, Brazil
d
Department of Soil Science, Federal University of Rio Grande do Sul, Porto Alegre, RS 91540-000, Brazil
e
Department of Forage Plants and Agrometeorology, Federal University of Rio Grande do Sul, Porto Alegre, RS 91540-000, Brazil
A R T I C L E I N F O
Article history:
Received 2 June 2016
Received in revised form 18 July 2016
Accepted 3 August 2016
Available online xxx
Keywords:
Ecological filters
Integrated weed management
Biological control
Glyphosate-resistance
Plant population dynamics
Weed ecology
A B S T R A C T
Integrated crop-livestock systems (ICLS) are widespread worldwide. Although weeds can result in several
types of losses, essential information regarding weed seedling emergence and seed banks is lacking in
these systems for integrated weed management planning. This study investigated the effects of different
grazing intensities (no grazing and grazed swards maintained at 10-, 20-, 30- and 40-cm sward heights)
on weed seedling emergence and seed banks in a winter cover crop during the 15th year of an ICLS
experiment under no-tillage management in subtropical Southern Brazil. We hypothesized that low
grazing intensities would reduce weed interference and weed seed banks size in an ICLS. We determined
treatment effects on weed species richness, seed bank population density, and seedling emergence
during winter and summer. Higher sward heights in the winter-grazed cover crop reduced the number of
weed species, the density of emerged weed seedlings, and the weed seed bank size compared with the
non-grazed control. With a sward grazing height of 10 cm, the seed bank contained an average of 3151
seeds mÀ2
, and the weed population densities during the summer and winter were 11.8 and 21.7 plants
mÀ2
greater, respectively, compared with the sward grazing height of 40 cm. Fifteen years after adopting
low grazing intensities (30- and 40-cm sward heights) in the ICLS, the size of the weed seed bank was
reduced by 42.1% compared with the non-grazed treatment. Decreasing the grazing intensity reduced the
number of weed species, the density of emerged weed seedlings, and the weed seed bank density;
therefore, integrated weed management strategies should consider minimizing grazing intensities in an
ICLS.
ã 2016 Elsevier B.V. All rights reserved.
1. Introduction
Weeds reduce the potential yields of row crops and pastures,
and result in an estimated annual loss of US$ 99.2 billion per year in
the US, UK, Australia, India, South Africa and Brazil combined
(Pimentel et al., 2001). In addition, the increased number of
glyphosate-resistant weed species is a primary factor that threat-
ens food security in global agriculture (Busi et al., 2013) and has
increased the cost of controlling weeds on farms (Beckie, 2011).
Integrated crop-livestock systems (ICLS) are widespread
throughout the world, comprising a total area of approximately
2.5 billion hectares (Keulen and Schiere, 2004). Studies of ICLS have
been conducted with regard to production responses (Carvalho
et al., 2014), environmental quality (Lemaire et al., 2013), economic
viability (Oliveira et al., 2013) and social benefits (Franzluebbers
et al., 2014). However, Moraes et al. (2014) published a review of
450 ICLS papers published in 93 journals between 1994 and 2013
and found that although 62% of those papers considered crop
components, and only 4% considered weeds, demonstrating a gap
in knowledge regarding weed management in ICLS.
Ecology-based integrated weed management in agroecosys-
tems for modern range production depends on the ability to
predict the consequences of management activities while under-
standing the patterns and processes of vegetation (Robertson and
Swinton, 2005) and seed bank changes (Davis et al., 2006). Grazing
by domestic animals is an important driver of global vegetation* Corresponding author.
E-mail address: mauricioschus@gmail.com (M.Z. Schuster).
http://dx.doi.org/10.1016/j.agee.2016.08.005
0167-8809/ã 2016 Elsevier B.V. All rights reserved.
Agriculture, Ecosystems and Environment 232 (2016) 232–239
Contents lists available at ScienceDirect
Agriculture, Ecosystems and Environment
journal homepage: www.elsevier.com/locate/agee
2. change (Díaz et al., 2007), and managing grazing intensity is
important for understanding the overall dynamics of any ICLS
(Kunrath et al., 2014).
The current work investigated the effects of different grazing
intensities on weed seedling emergence and seed banks in an ICLS.
We hypothesized that reduced grazing intensities would lower
weed interference and weed seed banks in an ICLS. We sought to
determine whether weed species composition, seedling emer-
gence, and seed bank size change with changing grazing intensity
in an ICLS; therefore, we compared the effects of different grazing
intensities on those factors during the 15th year of an ICLS
experiment under no-tillage management in subtropical Southern
Brazil.
2. Materials and methods
2.1. Site and treatment description
The long-term ICLS experiment used for this study was located
on a 22-ha field at the Espinilho Farm (Agropecuaria Cerro
Coroado) in São Miguel das Missões in Rio Grande do Sul State,
Brazil (28
560
1200
S latitude, 54
200
5200
W longitude, 465 m altitude).
This site has a warm humid summer (Cfa) climate according to the
Köeppen classification system, with an average temperature of
19
C and a yearly average precipitation of 1850 mm. The soil is a
clayey Oxisol (Rhodic Hapludox; Soil Survey Staff, 1999) that is
deep, well-drained and dark red with a clayey texture (540, 270
and 190 g kgÀ1
clay, silt and sand, respectively).
Before 1993, gallery forest and natural pasture covered the
experimental area. The area was converted into no-tillage cropland
in 1993, and from 1993 to 2001 soybeans (Glycine max (L.) Merr.)
were grown during the summer, and black oats (Avena strigosa
Schreb.) were grown during the winter. Since 2001, a soybean-beef
cattle ICLS experiment was established with two seasons: (1) the
winter season with cattle grazing a cover crop from May to
November; and (2) the summer season with soybean crops from
December to May.
During the winter season, black oat (cv. “Iapar 61”) was sown
(45 kg haÀ1
) with naturally reseeding Italian ryegrass (Lolium
multiflorum Lam. cv.“common”) to form a mixed winter pasture
system; the ryegrass heads out and drops seed at the end of each
winter grazing cycle and establishes itself each year by self-
seeding, which is the common practice in ICLS in the region (Neto
et al., 2014). Grazing was forage-based in a continuous stocking
system with steers weighing approximately 200 kg (crossbred
Angus, Hereford and Nellore) that entered the pasture system
when the aboveground forage mass was approximately 1.5 ton
haÀ1
of dry matter (approximately 25 cm sward height).
The treatments consisted of different grazing intensities during
the winter season that were determined by pasture vegetation
sward height. Sward heights of 10-, 20-, 30- and 40-cm (G10, G20,
G30 and G40, respectively) were considered in addition to a
reference non-grazed (NG) treatment. All treatments were
organized in a randomized complete block design with three
replications, with experimental units ranging from 0.8 to 3.2 ha.
Sward heights for each treatment, which corresponded to grazing
intensity (stocking), were controlled with variable stocking with
put-and-take steers that were added or removed from the plot as
required. The experimental unit size varied across treatments to
achieve the desired sward height with the desired minimum
number of three test animals. Sward heights were measured every
14 days using the sward stick method, using a graduated
measurement stick with a sliding marker. The sward height
recorded was the height at which the first forage leaf blade
contacted as the marker as it was lowered into the canopy.
Approximately 100 readings (points) were taken randomly in each
experimental unit. The grazing period was approximately
110 days; for more details see Kunrath et al. (2014).
At the end of the winter season (mid-November), the pasture
was desiccated with glyphosate (1750 g a.i. haÀ1
), chlorimuron-
ethyl (37 g a.i. haÀ1
, used for the first 11 years) and saflufenacil (35 g
a.i. haÀ1
, used for the past 4 years). The early desiccation (2–4 week
before sowing) was necessary for residue management and
facilitation of no-tillage soybean seeding (Bolliger et al., 2006).
In mid-December of each year, soybeans were sown with the
cultivar “Iguaçu” for the first three years and with “Nidera RR” (a
transgenic glyphosate-resistant cultivar) in the remaining years.
Soybeans were sown in rows spaced 45 cm a part at a seeding rate
of 45 seeds mÀ2
. Post-emergent herbicide was applied in mid-
January (chlorimuron-ethyl 37 g a.i. haÀ1
and clethodim 100 g a.i.
haÀ1
in the first three years and glyphosate at 1400 g a.i. haÀ1
in the
remaining years), and insecticides and fungicides were applied
following agronomic recommendations. Soybeans were harvested
in May each year.
2.2. Seed bank sampling and seed tray maintenance
Soil samples were collected from the central area of each plot,
where 56 soil cores were taken from the top 5-cm layer.
Seed banks were sampled before summer crop seeding in
November 2014, which marked the beginning of year 15 of the ICLS
experiment described above. Soil samples were collected manually
along four 56-m transects in each experimental unit using a steel
4.2-cm diameter probe, and 56 soil cores were extracted from the
top 5 cm of the central area of each plot. The four transects were
laid out in the “XX” pattern described by Wiles and Schweizer
(2002) to ensure an adequate spatial distribution of weed seed
bank sampling. Along the transects, two soil cores were collected
at 8-m intervals and combined into one 56-core composite sample
for each experimental unit.
All soil samples were processed to remove stones and root
fragments, then spread in 44 Â 38-cm plastic trays and placed in a
greenhouse for 12 months beginning in November 2014. Soil
moisture was maintained in the trays using regular sub-irrigation.
The seedling emergence method (Thompson et al., 1997) was used
to quantify the readily germinable seeds (not taking into account
dead or dormant seeds) in the soil seed bank (Ma et al., 2012).
During the seed tray maintenance, the lowest temperature was
0
C, and the maximum temperature was 38
C.
Emerged seedlings were periodically identified, counted and
removed from the plastic trays. Seedling identification was
conducted as described by Kissmann and Groth (1997) and Lorenzi
(2006). A two-week drought period was imposed in May 2015 to
break seed dormancy (De Cauwer et al., 2010). At the end of the
drought period, the soil in the trays was stirred and sub-irrigation
was reactivated. After the seedling emergence ceased, the samples
were stirred and placed in a room at 4
C for three weeks before
being subjected to alternating temperatures of 15 and 4
C for one-
week intervals and then returned to the greenhouse (Cardina et al.,
2002). This process was repeated until no additional seedlings
emerged.
2.3. Field weed seedling sampling
In each experimental unit in the field, weed seedling emergence
was quantified into two seasons: at the end of grazing (November
in 2014 and 2015) and during soybean cropping before post-
emergent herbicide application (mid-January in 2015 and 2016).
The emerged weed seedlings were identified and counted within
50 Â 50 cm quadrats placed at 14-m intervals in the central area of
each experimental unit and distributed along four 56-m transects
laid out in the “XX” pattern described previously. We calculated the
M.Z. Schuster et al. / Agriculture, Ecosystems and Environment 232 (2016) 232–239 233
3. population density of each species from the individual number of
each species per m2
. Plants were identified according to Kissmann
and Groth (1997) and Lorenzi (2006).
2.4. Data analysis
Shannon's diversity index was estimated for each treatment as
follows (Kent and Coker, 1992):
H ¼
XS
i¼1
ni
N
log2
ni
N
where N is the total number of individuals per plot, ni refers to the
number of individuals per species per plot and S describes the total
number of species.
The evenness of the species in each treatment was also
calculated using Shannon's diversity index as follows (Kent and
Coker, 1992):
J ¼
H
ln sð Þ
Changes in the weed species richness, Shannon’s diversity
index, the evenness index and the seed bank population densities
of Brachiaria plantaginea (Link) Hitchc., Gnaphalium spicatum Lam.
and Senecio brasiliensis Less. had normal distributions and
homogeneous variances according to the Shapiro-Wilk test
(P 0.05) and Bartlett’s test (P 0.05), respectively. These changes
were tested using a one-way ANOVA, and treatment means were
separated using the LSD test (P 0.05). The following data were not
normally distributed and had heterogeneous variances according
to the Shapiro-Wilk test (P 0.05) and Bartlett’s test (P 0.05),
respectively, and were therefore analysed using the non-paramet-
ric Kruskal-Wallis test: weed seed bank population density of
Conyza bonariensis (L.) Conquist, Conyza canadensis (L.) Cronquist,
Echium plantagineum L., Eleusine indica L. Gaertn, Heteranthera
reniformis Ruiz Pav., Ipomoea purpurea (L.) Roth, Nothoscordum
gracile (Aiton.) Steam., Phyllanthus tenellus Roxb., Plantago tomen-
tosa Lam., Richardia brasiliensis Gomes, Sida rhombifolia L., Solanum
americanum Mill., Soliva pterosperma (Juss.) Less., Stachys arvensis
L., Stellaria media (L.) Vill., Xanthium strumarium L. and seed bank
size; summer weed seedling density of C. bonariensis, Cyperus
esculentus L., Digitaria horizontalis Wild., E. indica, H. reniformis, P.
tenellus, R. brasiliensis, S. brasiliensis, S. americanum, X. strumarium
and total seedling emergence; and winter weed seedling density of
C. canadensis, E. plantagineum, G. spicatum, H. reniformis, N. gracile,
P. tenellus, S. brasiliensis, S. americanum, and S. arvensis. Treatment
comparisons were completed using the Mann-Whitney U test
(P 0.05). Weed seedling emergence during the winter (2014 and
2015) and summer (2015 and 2016) did not significantly differ
between the sampling years (P 0.80) according to a one-way
ANOVA and a Mann-Whitney U test (P 0.05), regardless of
whether the data were normally distributed.
The relationship between the weed community of the seed
banks and seedling emergence (winter + summer) was tested using
non-metric multidimensional scaling (NMDS). The dissimilarity
matrix was calculated using the Bray-Curtis index (Bray and Curtis,
1957):
BCjk ¼
Xs
i¼1
2aij À aik
Xs
i¼1
aij þ
Xs
i¼1
aik
where BCij is the dissimilarity between sites j and k, aij and aik are
the relative species abundance of species i in sites j and k,
respectively, and S is the combined total abundance of the species
in both communities. All ordinations were based on the Bray-
Curtis index for constructed NMDS following Ma et al. (2014). To
test for differences in the weed community among treatments, a
PERMANOVA of the dissimilarity matrix was conducted with 9999
Monte-Carlo iterations following McKenzie et al. (2016).
3. Results
3.1. Weed seed bank size, emerged seedling density and species
richness
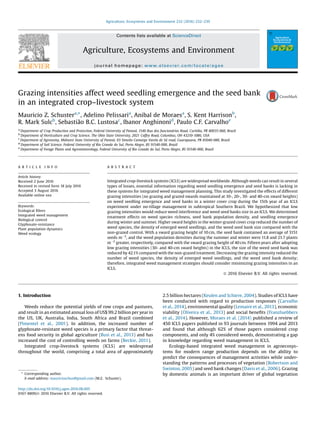
Grazing intensity affected the weed seed bank size (P 0.01)
and weed emergence during the summer (P 0.01) and winter
(P 0.001) seasons. Treatments with 15 years of low grazing
intensity (G30 and G40) had fewer weeds emerge compared with
the other grazing treatments (Fig. 1). Moderate grazing intensities
(G20) reduced weed emergence compared with a high grazing
intensity (G10); however, weed emergence in the no grazing
treatment was equivalent to the moderate grazing intensity
treatment during the summer period. The G10 grazing intensity
treatment resulted in an average weed seed bank size of 3150 and
in seedling population densities during the summer and winter
that were 12 and 22 individuals mÀ2
higher than the G40,
respectively. No emerged weed seedlings were found in the NG
treatment during the winter (Fig. 1).
The species richness of the weed seed bank and the number of
seedlings that emerged during the summer and winter decreased
significantly (P 0.0001) as sward height increased (Fig. 1);
however, no significant differences were observed in seed bank
richness between G30 and G40. Similarly, emerged seedling
species richness did not differ between G30 and G40 during the
winter and did not differ among G30, G40, and NG in the summer.
3.2. Species compositions of weed seed bank and emerged seedlings
Shannon's diversity index was affected by pasture management
(P 0.0001). The G10 treatment resulted in higher Shannon's
diversity indices than G30, G40, or NG (Table 1). According to the
LSD test (P 0.05), the winter and summer Shannon’s indices for
vegetation did not significantly differ between G10 and G20
(Table 1); however, the seed bank Shannon index for G10 was
significantly higher than for the other treatments (Table 1).
Treatment significantly affected species evenness (P 0.0001).
Species evenness for vegetation was lower for G10 than for G30
and G40. Seed bank evenness in G10 did not differ from G20, and
the G10 and G20 evenness values were significantly lower than
those for G30, G40, and NG (Table 1). G. spicatum, C. canadensis, and
R. brasiliensis dominated the soil seed bank, together accounting
for 55.3% of the soil seed bank. The dominant weed seedlings were
C. canadensis during the winter and B. plantaginea and R. brasiliensis
during the summer (50.3% and 42.2% of the seedlings, respectively
for winter and summer). Rumex obtusifolius L. and S. media were
found only in the weed seed bank (Table 2).
The species in the weed seed bank that were significantly
affected by the grazing treatments included B. plantaginea
(P 0.0001), C. canadensis (P 0.05), G. spicatum (P 0.001), R.
brasiliensis (P 0.001), N. gracile (P 0.05), S. brasiliensis (P
0.002), S. rhombifolia (P 0.05), S. arvensis (P 0.05) and S.
pterosperma (P 0.05; Table 2). For C. canadensis, G. spicatum, R.
brasiliensis and S. brasiliensis, treatment G10 contained more seeds
mÀ2
than all other treatments (P 0.05). The number of B.
plantaginea seeds was greatest in the G10 treatment, intermediate
in NG and G20, and least in the G30 and G40 treatments (P 0.05).
For S. rhombifolia, the seed numbers in the NG and G10 treatments
were greater than those in all other treatments. S. arvensis and S.
pterosperma were found in the NG, G10 and G20 treatments, with
higher seed population densities in the G10 treatment than in the
NG and G20 treatments. C. bonariensis, E. plantagineum, P. tenellus
234 M.Z. Schuster et al. / Agriculture, Ecosystems and Environment 232 (2016) 232–239
4. and N. gracile were identified in the G10 and G20 treatments, but
the only significant difference between the G10 and G20 treat-
ments was observed for N. gracile. The C. esculentus, Facelis retusa
(Lam.) Schultz-Bip. and Taraxacum officinale F.H. Wigg., which were
identified only in the G10 treatment (Table 2).
The weed seedling emergence of C. canadensis and S. brasiliensis
varied significantly among grazing treatments (P 0.0001 and
P 0.0004, respectively) during the winter. The average
population of C. canadensis in G10 was 10.4 individuals mÀ2
greater than the average population of C. canadensis in G40
(Table 2). S. brasiliensis was not identified in the G40 treatment, and
fewer individuals of that species were observed in G30 than in the
G10 and G20 treatments (Table 2). C. bonariensis, D. horizontalis,
E. indica, F. retusa, P. tomentosa, R. brasiliensis, S. pterosperma and
T. officinale were identified only in the G10 treatment. In addition,
E. plantagineum, P. tenellus, S. americanum and S. arvensis were
identified only in the G10 and G20 treatments, with no significant
differences between the treatment (P 0.05). Furthermore, these
weed seedling species were not identified in the NG treatment.
Regarding summer weed species, significant differences were
observed among the numbers of B. plantaginea (P 0.0007),
C. canadensis (P 0.002), D. horizontalis (P 0.0004), R. brasiliensis
(P 0.0004) and S. rhombifolia (P 0.001). No significant differ-
ences among the NG, G10 and G20 treatments were observed for B.
plantaginea, D. horizontalis, or R. brasiliensis; however, significant
differences were observed between the other treatments
Table 1
Analysis of Shannon's diversity index and species evenness at different grazing intensities.
Grazing intensities Shannon index Species evenness
Vegetation Seed bank Vegetation Seed bank
Winter Summer Winter Summer
10a
1.70 b 1.84 c 2.44 c 0.46 a 0.57 a 0.54 a
20 0.97 ab 1.65 bc 2.03 a 0.65 ab 0.75 b 0.49 a
30 0.43 a 1.46 b 1.87 a 0.85 bc 0.76 bc 0.75 c
40 0.69 a 1.16 a 1.96 a 0.96 c 0.88 c 0.77 c
NG – 1.26 a 2.25 b – 0.71 b 0.61 b
In each column, means with same letter do not differ at the 0.05 probability level according to LSD testing.
a
Sward height (cm); NG = non-grazed.
Fig. 1. Changes in winter (a,b) and summer (c,d) weed seedling emergence density (seedlings mÀ2
; a,c), species richness (no species; b,d), weed seed bank (e,f) density
(seeds mÀ2
at 0–5 cm soil profile; e), and richness (no species; f) after 15 years under different grazing intensities in an ICLS in Southern Brazil. Data points with different
lowercase letters indicate significant differences among the treatments according to the LSD test (P 0.05) for species richness and the Mann-Whitney U test (p 0.05) for
density (mÀ2
). Columns represent means, and error bars represent standard deviations.
M.Z. Schuster et al. / Agriculture, Ecosystems and Environment 232 (2016) 232–239 235
5. (P 0.05). C. canadensis and S. rhombifolia were not identified in the
NG treatment, and the population densities of those species were
greatest in the G10 treatment. C. canadensis, D. horizontalis and R.
brasiliensis were not identified in the G40 treatment, and the
highest seedling population densities of these species occurred in
the G10 treatment.
3.3. Similarity between the weed seed bank and the emerged seedlings
The NMDS results (Fig. 2) show that a continuous shift in the
species composition of weed vegetation (emerged seedlings)
occurred along the grazing intensity gradient via the dissimilarity
matrix (P 0.001). No differences were found in the weed seed
bank species composition between the G30 and G40 treatments
(P 0.90). The similarity between the weed seed bank and seedling
emergence values was greater in G10 than in the G20, G30, G40 and
NG treatments based on the distances of the dissimilarity matrix,
where a shorter distance indicates more similarity between the
emerged seedlings (i.e., vegetation) and the seed bank. Low
similarity was observed for the NG treatment (Fig. 2).
4. Discussion
4.1. Changes in the weed seed bank with grazing intensities in an ICLS
The soil seed bank is of particular concern to ecologists, farmers
and agricultural advisors because it is the main source of seeds for
future weed infestations on arable lands. Fifteen years after
adopting an ICLS with different sward heights, the sizes of the
weed seed banks differed from those in non-grazing areas (Fig. 1).
In previous research, Ikeda et al. (2007) demonstrated that using
ICLS reduced the size of the weed seed bank relative to no-tillage
mono-cropping systems, which is consistent with the results
shown in Fig. 1. However, our results demonstrate that the process
of reducing weed seed bank size when using an ICLS also depends
on grazing intensity (Fig. 1).
Table 2
Species population density changes in seedling emergence (seedlings mÀ2
) and seed banks (seeds mÀ2
at 0–5 cm soil depth) as affected by grazing intensity and in non-grazed
areas.
Species Seedling emergence Seed bank
Winter Summer
LF* NG** 10*** 20 30 40 NG 10 20 30 40 NG 10 20 30 40
Brachiaria plantaginea (Link)
Hitchc.
A ****0.19
a
0.09
a
1.65
a
2.71
a
1.48 a 0.19
bc
0.14 c 96.4 b 155.3
a
92.4 b 31.4 c 48.0 c
Conyza bonariensis (L.) Cronquist A 0.05 38.4 a 19.2 a
Conyza canadensis (L.) Cronquist A 10.7 a 2.5 b 0.83
c
0.28
d
1.90
a
0.30 b 0.14 b 159 b 643.2
a
336.0 b 96.0 c 76.8 c
Cyperus esculentus L. P 0.05
a
0.05
a
28.8
Digitaria horizontalis Willd. A 0.09 0.63
a
0.81
a
0.43 a 0.05 b 49.4 a 38.8 a
Echium plantagineum L. A 0.28 a 0.05
a
35.8 a 28.8 a
Eleusine indica L. Gaertn P 0.05 0.18 a 0.57
a
0.05
b
63.2 a 27.0 a 38.3 a 28.3 a 38.4 a
Facelis retusa (Lam.) Schultz-Bip. A 0.71 67.2
Gnaphalium spicatum Lam. A 0.23 a 0.05
a
433.7
b
729.6
a
518.4
ab
163.2
c
150.5
c
Heteranthera reniformis Ruiz
Pav.
P 0.62 a 0.19
a
0.17 a 0.62
a
0.05 a 0.38 a 0.52
a
14.4 a 9.6 a 9.6 a
Ipomoea purpurea (L.) Roth A 0.05 57.6 b 96.0 a 57.6 a 48.0 a
Nothoscordum gracile (Aiton.)
Steam.
P 0.14 a 0.09
a
97.6 a 11.2 b
Phyllanthus tenellus Roxb. A 0.28 a 0.33
a
0.04
a
0.28 a 0.09 a 27.3 a 32.1 a 28.8 a
Plantago tomentosa Lam. A 2.38 0.24 35.7 b 124.8
a
27.2 b 29.7 b 38.4 b
Richardia brasiliensis Gomes A 0.86 0.39
a
4.81
a
0.28
ab
0.14 b 40.0 b 604.8
a
28.8 b 27.1 b 38.4 b
Rumex obtusifolius L. P 9.6
Senecio brasiliensis Less. P 0.76 a 0.57
a
0.05
b
0.23
a
0.10 a 0.04 a 60.5 b 124.8
a
48.0 b 9.6 b 19.2 b
Sida rhombifolia L. P 0.67
a
0.29
ab
0.05 b 0.05
b
78.8 a 86.4 a 28.8 b 29.4 b 25.5 b
Solanum americanum Mill. A 0.05 a 0.05
a
0.05
a
0.19 a 29.4 a 27.0 a 25.8 a
Soliva pterosperma (Juss.) Less. A 3.57 33.2 b 144.0
a
48.0 b
Stachys arvensis L. A 0.33 a 0.05
a
16.1 b 211.2 a 19.2 b
Stellaria media (L.) Vill. A 403.2
a
9.6 b
Taraxacum officinale F.H. Wigg. P 0.67 42.5
Xanthium strumarium L. A 0.21
a
0.05
a
0.05 a 32.5 a 28.0 a 29.2 a 9.6 a
*
LF = Life cycle (A = annual; P = perennial); **NG = non-grazed; *** Sward height (cm) during the pasture phase; ****For each variable, means within a time period (winter or
summer) of the seed bank data followed by the same letters and the same lowercase letters in a column do not differ according to LSD testing (p 0.05) for homogeneous data
and according to Mann-Whitney U testing (p 0.05) for non-homogeneous data. Blank fields indicate that the species was not found.
236 M.Z. Schuster et al. / Agriculture, Ecosystems and Environment 232 (2016) 232–239
6. Low grazing intensities (G30 and G40) reduced the weed seed
bank by 42% compared with the NG system. However, high grazing
intensity (G10) increased the weed seed bank by 301% compared
with the NG system. Low grazing intensity may allow taller swards
to be more competitive with weeds (i.e., for light and space) than
high grazing intensity, thereby reducing growth and fecundity
(Baskin and Baskin, 2014) resulting as a similar ecological filter of
non-grazed cover crops (McKenzie et al., 2016); some winter
weeds produced seed at the end of the grazing period in the high
grazing intensity (e.g., S. brasiliensis) that contributed to increas the
soil seed banks. Conversely, N inputs from animal manure and
urine may increase seed decay in the grazed treatments, reducing
the longevity of the weed seeds (Davis, 2007).
4.2. Changes in seedling emergence with grazing intensities in an ICLS
Plant residues on the soil surface create a physical barrier,
inhibiting seed germination and weed growth (Mohler and Asdale,
1993), and weeds in the summer season (Table 2) represent
emerged seedlings influenced by pasture residue that compete
with soybean. In a related study, each centimetre of growth
accounted for an additional 98 kg haÀ1
of forage dry matter during
winter, resulting in summer residues of 1.5, 3.2, 4.5 and 5.6 ton
haÀ1
in the 10-, 20-, 30- and 40-cm grazing intensity treatments,
respectively (Kunrath et al., 2014). The low grazing intensities (G30
and G40) reduced the emergence of B. plantaginea (93%),
R. brasiliensis (96%) and S. rhombifolia (92%) seedlings compared
to a high grazing intensity (G10) in the summer season (Table 2). It
is possible that low grazing intensities resulted in a sufficient
amount of pasture residue to create a physical barrier for these
species; Webster et al. (2016) investigated Amaranthus palmeri
suppression by a range of dry matter levels of rye and found that
5370 kg haÀ1
of rye caused a 50% reduction in the emergence of
seedling for this specie. However, the surface residues can have
potential allelopathic effects, and the presence of less residue
under high grazing intensity may decrease the allelopathic
compounds released from black oat/ryegrass (i.e., organic acids
from decomposition). Additional research will be required to
determine if black oat/ryegrass surface residues exert allelopathic
effects on weeds.
Weeds in the winter season (Table 2) result from the emergence
of seedlings that are influenced by the shade provided by the black
oats/ryegrass at a given sward height, and the C. canadensis
seedlings emerging during the winter accounted for 1.66% of the
total seed bank in the G10 treatment and 0.36% of the total seed
bank in the G40 treatment (Table 2). C. canadensis was 4.6 times
more prevalent in the G10 seed bank than in the G40 seed bank,
resulting in 10.7 and 0.3 emerged seedlings mÀ2
, respectively for
G10 and G40 treatments (seedling emergence of C. canadensis in
winter was 38 times more prevalent in the G10 treatment than in
the G40 treatment; Table 2). Nandula et al. (2006) showed that the
germination of C. canadensis was severely reduced in the dark
(0–15% of germination) relative to light-exposed seeds (0–61% of
germination) and increased the sward height increased the
interception of light by forage and reduced the amount of light
reaching the topsoil. In the summer season, the emergences of C.
canadensis seedlings was 6 times more prevalent in the G10
treatment than in the G20 treatment and not found in the NG and
G40 treatments, possibly due to the increased residual dry matter
content present when the grazing intensity is reduced, which cover
the soil and limits the amount of light that reaches the topsoil.
Tracy and Davis (2009) showed that the reduction in weed
biomass in no-tillage ICLS was approximately 4.5 times higher than
weed biomass in conventional systems. Our research demonstrat-
ed that areas with low grazing intensities (G30 and G40) had 2.2
times fewer weeds mÀ2
than areas without grazing (Fig. 1). De
Bruijin and Bork (2006) demonstrated that managing grazing
intensity provides a biological control for weeds in perennial
forage via weed defoliation, which suggests that the same control
can be achieved in an ICLS.
4.3. Similarity between the weed seed bank and emerged seedlings in
an ICLS subjected to different grazing intensities
The similarity between the weed seed bank and seedling
emergence was high in the G10 treatment and substantially lower
in the G20, G30 and G40 treatments (Fig. 2), potentially because
the desirable forage plants maintained sufficient leaf areas in the
moderate- and low-grazing intensity for the production of tillers,
roots, young leaves and stems (Kunrath et al., 2014) to compete
with any emerging weed seedlings. The forage in ICLS subjected to
moderate- and low-grazing intensity covered the soil during the
grazing period, and the resulting forage residues continued to
cover the soil during the summer cropping season, which might
have reduced weed recruitment from the weed seed bank
(Pelissari et al., 2013).
In the weed seed banks of G10–G40, the species richness
decreased from 21.3 to 9.3 and the seedling emergence decreased
from 11.3 to 2.3 and from 9.6 to 3.3 during the winter and summer,
respectively (Fig. 1). This observation indicates that the seed bank
changed more slowly than the seedling emergence because the
former was reduced by 56%, whereas the latter was reduced by 79%
and 66% during the winter and summer, respectively, as the grazing
intensity decreased. One explanation for this finding might be that
some species with high seed dormancy and longevity character-
istics remain in the seed bank for several years after a species of
vegetation has disappeared (Baskin and Baskin, 2014). For
example, G. spicatum, which dominated the weed seed bank, is
a specie that is native to the pampa rangeland (natural pastures)
and covered the experimental area before the ICLS trial was
implemented. As a result, the large seed bank in the soil may have
resulted in part from the historical legacy effect, although we found
Fig. 2. Non-metric multidimensional scaling (NMDS) ordination plots based on the
species compositions of seedling emergence (winter + summer) and the seed bank
in an ICLS. Stress value = 0.1566. Ordinations based on the Bray-Curtis dissimilarity
matrix for relative abundance. V: seedling emergence (vegetation), S: seed bank,
and NG: non-grazing. Numbers indicate the sward heights (cm).
M.Z. Schuster et al. / Agriculture, Ecosystems and Environment 232 (2016) 232–239 237
7. no confirmatory reports on the longevity of G. spicatum in seed
banks. It is also likely that incomplete weed control in the early
years of the experiment (prior to glyphosate use) and the
importation of G. spicatum seeds via wind (the seeds are dispersed
as pappus-bearing achenes) contributed to the dominance of this
specie in the seed bank.
Seeds of I. purpurea and X. strumarium were present in the seed
banks of all treatments, but none or few emerged as seedlings
(Table 2). Germination conditions for these species were not
optimal until late in the season, so its late emergence (Singh et al.,
2012; Norsworthy 2004). In addition, when temperature con-
ditions became optimal germination, the soybeans had established
a complete canopy. The microclimate under a complete soybean
canopy is obviously less favourable. However, weed emergence did
not completely cease with canopy formation, and late-season weed
emergence and reproduction beneath the soybean canopy may
have contributed to soil seed banks. Additional study is required to
determine how grazing intensities in an ICLS influence seasonal
weed seedling emergence patterns and seedling recruitment at the
species level.
4.4. Weed community assembly in an ICLS subjected to different
grazing intensities
Weed community assembly was controlled by the grazing
intensity; an ICLS with high grazing intensity had a higher Shannon's
diversityindex value,indicatingthat many rare species were present
(Booth et al., 2003). The complexityof the weed community is one of
the factors that cause difficulty in to planning integrated weed
management and chemical weed control in an ICLS.
The species evenness was calculated using Shannon's index and
variedfrom0 to 1, where 0 indicatesthat the speciescommunity was
dominated by one species (Booth et al., 2003). Our results
demonstrate that grazing intensity was directly linked to the weed
community structure wherein the cosmopolitan weeds (e.g., C.
canadensis) dominated community assembly under conditions of
high grazing intensity that had less evenness value (Table 1). It is
Possible that high grazing intensities promote intense weed
defoliation and trampling by the grazing animals, which could
result in the selection of certain weeds with great plasticity and
adaptability to high-intensity grazing that tolerate (i.e., through
biochemical compounds that reduce tissue accessibility and
palatability) or avoid (i.e., through meristem availability) the
stresses imposed by animals in the winter season. In the summer
season, the high grazing intensities reducethe amountof residueon
the soil surface and may reduce the stress factors imposed on the
establishment of cosmopolitan weeds (i.e., reduced the potential
allelopathic effects and the physical barrier of surface residues).
The grazing intensities did not affect the weed seed bank or
seedling emergence of either H. reniformis or P. tenellus (Table 2).
Some weed species in the seed bank and aboveground vegetation
disappeared as the grazing intensity decreased (Table 2; e.g., C.
esculentus was found only in G10 treatment). We did not measure
annual weed population dynamics (seed rain inputs) directly;
therefore, were unable to determine the rate of disappearance of
some species or species invasion, and the present data can support
only a speculative discussion. Additional research is necessary to
determine why some weed species disappeared.
4.5. Implications of different grazing intensities for weed management
in an ICLS
Our study considers an area of great interest for world food
security, and the results have several potential implications for
integrated weed management beyond the possible use of grazing
intensities as a tool for biological weed control. For example,
minimizing grazing intensities reduced seedlings emergence of C.
canadensis and S. brasiliensis in winter and B. plantaginea, R.
brasiliensis and S. rhombifolia in summer (Table 2).
We analysed the costs of field desiccation before planting
soybeans and found that different weed species compositions
occurred among the treatments (Table 2), which would also
require different control methods (following Rodrigues and
Almeida, 2011). Treatment G10 contained R. brasiliensis and P.
tomentosa, which require approximately 2400 g a.i. haÀ1
of
glyphosate for control, whereas treatment G20 contained S.
americanum, which requires approximately 960 g a.i. haÀ1
of
glyphosate for control. Treatments G30, G40 and NG require
approximately 480 g a.i. haÀ1
of glyphosate for weed control. The
cost of 480 g a.i. of glyphosate is approximately 4.15 US$.
Furthermore, treatments G10, G20, and G30 contained C.
canadensis populations above the economic threshold during the
winter (assuming threshold similar to that of C. bonariensis for
soybeans as defined by Trezzi et al., 2015). C. canadensis has
developed glyphosate-resistance and can severely reduce soybean
production (Beckie, 2011). The cost of controlling glyphosate-
resistant C. canadensis can reach approximately 45 US$ haÀ1
(Trezzi
et al., 2015). In the G10 treatment, C. canadensis required control
beyond winter desiccation because the density of the emerged C.
canadensis seedlings in the summer crop was high (Table 2) and
requires multiple herbicide applications for control (Trezzi et al.,
2015). When considering only weed-control costs, the most
economical treatments were the G40 and NG treatments, with
herbicide costs of approximately 4.15 US$ haÀ1
, whereas the G20
and G30 treatments had a herbicide costs of 53.3 US$ haÀ1
, and the
G10 treatment had a herbicide cost of approximately 110.75 US
$ haÀ1
(Trezzi et al., 2015). When conducting an economic analysis
of this protocol, Oliveira et al. (2013) found overall gross margins of
890, 861, 712, 643 and 431 US$ (corrected for the current price of 1
US$ = 4 Brazilian reals) for G10, G20, G30, G40 and NG, respectively.
In this case, however, the authors assumed that the costs for weed
control were equal among the treatments. Based on our research
results and after adjusting the gross margin as a function of the
reduced cost of weed control, we found gross margins of 890, 918,
769, 819 and 538 US$ for the G10, G20, G30, G40 and NG
treatments, respectively. This relatively simple economic analysis
of the ICLS suggests that the optimal grazing intensity treatment
for attaining economic goals was the G20 treatment, despite the
lower weed control cost of the G40 treatment.
Considering current discussions of the sustainability of
glyphosate and the increased resistance of weeds to glyphosate
(Busi et al., 2013), these results demonstrate that low grazing
intensities (G40) require lower glyphosate application rates than
higher grazing intensities (G10) because of the weed species that
are present. Beckie (2011) showed that increasing glyphosate
application rates accelerates the process by which weeds become
glyphosate resistant. Thus, using low grazing intensities in ICLS
could improve the temporal sustainability of glyphosate. Further-
more, Davis et al. (2006) indicate that improving our ability to
reduce the weed seed bank is critical for integrated weed
management. This research suggests that using low grazing
intensities in ICLS is a form of biological control that can be used
to reduce the weed seed bank in the cropping areas of the ICLS
(Fig. 1); more specifically, minimizing grazing intensities reduces
seeds in the soil seed banks of B. plantaginea, C. canadensis, G.
spicatum, P. tomentosa, R. brasiliensis, S. brasiliensis and S.
rhombifolia (Table 2).
5. Conclusion
In an ICLS, the grazing intensity significantly affects the
emergence of weed seedlings and the size of the weed seed bank.
238 M.Z. Schuster et al. / Agriculture, Ecosystems and Environment 232 (2016) 232–239
8. Specifically, decreasing the grazing intensity to enable greater
sward height in winter-grazed cover crops reduces the number of
weed species, the density of emerged weed seedlings, and the
weed seed bank size. Integrated weed management strategies
should consider grazing intensities in ICLS.
Acknowledgements
The financial support for this work provided by CAPES
(Brazilian Research agency) is greatly appreciated. The authors
are grateful for the help provided by Marcos Pscheidt and Gabriel
Antonio Cassol during the field sampling.
References
Baskin, C.C., Baskin, J.M., 2014. Seeds, Ecology, Biogeography and Evolution of
Dormancy and Germination. second ed. Academic Press, San Diego, CA.
Beckie, H.J., 2011. Herbicide-resistant weed management: focus on glyphosate. Pest
Manag. Sci. 67, 1037–1048. doi:http://dx.doi.org/10.1002/ps.2195.
Bolliger, A., Magid, J., Amado, T.J.C., Neto, F.S., Ribeiro, M.F.S., Calegari, A., Ralsch, R.,
Neergaard, A., 2006. Taking stock of the Brazilian zero-till revolution: a review
of landmark research and farmers' practice. Adv. Agron. 91, 47–64. doi:http://dx.
doi.org/10.1016/S0065-2113(06)91002-5.
Booth, B.D., Murphy, S.D., Swanton, C.J., 2003. Weed Ecology in Natural and
Agricultural Systems. CABI Publication, Wallingford, Oxon, UK.
Bray, J.R., Curtis, J.T., 1957. An ordination of the upland forest communities of
Southern Wisconsin. Ecol. Monogr. 27, 235–349. doi:http://dx.doi.org/10.2307/
1942268.
Busi, R., Vila-Aiub, M.M., Beckie, H.J., Gaines, T.A., Goggin, D.E., Kaundun, S.S.,
Lacoste, M., Neve, P., Nissen, S.J., Norsworthy, J.K., Renton, M., Shaner, D.L.,
Tranel, P.J., Wright, T., Yu, Q., Powles, S.B., 2013. Herbicide-resistant weeds: from
research and knowledge to future needs. Evol. Appl. 8,1218–1221. doi:http://dx.
doi.org/10.1111/eva.12098.
Cardina, J., Herms, C.P., Doohan, D.J., 2002. Crop rotation and tillage system effects
on weed seedbanks. Weed Sci. 50, 448–460. doi:http://dx.doi.org/10.1614/
0043-1745(2002)050[0448:CRATSE]2.0.CO;2.
Carvalho, P.C.F., Franzlubbers, A.J., Lemaire, G., Sulc, M.R., Dedieu, B., 2014. Towards
agricultural sustainability through integrated crop-livestock systems. II.
Production responses. Renew. Agric. Food Syst. 29, 192–194. doi:http://dx.doi.
org/10.1016/j.agee.2014.04.028.
Díaz, S., Lavorel, S., McIntyre, S., Falczuk, V., Casanoves, F., Milchunas, D.G., Skarpe,
C., Rusch, G., Sternberg, M., Noy-Meir, I., Landsberg, J., Zhang, W., Clark, H.,
Campbell, B.D., 2007. Plant trait responses to grazing – a global synthesis. Glob.
Change Biol. 13, 313–341. doi:http://dx.doi.org/10.1111/j.1365-
2486.2006.01288.x.
Davis, A.S., Anderson, K.I., Hallett, S.G., Renner, K.A., 2006. Weed seed mortality in
soils with contrasting agricultural management histories. Weed Sci. 54,
291–297. doi:http://dx.doi.org/10.1043/0043-1745(2006)54[291:WSMISW]2.0.
CO;2.
Davis, A.S., 2007. Nitrogen fertilizer and crop residue effects on seed mortality and
germination of eight annual weed species. Weed Sci. 55,123–128. doi:http://dx.
doi.org/10.1614/WS-06-133.1.
De Bruijin, S.L., Bork, E.W., 2006. Biological control of Canada thistle in temperate
pastures using high density rotational cattle grazing. Biol. Contr. 36, 305–315.
doi:http://dx.doi.org/10.1016/j.biocontrol.2005.10.007.
De Cauwer, B., Van den Berge, K., Cougnon, M., Bulcke, R., Reheul, D., 2010. Weed
seedbank responses to 12 years of applications of composts, animal urines or
mineral fertilizers. Weed Res. 50, 425–435. doi:http://dx.doi.org/10.1111/j.1365-
3180.2010.00796.x.
Franzluebbers, A.J., Lemaire, G., de Faccio Carvalho, P.C., Sulc, R.M., Dedieu, B., 2014.
Toward agricultural sustainability through integrated crop-livestock systems.
III. Social aspects. Renew Agric. Food Syst. 29, 192–194. doi:http://dx.doi.org/
10.1017/S174217051400012X.
Ikeda, F.S., Mitja, D., Vilela, L., Carmona, R., 2007. Banco de sementes no solo em
sistemas de cultivo lavoura-pastagem. Pesq. Agropec. Bras. 42, 1545–1551. doi:
http://dx.doi.org/10.1590/S0100-204X2007001100005.
Kent, M., Coker, P., 1992. Vegetation Description and Analysis: A Practical Approach.
Belhaven Press, London.
Keulen, H., Schiere, H., et al., 2004. Crop-livestock system: old wine in new bottles?
In: Fisher, T. (Ed.), New Directions for a Diverse Planet: Proceedings of the IV
International Crop Science Congress, Australia.
Kissmann, K.G., Groth, D., 1997. Plantasinfestantes e Nocivas, Obra em vol. 3. BASF,
São Paulo.
Kunrath, T.R., Cadenazzi, M., Brambilla, D.M., Anghinoni, I., Moraes, A., Barro, R.S.,
Carvalho, P.C.F., 2014. Management targets for continuously stocked mixed oat
X annual ryegrass pasture in a no-till integrated crop-livestock system. Eur. J.
Agron. 57, 71–76. doi:http://dx.doi.org/10.1016/j.eja.2013.09.013.
Lemaire, G., Franzluebbers, A., Carvalho, P.C.F., Dedieu, B., 2013. Integrated crop-
livestock systems: strategies to achieve synergy between agricultural
production and environmental quality. Agric. Ecosyst. Environ. 190, 4–8. doi:
http://dx.doi.org/10.1016/j.agee.2013.08.009.
Lorenzi, H.M., 2006. Identificação e Controle De Plantas Daninhas, sixth ed. Nova
and Publishing House, Odessa, São Paulo: Instituto Plantarum.
Ma, M., Zhou, X., Ma, Z., Du, G., 2012. Composition of the soil seed bank and
vegetation changes after wetland drying and soil salinization on the Tibetan
Plateau. Ecol. Eng. 44, 18–24. doi:http://dx.doi.org/10.1016/j.
ecoleng.2012.03.017.
Ma, Z., Ma, M., Baskin, J.M., Baskin, C.C., Li, J., Du, G., 2014. Responses of alpine
meadow seed bank and vegetation to nine consecutive years of soil fertilization.
Ecol. Eng. 70, 92–101. doi:http://dx.doi.org/10.1016/j.ecoleng.2014.04.009.
McKenzie, S.V., Goosey, H.B., O'Neill, K.M., Menalled, F.D., 2016. Impact of integrated
sheep grazing for cover crop termination on weed and ground beetle
(Coleoptera: Carabidae) communities. Agric. Ecosyst. Environ. 218, 141–149.
doi:http://dx.doi.org/10.1016/j.agee.2015.11.018.
Mohler, C.L., Asdale, J.R., 1993. Response of weed emergence to rate of Vicia villosa
Roth and Secale cereale L. Residue. Weed Res. 487–499. doi:http://dx.doi.org/
10.1111/jj.1365-3180.1993. tb01965.x.
Moraes, A., Carvalho, P.C.F., Lustosa, S.B.C., Lang, C.R., Deiss, L., 2014. Research on
integrated crop-livestock systems in Brazil. Rev. Ciênc. Agron. 45, 1024–1031.
doi:http://dx.doi.org/10.1590/S1806-66902014000500018.
Nandula, V.K., Eubank, T.W., Poston, D.H., Koger, C.H., Readdy, K.N., 2006. Factors
affecting germination of horseweed (Conyza canadensis). Weed Sci. 54, 898–
902. doi:http://dx.doi.org/10.1614/WS-06-006R2.1.
Neto, A.B., Savian, J.V., Schons, R.M.T., Bonnet, O.J.F., Canto, M.W., Moraes, A.,
Lemaire, G., F Carvalho, P.C., 2014. Italian ryegrass establishment by self-seeding
in integrated crop-livestock systems: effects of grazing management and crop
rotation strategies. Eur. J. Agron. 57, 77–83. doi:http://dx.doi.org/10.1016/j.
eja.2014.04.005.
Norsworthy, J.K., 2004. Soybean canopy formation effects on pitted morningglory
(Ipomoea lacunosa), common cocklebur (Xanthium strumarium), and sicklepod
(Senna obtusifolia) emergence. Weed Sci. 52, 954–960. doi:http://dx.doi.org/
10.1614/WS-04-043R.
Oliveira, C.A.O., Bremm, C., Anghinoni, I., Moraes, A., Kunrath, T.R., de Faccio
Carvalho, P.C., 2013. Comparison of an integrated crop-livestock system with
soybean only: economic and production responses in southern Brazil. Renew.
Agric. Food Syst. 29, 230–238. doi:http://dx.doi.org/10.1017/
S1742170513000410.
Pelissari, A., Victoria, R., Mendonça, C.G., Lustosa, S.B.C., Marques, P.F., 2013.
Fundamentação Teórica Para o Controle De Plantas Daninhas Em Integração
Lavoura-pecuária. Silva, J. F. Martins, D. Manual De Aulas Práticas De Plantas
Daninhas. Funep, Jaboticabal, pp. 31–44.
Pimentel, D., McNair, S., Janecka, J., Wightman, J., Simonds, C., O‘Connell, C., Wong,
E., Russel, L., Zern, J., Aquino, T., Tsomondo, T., 2001. Economic and
environmental threats of alien plant, animal, and microbe invasions. Agric.
Ecosyst. Environ. 84, 1–20. doi:http://dx.doi.org/10.1016/S0167-8809(00)
00178-X.
Robertson, G.P., Swinton, S.M., 2005. Reconciling agricultural productivity and
environmental integrity: a grand challenge for agriculture. Front. Ecol. Environ.
3, 38–46. doi:http://dx.doi.org/10.1890/1540-9295(2005)003[0038:RAPAEI]
2.0.CO;2.
Rodrigues, B.N., Almeida, F.S., 2011. Guia De Herbicidas. 6. Grafmarke, Londrina.
Singh, M., Ramirez, A.H.M., Sharma, S.D., Jhala, A.J., 2012. Factors affecting the
germination of tall morningglory (Ipomoea purpurea). Weed Sci. 60, 64–68. doi:
http://dx.doi.org/10.1614/WS-D-11-00106.1.
Soil Survey Staff,1999. Soil taxonomy: a basic system of soil classification for making
and interpreting soil surveys. USDA Natural Resource Conservation Service
Agriculture Handbook No. 436. U.S. Government Printing Office, Washington, DC.
Thompson, K., Bakker, J.P., Bekker, R.M., 1997. The soil seed banks of north west
Europe: methodology. Density and Longevity. Cambridge University Press,
Cambridge, UK.
Tracy, B.F., Davis, A.S., 2009. Weed biomass and species composition as affected by
an integrated crop-livestock system. Crop Sci. 49, 1523–1530. doi:http://dx.doi.
org/10.2135/cropsci2008.08.0488.
Trezzi, M.M., Vidal, R.A., Patel, F., Miotto, E., Debastiani, F., Balbinot Jr., A.A.,
Mosquen, R., 2015. Impact of Conyza bonariensis density and establishment
period on soybean grainyield, yield components and economic threshold. Weed
Res. 55, 34–41. doi:http://dx.doi.org/10.1111/wre.12125.
Webster, T.M., Simmons, D.B., Culpepper, A.S., Grey, T.L., Bridges, D.C., Scully, B.T.,
2016. Factors affecting potential for Palmer amaranth (Amaranthus palmeri)
suppression by winter rye in Georgia, USA. Field Crops Res. 192, 103–109. doi:
http://dx.doi.org/10.1016/j.fcr.2016.04.020.
Wiles, L., Schweizer, E., 2002. Spatial dependence of weed seed banks and strategies
for sampling. Weed Sci. 50, 595–606. doi:http://dx.doi.org/10.1614/0043-1745
(2002)050[0595:SDOWSB]2.0.CO;2.
M.Z. Schuster et al. / Agriculture, Ecosystems and Environment 232 (2016) 232–239 239