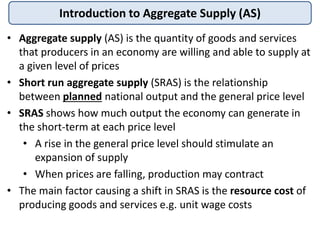
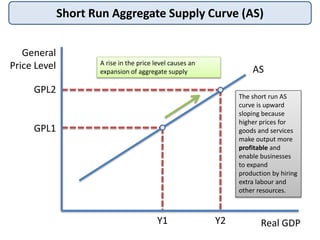
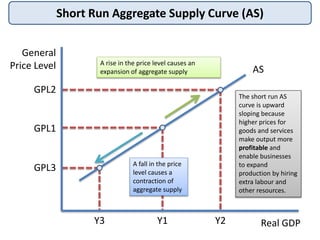
1) Short run aggregate supply (SRAS) shows the relationship between the planned national output and the general price level in the short-term at each price point.
2) The SRAS curve slopes upward, as higher prices make output more profitable, enabling businesses to expand production by hiring extra resources.
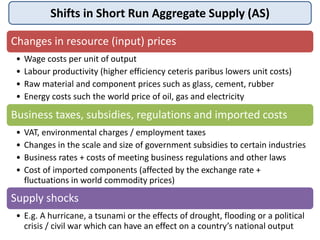
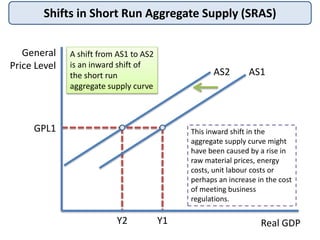
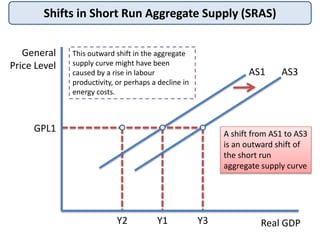
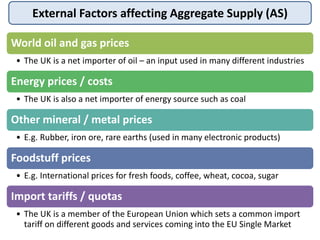
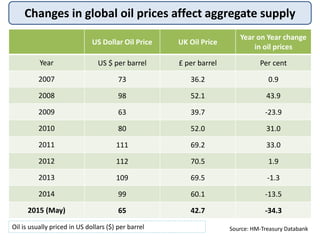
3) Shifts in SRAS can be caused by changes in input prices like wages, materials, and energy, as well as supply shocks and business costs/regulations.