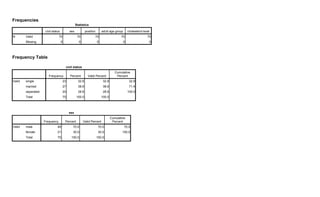
1. Frequencies
Statistics
civil status sex position adult age group cholesterol level
N Valid 70 70 70 70 70
Missing 0 0 0 0 0
Frequency Table
civil status
Frequency Percent Valid Percent
Cumulative
Percent
Valid single 23 32.9 32.9 32.9
married 27 38.6 38.6 71.4
separated 20 28.6 28.6 100.0
Total 70 100.0 100.0
sex
Frequency Percent Valid Percent
Cumulative
Percent
Valid male 49 70.0 70.0 70.0
female 21 30.0 30.0 100.0
Total 70 100.0 100.0
2. position
Frequency Percent Valid Percent
Cumulative
Percent
Valid administrator 14 20.0 20.0 20.0
faculty 20 28.6 28.6 48.6
staff 26 37.1 37.1 85.7
maintenance 10 14.3 14.3 100.0
Total 70 100.0 100.0
adult age group
Frequency Percent Valid Percent
Cumulative
Percent
Valid young adult 17 24.3 24.3 24.3
middle adult 53 75.7 75.7 100.0
Total 70 100.0 100.0
cholesterol level
Frequency Percent Valid Percent
Cumulative
Percent
Valid desirable 34 48.6 48.6 48.6
borderline 36 51.4 51.4 100.0
Total 70 100.0 100.0
1. Present the respondents' profile when grouped according to civil status, position and sex.
Group Statistics
respondent N Mean Std. Deviation Std. Error Mean
cholesterol level before male 49 203.8776 21.14300 3.02043
female 21 203.3810 22.31698 4.86996
3. Independent Samples Test
Levene's Test for Equality of
Variances t-test for Equality of Means
95% Confidence Interval of the
Difference
F Sig. t df Sig. (2-tailed) Mean Difference
Std. Error
Difference Lower Upper
cholesterol level before Equal variances assumed .024 .877 .089 68 .930 .49660 5.60632 -10.69063 11.68383
Equal variances not
assumed
.087 36.119 .931 .49660 5.73058 -11.12422 12.11742
2.Is there a significant difference on the cholesterol level of male and female respondents before taking the mineral supplement ?
There a no significant difference on the cholesterol level of male (203.8776) and female (203.3810) respondents before taking the mineral supplement, t(68) =.089,
pv =0.930.
Group Statistics
respondent N Mean Std. Deviation Std. Error Mean
cholesterol level after male 49 198.9184 20.51609 2.93087
female 21 194.3810 20.38744 4.44890
Independent Samples Test
Levene's Test for Equality of
Variances t-test for Equality of Means
95% Confidence Interval of the
Difference
F Sig. t df Sig. (2-tailed) Mean Difference
Std. Error
Difference Lower Upper
cholesterol level after Equal variances assumed .026 .872 .850 68 .399 4.53741 5.34116 -6.12071 15.19554
Equal variances not
assumed
.852 38.134 .400 4.53741 5.32755 -6.24639 15.32122
3. Is there a significant difference on the cholesterol level of male and female respondents after taking the mineral supplement ?
There is nosignificant difference on the cholesterol level of male (198.9184) and female (194.3810) respondents after taking the mineral supplement, t(68) =.850,
pv =0.339.
4. T-Test
Paired Samples Statistics
Mean N Std. Deviation Std. Error Mean
Pair 1 male cholesterol level before 203.8776 49 21.14300 3.02043
male cholesterol level after 198.9184 49 20.51609 2.93087
Paired Samples Correlations
N Correlation Sig.
Pair 1 male cholesterol level before &
male cholesterol level after
49 .957 .000
Paired Samples Test
Paired Differences
t df Sig. (2-tailed)
Mean Std. Deviation Std. Error Mean
95% Confidence Interval of the
Difference
Lower Upper
Pair 1 male cholesterol level before
- male cholesterol level after
4.95918 6.13718 .87674 3.19638 6.72199 5.656 48 .000
4. Is there a significant difference on the cholesterol level of the male respondents before and after taking the mineral supplement?
There is a significant difference on the cholesterol level of the male respondents before ( 203.8776 ) and after (198.9184) taking the mineral supplement, t(48) =5.656, pv =0.000 ?
5. T-Test
Paired Samples Statistics
Mean N Std. Deviation Std. Error Mean
Pair 1 female cholesterol level before 203.3810 21 22.31698 4.86996
female cholesterol level after 194.3810 21 20.38744 4.44890
Paired Samples Correlations
N Correlation Sig.
Pair 1 female cholesterol level before
& female cholesterol level after
21 .908 .000
Paired Samples Test
Paired Differences
t df Sig. (2-tailed)
Mean Std. Deviation Std. Error Mean
95% Confidence Interval of the
Difference
Lower Upper
Pair 1 female cholesterol level
before - female cholesterol
level after
9.00000 9.35414 2.04124 4.74204 13.25796 4.409 20 .000
5. Is there a significant difference on the cholesterol level of the female respondents before and after taking the mineral supplement?
There is a significant difference on the cholesterol level of the female respondents before (203.3810) and after (194.3810) taking the mineral supplement, t(20) =4.409, pv =0.000 ?
6. Descriptives
N Mean Std. Deviation Std. Error
95% Confidence Interval for Mean
Minimum Maximum
Lower Bound Upper Bound
monthly salary single 23 16976.5217 4865.97707 1014.62636 14872.3155 19080.7280 10860.00 31000.00
married 27 15658.5185 4953.19454 953.24273 13699.1000 17617.9370 9000.00 26000.00
separated 20 15957.0000 4734.69623 1058.71026 13741.0940 18172.9060 11100.00 32000.00
Total 70 16176.8571 4826.94116 576.92982 15025.9136 17327.8006 9000.00 32000.00
cholesterol level after single 23 198.6957 22.34326 4.65889 189.0337 208.3576 165.00 234.00
married 27 196.1111 21.16843 4.07387 187.7372 204.4851 166.00 237.00
separated 20 198.2000 17.90501 4.00368 189.8202 206.5798 169.00 240.00
Total 70 197.5571 20.43699 2.44269 192.6841 202.4302 165.00 240.00
ANOVA
Sum of Squares df Mean Square F Sig.
monthly salary Between Groups 2.293E7 2 1.146E7 .485 .618
Within Groups 1.585E9 67 2.365E7
Total 1.608E9 69
cholesterol level after Between Groups 94.535 2 47.268 .110 .896
Within Groups 28724.736 67 428.727
Total 28819.271 69
6. Is there a significant difference on the monthly salary and cholesterol level after taking the mineral supplement when grouped according to civil status, and position ?
There is no significant difference on the monthly salary, f(2,67) = 0.485, pv = 0.618 and cholesterol level after taking the mineral supplement f(2,67) = 0.110, pv = 0.896 when grouped
according to civil status.
7. Descriptives
N Mean Std. Deviation Std. Error
95% Confidence Interval for Mean
Minimum Maximum
Lower Bound Upper Bound
monthly salary administrator 14 23430.0000 4010.14483 1071.75629 21114.6113 25745.3887 19900.00 32000.00
faculty 20 17598.5000 1326.31772 296.57366 16977.7642 18219.2358 15550.00 20000.00
staff 26 13238.8462 1599.04553 313.59863 12592.9777 13884.7146 11100.00 16700.00
maintenance 10 10818.0000 1188.60142 375.86877 9967.7258 11668.2742 9000.00 13450.00
Total 70 16176.8571 4826.94116 576.92982 15025.9136 17327.8006 9000.00 32000.00
cholesterol level after administrator 14 220.2143 14.27304 3.81463 211.9733 228.4553 200.00 237.00
faculty 20 189.2000 17.51270 3.91596 181.0038 197.3962 165.00 228.00
staff 26 194.6923 16.08420 3.15437 188.1958 201.1889 166.00 240.00
maintenance 10 190.0000 22.38055 7.07735 173.9899 206.0101 170.00 232.00
Total 70 197.5571 20.43699 2.44269 192.6841 202.4302 165.00 240.00
ANOVA
Sum of Squares df Mean Square F Sig.
monthly salary Between Groups 1.289E9 3 4.295E8 88.832 .000
Within Groups 3.191E8 66 4835125.460
Total 1.608E9 69
cholesterol level after Between Groups 9368.176 3 3122.725 10.596 .000
Within Groups 19451.096 66 294.714
Total 28819.271 69
6. Is there a significant difference on the monthly salary and cholesterol level after taking the mineral supplement when grouped according to civil status, and position ?
There is a significant difference on the monthly salary, f(3,66) = 88.832, pv = 0.000 and cholesterol level after taking the mineral supplement f(3,66) = 10.596, pv = 0.000 when grouped
according to position.
8. Crosstabs
cholesterol level * adult age group Crosstabulation
Count
adult age group
Total
young adult middle adult
cholesterol level desirable 17 17 34
borderline 0 36 36
Total 17 53 70
Chi-Square Tests
Value df
Asymp. Sig. (2-
sided)
Exact Sig. (2-
sided)
Exact Sig. (1-
sided)
Pearson Chi-Square 23.774a
1 .000
Continuity Correctionb
21.132 1 .000
Likelihood Ratio 30.475 1 .000
Fisher's Exact Test .000 .000
Linear-by-Linear Association 23.434 1 .000
N of Valid Cases 70
a. 0 cells (.0%) have expected count less than 5. The minimum expected count is 8.26.
b. Computed only for a 2x2 table
7. Is there a significant relationship between the respondents' cholesterol level and respondents' age group ?
There a significant relationship between the respondents' cholesterol level and respondents' age group, x2
(1) = 23.774, pv = 0.000. This implies that respondents’ age is a contributory factor
on their cholesterol level or cholesterol level is dependent on the respondents’ age group.
9. Correlations
age monthly salary
cholesterol level
after
age Pearson Correlation 1 .566**
.819**
Sig. (2-tailed) .000 .000
N 70 70 70
monthly salary Pearson Correlation .566**
1 .487**
Sig. (2-tailed) .000 .000
N 70 70 70
cholesterol level after Pearson Correlation .819**
.487**
1
Sig. (2-tailed) .000 .000
N 70 70 70
**. Correlation is significant at the 0.01 level (2-tailed).
8. Is there a significant correlation between respondents' age and respondents’ monthly salary, and cholesterol level after taking the mineral supplement?
There is a significant correlation between respondents' age and respondents’ monthly salary, r = .566, pv = 0.000 , and cholesterol level after taking the mineral
supplement r = .819, pv = 0.000.