Hot Call Girl In Ludhiana 👅🥵 9053'900678 Call Girls Service In Ludhiana
SKRIPSI ISPA
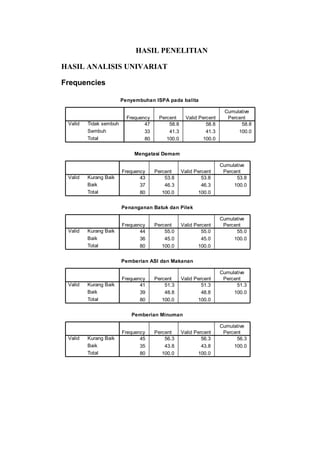
1. HASIL PENELITIAN
HASIL ANALISIS UNIVARIAT
Frequencies
Penyembuhan ISPA pada balita
47 58.8 58.8 58.8
33 41.3 41.3 100.0
80 100.0 100.0
Tidak sembuh
Sembuh
Total
Valid
Frequency Percent Valid Percent
Cumulative
Percent
Mengatasi Demam
43 53.8 53.8 53.8
37 46.3 46.3 100.0
80 100.0 100.0
Kurang Baik
Baik
Total
Valid
Frequency Percent Valid Percent
Cumulative
Percent
Penanganan Batuk dan Pilek
44 55.0 55.0 55.0
36 45.0 45.0 100.0
80 100.0 100.0
Kurang Baik
Baik
Total
Valid
Frequency Percent Valid Percent
Cumulative
Percent
Pemberian ASI dan Makanan
41 51.3 51.3 51.3
39 48.8 48.8 100.0
80 100.0 100.0
Kurang Baik
Baik
Total
Valid
Frequency Percent Valid Percent
Cumulative
Percent
Pemberian Minuman
45 56.3 56.3 56.3
35 43.8 43.8 100.0
80 100.0 100.0
Kurang Baik
Baik
Total
Valid
Frequency Percent Valid Percent
Cumulative
Percent
2. Explore
Case Processing Summary
80 100.0% 0 .0% 80 100.0%Mengatasi Demam
N Percent N Percent N Percent
Valid Missing Total
Cases
Descriptives
4.31 .29
3.74
4.88
4.35
5.00
6.572
2.56
0
8
8
4.00
-.459 .269
-1.142 .532
Mean
Lower Bound
Upper Bound
95% Confidence
Interval for Mean
5% Trimmed Mean
Median
Variance
Std. Deviation
Minimum
Maximum
Range
Interquartile Range
Skewness
Kurtosis
Mengatasi Demam
Statistic Std. Error
Tests of Normality
.207 80 .000Mengatasi Demam
Statistic df Sig.
Kolmogorov-Smirnov
a
Lilliefors Significance Correctiona.
3. Explore
Case Processing Summary
80 100.0% 0 .0% 80 100.0%
Penanganan
Batuk dan Pilek
N Percent N Percent N Percent
Valid Missing Total
Cases
Descriptives
3.74 .276
3.19
4.29
3.67
3.00
6.095
2.469
0
8
8
4.00
.362 .269
-1.420 .532
Mean
Lower Bound
Upper Bound
95% Confidence
Interval for Mean
5% Trimmed Mean
Median
Variance
Std. Deviation
Minimum
Maximum
Range
Interquartile Range
Skewness
Kurtosis
Penanganan
Batuk dan Pilek
Statistic Std. Error
Tests of Normality
.234 80 .000 .870 80 .000
Penanganan
Batuk dan Pilek
Statistic df Sig. Statistic df Sig.
Kolmogorov-Smirnov
a
Shapiro-Wilk
Lilliefors Significance Correctiona.
4. Explore
Case Processing Summary
80 100.0% 0 .0% 80 100.0%
Pemberian ASI
dan Makanan
N Percent N Percent N Percent
Valid Missing Total
Cases
Descriptives
5.74 .423
4.89
6.58
5.71
5.00
14.348
3.788
0
12
12
6.75
.120 .269
-1.298 .532
Mean
Lower Bound
Upper Bound
95% Confidence
Interval for Mean
5% Trimmed Mean
Median
Variance
Std. Deviation
Minimum
Maximum
Range
Interquartile Range
Skewness
Kurtosis
Pemberian ASI
dan Makanan
Statistic Std. Error
Tests of Normality
.164 80 .000 .928 80 .000
Pemberian ASI
dan Makanan
Statistic df Sig. Statistic df Sig.
Kolmogorov-Smirnov
a
Shapiro-Wilk
Lilliefors Significance Correctiona.
5. Explore
Case Processing Summary
80 100.0% 0 .0% 80 100.0%Pemberian Minuman
N Percent N Percent N Percent
Valid Missing Total
Cases
Descriptives
2.26 .145
1.97
2.55
2.29
2.00
1.690
1.300
0
4
4
1.00
-.399 .269
-.714 .532
Mean
Lower Bound
Upper Bound
95% Confidence
Interval for Mean
5% Trimmed Mean
Median
Variance
Std. Deviation
Minimum
Maximum
Range
Interquartile Range
Skewness
Kurtosis
Pemberian Minuman
Statistic Std. Error
Tests of Normality
.207 80 .000 .877 80 .000Pemberian Minuman
Statistic df Sig. Statistic df Sig.
Kolmogorov-Smirnov
a
Shapiro-Wilk
Lilliefors Significance Correctiona.
6. HASIL ANALISIS BIVARIAT
Crosstabs
Mengatasi Demam * Penyembuhan ISPA pada balita Crosstabulation
31 12 43
25.3 17.7 43.0
72.1% 27.9% 100.0%
16 21 37
21.7 15.3 37.0
43.2% 56.8% 100.0%
47 33 80
47.0 33.0 80.0
58.8% 41.3% 100.0%
Count
Expected Count
% within Mengatasi
Demam
Count
Expected Count
% within Mengatasi
Demam
Count
Expected Count
% within Mengatasi
Demam
Kurang Baik
Baik
Mengatasi
Demam
Total
Tidak
sembuh Sembuh
Penyembuhan ISPA
pada balita
Total
Chi-Square Tests
6.830b 1 .009
5.692 1 .017
6.908 1 .009
.012 .008
6.745 1 .009
80
Pearson Chi-Square
Continuity Correctiona
Likelihood Ratio
Fisher's Exact Test
Linear-by-Linear
Association
N of Valid Cases
Value df
Asymp. Sig.
(2-sided)
Exact Sig.
(2-sided)
Exact Sig.
(1-sided)
Computed only for a 2x2 tablea.
0 cells (.0%) have expected count less than 5. The minimum expected count is
15.26.
b.
Risk Estimate
3.391 1.336 8.604
1.667 1.103 2.520
.492 .282 .858
80
Odds Ratio for Mengatasi
Demam (Kurang Baik /
Baik)
For cohort Penyembuhan
ISPA pada balita = Tidak
sembuh
For cohort Penyembuhan
ISPA pada balita =
Sembuh
N of Valid Cases
Value Lower Upper
95% Confidence
Interval
7. Crosstabs
Penanganan Batuk dan Pilek * Penyembuhan ISPA pada balita Crosstabulation
32 12 44
25.9 18.2 44.0
72.7% 27.3% 100.0%
15 21 36
21.2 14.9 36.0
41.7% 58.3% 100.0%
47 33 80
47.0 33.0 80.0
58.8% 41.3% 100.0%
Count
Expected Count
% within Penanganan
Batuk dan Pilek
Count
Expected Count
% within Penanganan
Batuk dan Pilek
Count
Expected Count
% within Penanganan
Batuk dan Pilek
Kurang Baik
Baik
Penanganan Batuk
dan Pilek
Total
Tidak
sembuh Sembuh
Penyembuhan ISPA
pada balita
Total
Chi-Square Tests
7.882b 1 .005
6.653 1 .010
7.975 1 .005
.006 .005
7.784 1 .005
80
Pearson Chi-Square
Continuity Correctiona
Likelihood Ratio
Fisher's Exact Test
Linear-by-Linear
Association
N of Valid Cases
Value df
Asymp. Sig.
(2-sided)
Exact Sig.
(2-sided)
Exact Sig.
(1-sided)
Computed only for a 2x2 tablea.
0 cells (.0%) have expected count less than 5. The minimum expected count is
14.85.
b.
Risk Estimate
3.733 1.462 9.535
1.745 1.139 2.675
.468 .268 .815
80
Odds Ratio for
Penanganan Batuk dan
Pilek (Kurang Baik / Baik)
For cohort Penyembuhan
ISPA pada balita = Tidak
sembuh
For cohort Penyembuhan
ISPA pada balita =
Sembuh
N of Valid Cases
Value Lower Upper
95% Confidence
Interval
8. Crosstabs
Pemberian ASI dan Makanan * Penyembuhan ISPA pada balita Crosstabulation
30 11 41
24.1 16.9 41.0
73.2% 26.8% 100.0%
17 22 39
22.9 16.1 39.0
43.6% 56.4% 100.0%
47 33 80
47.0 33.0 80.0
58.8% 41.3% 100.0%
Count
Expected Count
% within Pemberian
ASI dan Makanan
Count
Expected Count
% within Pemberian
ASI dan Makanan
Count
Expected Count
% within Pemberian
ASI dan Makanan
Kurang Baik
Baik
Pemberian ASI
dan Makanan
Total
Tidak
sembuh Sembuh
Penyembuhan ISPA
pada balita
Total
Chi-Square Tests
7.217b 1 .007
6.048 1 .014
7.331 1 .007
.012 .007
7.127 1 .008
80
Pearson Chi-Square
Continuity Correctiona
Likelihood Ratio
Fisher's Exact Test
Linear-by-Linear
Association
N of Valid Cases
Value df
Asymp. Sig.
(2-sided)
Exact Sig.
(2-sided)
Exact Sig.
(1-sided)
Computed only for a 2x2 tablea.
0 cells (.0%) have expected count less than 5. The minimum expected count is
16.09.
b.
Risk Estimate
3.529 1.383 9.008
1.679 1.123 2.510
.476 .267 .846
80
Odds Ratio for Pemberian
ASI dan Makanan (Kurang
Baik / Baik)
For cohort Penyembuhan
ISPA pada balita = Tidak
sembuh
For cohort Penyembuhan
ISPA pada balita =
Sembuh
N of Valid Cases
Value Lower Upper
95% Confidence
Interval
9. Crosstabs
Pemberian Minuman * Penyembuhan ISPA pada balita Crosstabulation
32 13 45
26.4 18.6 45.0
71.1% 28.9% 100.0%
15 20 35
20.6 14.4 35.0
42.9% 57.1% 100.0%
47 33 80
47.0 33.0 80.0
58.8% 41.3% 100.0%
Count
Expected Count
% within Pemberian
Minuman
Count
Expected Count
% within Pemberian
Minuman
Count
Expected Count
% within Pemberian
Minuman
Kurang Baik
Baik
Pemberian
Minuman
Total
Tidak
sembuh Sembuh
Penyembuhan ISPA
pada balita
Total
Chi-Square Tests
6.485b 1 .011
5.372 1 .020
6.533 1 .011
.013 .010
6.404 1 .011
80
Pearson Chi-Square
Continuity Correctiona
Likelihood Ratio
Fisher's Exact Test
Linear-by-Linear
Association
N of Valid Cases
Value df
Asymp. Sig.
(2-sided)
Exact Sig.
(2-sided)
Exact Sig.
(1-sided)
Computed only for a 2x2 tablea.
0 cells (.0%) have expected count less than 5. The minimum expected count is
14.44.
b.
Risk Estimate
3.282 1.296 8.313
1.659 1.084 2.539
.506 .294 .868
80
Odds Ratio for Pemberian
Minuman (Kurang Baik /
Baik)
For cohort Penyembuhan
ISPA pada balita = Tidak
sembuh
For cohort Penyembuhan
ISPA pada balita =
Sembuh
N of Valid Cases
Value Lower Upper
95% Confidence
Interval
10. Crosstabs
Pemberian Minuman * Penyembuhan ISPA pada balita Crosstabulation
32 13 45
26.4 18.6 45.0
71.1% 28.9% 100.0%
15 20 35
20.6 14.4 35.0
42.9% 57.1% 100.0%
47 33 80
47.0 33.0 80.0
58.8% 41.3% 100.0%
Count
Expected Count
% within Pemberian
Minuman
Count
Expected Count
% within Pemberian
Minuman
Count
Expected Count
% within Pemberian
Minuman
Kurang Baik
Baik
Pemberian
Minuman
Total
Tidak
sembuh Sembuh
Penyembuhan ISPA
pada balita
Total
Chi-Square Tests
6.485b 1 .011
5.372 1 .020
6.533 1 .011
.013 .010
6.404 1 .011
80
Pearson Chi-Square
Continuity Correctiona
Likelihood Ratio
Fisher's Exact Test
Linear-by-Linear
Association
N of Valid Cases
Value df
Asymp. Sig.
(2-sided)
Exact Sig.
(2-sided)
Exact Sig.
(1-sided)
Computed only for a 2x2 tablea.
0 cells (.0%) have expected count less than 5. The minimum expected count is
14.44.
b.
Risk Estimate
3.282 1.296 8.313
1.659 1.084 2.539
.506 .294 .868
80
Odds Ratio for Pemberian
Minuman (Kurang Baik /
Baik)
For cohort Penyembuhan
ISPA pada balita = Tidak
sembuh
For cohort Penyembuhan
ISPA pada balita =
Sembuh
N of Valid Cases
Value Lower Upper
95% Confidence
Interval