1. Glaciers are retreating at unprecedented rates
worldwide. Past studies of the Juneau Icefield show that
50 glaciers have receded, two have remained stationary,
and one has advanced. The advancing glacier, the
Taku, is the primary glacier of this study. As part of the
Juneau Icefield Research Program, glacier surface
elevation and short-term velocity are measured annually
during the summer season along longitudinal and transv
ers profiles using a Trimble Global Positioning System
(GPS).
In order to better understand the data we are collecting
through our measurements, we have compared our
survey results from 2016 to those of recent decades to
determine long-term changes in surface elevation and
velocity over time. In addition, we have generated a
detailed surface model and measured the pattern of
local surface flow to constrain the location of the
Matthes-Llewellyn divide, to determine if it is migrating
through time. These results will help us understand the
evolving dynamics of the Taku Glacier and the rest of
the Juneau Icefield, while continuing to build a databaset
hat can be utilized in future research.
Introduction
Results
Temporal Changes of Surface Elevation and Velocity of the Juneau Icefield
Kate Bartell, Joel Gonzalez-Santiago, Alexandra Kessler, Mackenzie McAdams,
Brittany Ooman, Kristen Rees, Lara Hughes-Allen, Uwe Hoffman
The Juneau Icefield Research Program
Methodology
• 3,176 square
kilometers total area
• 53 outlet glaciers
• Taku, Llewellyn,
and Meade
comprise 51% of
the total area of the
Juneau Icefield
• Data was collected
for this study on
Lemon Creek, Taku,
Matthes, Demorest,
and Llewellyn
Glaciers.
• A grid was set up at
points estimated to
be the Matthes-
Llewellyn divide
,
The research area for this study was the Juneau Icefield
located in Southeast Alaska.
Research Area
Figure 1: A map of the longitundinal and
transverse profiles surveyed on the Juneau
Icefield.
Discussion
Data was taken by the use of a survey grade Trimble GPS with centimeter accuracy and real time
corrections. The survey style used was fixed static which was used to measure longitudinal profiles,
transverse profiles, and elevation. The longitudinal and initial transverse profile points were taken within
0.5 meters of the survey point, and transverse profile points were marked with a flag. The second
measurements of the transverse profiles were taken at the location of each flag, and the measurements
taken were calculated to solve for velocities of the profiles.
• As time progresses on the Juneau Icefield, surface
elevation on the glaciers are decreasing.
• Surface elevation decrease on the Taku glacier is
representative of the amount of ice mass lost in the
vertical direction.
• Graphs 1 and 2 show that based on two eight year
time periods, surface elevations along Longitudinal
A have significantly decreased in the most recent 8
year time period. Longitudinal A profile points run
along the center lines of the Taku connecting into
the Matthes-Llewellyn.
• Graph 3 shows that surface elevation increases at
the margins, supporting a hypothesis that the Taku
is gaining mass from the Matthes and other
branches of the Taku.
Surface Elevation
Velocity
• The velocities of the Taku glacier are larger in the
center of the glacier and slower along the margin.
• This is due to higher friction and less mass along
the margins as compared to the center line of ice
flow.
• Velocity measurements can be used in many
glaciological calculations including erosion rates, ice
thickness, and mass transport.
References
Conclusion
1. Peduzzi, P., C. Herald, and W. Silverio. "Assessing High Altitude Glacier Thickness, Volume and Area Changes Using Field, GIS and Remote Sensing Techniques: The Case of Nevado
Coropuna (Peru)." The Cryosphere 4 (2010): 313-23. Web.,
2. Whitehead, K., Moorman, B., and Wainstein, P. 2014, instruments and Methods: Measuring daily surface elevation and velocity variations across polythermal arctic glacier using ground based
photogrammetry, Journal of Glaciology, v.60, no. 224
The overall surface elevation of the Juneau Icefield
glaciers has been in a period of decline. These
changes are attributed to the warming climate that
leads to a later and shorter accumulation season and a
earlier and longer ablation season.
The velocities of the Taku glacier show that it has
currently slowed its advance to a stable position, and is
no longer advancing. This is a pivitol time to continue
research on the Taku Glacier to record it’s behavior in
the next decade. Understanding what happens to the
Taku in this period will help in future research towards
glacier dynamics around the world.
0.000
2.000
4.000
6.000
8.000
10.000
12.000
14.000
16.000
18.000
20.000
0.0 5.0 10.0 15.0 20.0 25.0 30.0 35.0 40.0 45.0 50.0
ChangeinElevation(m)
Distance along Longitudinal A (km)
Change in Elevation of Longitudinal A
Matthes Llewellyn
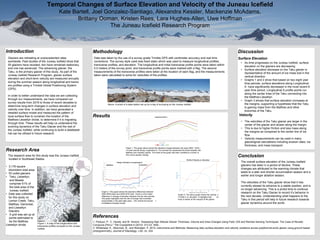
Above: A photo of a base station set up for a day of surveying on the Juneau Icefield.
Graph 2. This graph shows the elevation differences between
2000-2008 (blue) and 2008-2016 (red). There is a five meter
difference in change of elevation between the two time periods.
This graph highlights that the rate of change has increased
exponentially in the past eight years. The vertical line shows t
he Matthes-Llewellyn divide.
Graph 1. The graph above shows the elevation change between the years 2000 - 2016 i
n 8 year periods along Longitudinal A. The vertical line represents the divide between the
Matthes and Llewellyn glacier. The scale of this graph has been modified by a factor of
20 to show greater change.
Graph 3. The above graph shows the velocity o
f Profile 4 vs. elevation. It highlights that ve
locity is slower at the margins of the glacier.