
Recommended
More Related Content
What's hot
What's hot (19)
Similar to Lab 4 c
Similar to Lab 4 c (20)
Recently uploaded
Recently uploaded (20)
Lab 4 c
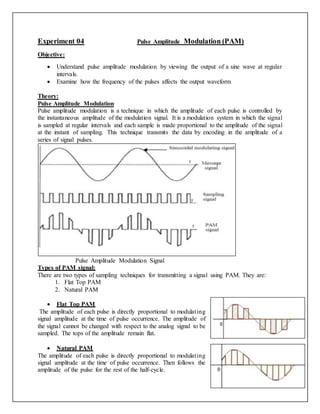
- 1. Experiment 04 Pulse Amplitude Modulation (PAM) Objective: Understand pulse amplitude modulation by viewing the output of a sine wave at regular intervals. Examine how the frequency of the pulses affects the output waveform Theory: Pulse Amplitude Modulation Pulse amplitude modulation is a technique in which the amplitude of each pulse is controlled by the instantaneous amplitude of the modulation signal. It is a modulation system in which the signal is sampled at regular intervals and each sample is made proportional to the amplitude of the signal at the instant of sampling. This technique transmits the data by encoding in the amplitude of a series of signal pulses. Pulse Amplitude Modulation Signal Types of PAM signal: There are two types of sampling techniques for transmitting a signal using PAM. They are: 1. Flat Top PAM 2. Natural PAM Flat Top PAM The amplitude of each pulse is directly proportional to modulating signal amplitude at the time of pulse occurrence. The amplitude of the signal cannot be changed with respect to the analog signal to be sampled. The tops of the amplitude remain flat. Natural PAM The amplitude of each pulse is directly proportional to modulating signal amplitude at the time of pulse occurrence. Then follows the amplitude of the pulse for the rest of the half-cycle.
- 2. Explaination: In Pulse modulation, the unmodulated carrier signal is a periodic train of signals. So the pulse train can be described like the following. Pulse Train Where ‘A’ is the unmodulated pulse amplitude ‘τ’ is pulse width The pulse trains periodic time can be denoted as ‘Ts’ In PAM, the signal amplitudes can be changed based on the modulating signal. Here, the modulating signal like m(t), PAM can be achieved through multiplying the carrier signal with the modulating signal. The o/p is a set of pulses, where the amplitudes of signals can be changed on the modulating signal. The specific type of PAM can be referred to as normal PAM, as the pulses follow the outline of the modulating signal. The pulse train works like a periodic switching signal toward the modulator. Once it is switched ON, and then allows the samples of modulating signals to supply toward the output. The pulse train’s periodic time is called the sampling period. Fs = 1/Ts The natural pulse amplitude modulation equation can be described as the following. The modulated pulse train can be described like E(t) = m(t) +Up(t) = a0 m(t) + a1 m(t) cos2πnt/Ts + a2 m(t) cos4πnt/Ts+…. In the above equation, the modulated signal includes modulating signal that is multiplied through the dc term like ‘a0’a sequence of DSBSC based components which results from the harmonics within the pulse signal. To stop the low-edge of the DSBSC range from overlapping through the less frequency range, the division ∆ among these should not below zero. So W + ∆ = fs – W, with ∆ ≥ 0 fs ≥ 2W This statement is compulsory on the sampling frequency which states that the sampling frequency should be as a minimum double the maximum frequency within the modulating signal. If the sampling state is not met the spectra overlap parts, then such overlap is permitted to arise the spectra can no longer be divided through filtering. As the maximum frequency components within the DSBSC range come out within the less frequency fraction of the spectrum, so this effect is known as aliasing.
- 3. To evade aliasing, first, the modulation signal can be passed throughout an anti-aliasing filter to cut off the signal spectrum at W value. The ‘fs’ (sampling frequency) = 2W which is called the Nyquist Frequency due to its wideband nature, pulse amplitude modulation includes an extremely limited range of applications for direct signal transmission. It is used in instrumentation systems & in ADC for computer interfacing. Block diagram: How PAM Signal is generated? The basic type of pulse modulation is known as PAM or Pulse amplitude modulation, where the signal can be sampled at regular intervals & every sample can be made relative to the modulating signal’s amplitude on the sampling moment. The above block diagram of PAM shows the PAM signal generation from the sampler where the sampler includes two inputs namely sampling/carrier signal and modulating signal. Therefore the signal amplitude is relative to the modulating signal through where the data can be carried. So, this is the PAM signal. The spectrum of the PAM signal is shown in the above waveforms which include the message & the sampling signals where the carrier train of signals using the waveform plotted within the time field.Pulse Modulation is mainly used for transmitting analog data like data otherwise continuous speech signal. Circuit Design of Pulse Amplitude Modulation A PAM is generated from a pure sine wave modulating signal and a square wave generator which produces the carrier pulse and a PAM modulator circuit. A sine wave generator is used which is based on the Wien Bridge Oscillator circuit. This can produce distortion less sine wave at the output. The circuit is designed such that the amplitude and the frequency of the oscillator can be adjusted using a potentiometer. The frequency can be varied by varying the potentiometer R2 and the amplitude of the adjusted using the potentiometer R. The frequency of the sine wave generated is given by F = 1/(2π√R1R2C1C2)
- 4. The square wave is generated using op-amp based astable circuit. The op-amp is used to reduce the complexity of generating the square wave. The ON time and the OFF time of the pulse can be made identical and the frequency can be adjusted without changing them. Square Wave Generator The time period of the pulses generated depends on the value of the resistance R and the capacitance C. The period of the op-amp astable circuit is given by T = 2.2RC Demodulation of PAM For the demodulation of the PAM signal, the PAM signal is fed to the low pass filter. The low pass filter eliminates the high-frequency ripples and generates the demodulated signal. This signal is then applied to the inverting amplifier to amplify its signal level to have the demodulated output with almost equal amplitude with the modulating signal. Demodulation of PAM signal
- 5. Procedure: 1. Setup the apparatus as per requirement. 2. Insert one wire on frequency as an input. 3. Connect ground of MCM 25ev to the ground of board and +ve to +ve and-ve to -ve of board. 4. Now common the +ve nd -ve of oscilloscope and connect the other probe to different points on MCM trainor to see the different phases of amplitude modulation on oscilloscope one by one. 5. We will see different types of signals at different phases or points of PAM on oscilloscope. 6. Similarly, we do the demodulation process by attaching the transmitter trainor to reciever and we will observe the reverse in demodulation at different phases. Hardware Simulation: PAM Modulation: PAM De-Modultaion
- 7. MATLAB Simulation: clc; clear all; close all; fc=100; fm=fc/10; fs=100*fc; t=0:1/fs:4/fm; mt=cos(2*pi*fm*t); ct=0.5*square(2*pi*fc*t)+0.5; st=mt.*ct; tt=[ ]; %single sided PAM for i=1:length(st); if st(i)==0; tt=[tt,st(I)]; else tt=[tt,st(i)+2]; end end figure(1) subplot(4,1,1); plot(t,mt); title('message signal'); xlabel('timeperiod'); ylabel('amplitude'); subplot(4,1,2); plot(t,ct); title('carrier signal'); xlabel('timeperiod'); ylabel('amplitude'); subplot(4,1,3); plot(t,st); title('modulated signal of double side band'); xlabel('timeperiod'); ylabel('amplitude'); subplot(4,1,4); plot(t,tt); title('PAM of single side band'); xlabel('timeperiod'); ylabel('amplitude'); xlabel('timeperiod'); ylabel('amplitude'); plot(t,dt); title('demodulated signal);
- 9. Result & Conclusion: The study of pulse amplitude modulation using switching method and by sample and hold circuit has been successfully. Precautions: (a). All patch cords should be connected properly. (b). Reading should be taken carefully from CRO. Comments: _______________________________________________________________________________ _______________________________________________________________________________ _______________________________________________________________________________ Lab Instructor Signature: ______________________