Adult Stages: Older Adult (65 to 85 Years)
Aging in America
The first of the baby boomer generation born between 1946 and 1964 is reaching age 65 and many are facing economic uncertainty and spiraling health care costs. As the older population grows, their personal, social, and health care needs will be felt in all our lives. The young and middle-age adults that we discussed earlier in this chapter will comprise the older population of 2050 and beyond.
Following are some personal characteristics of the older population and their potential impact on health and nutrition services:
• Increase in life expectancy: Life expectancy is a general measure of the overall health of a population.40 Over the past century, life expectancy at birth rose significantly based on improved sanitation, the discovery of antibiotics, and higher standards of living (Figure 13-4). Better prevention and treatment of heart disease, cancer, and stroke, the most common causes of death in older adults, has contributed to longer life expectancies. Sixty-five-year-olds can expect to live another 19 years, and 85-year-olds another 6 to 7 years.40 Those 85 and older are the fastest growing age cohort in the United States and will double in number over the next 25 years.
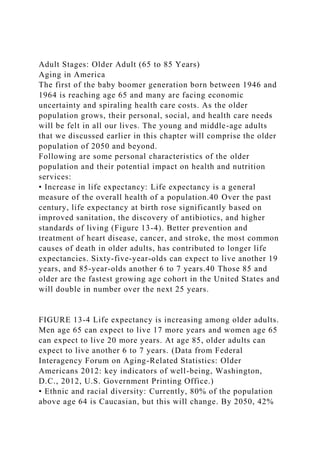
FIGURE 13-4 Life expectancy is increasing among older adults. Men age 65 can expect to live 17 more years and women age 65 can expect to live 20 more years. At age 85, older adults can expect to live another 6 to 7 years. (Data from Federal Interagency Forum on Aging-Related Statistics: Older Americans 2012: key indicators of well-being, Washington, D.C., 2012, U.S. Government Printing Office.)
• Ethnic and racial diversity: Currently, 80% of the population above age 64 is Caucasian, but this will change. By 2050, 42% of the older U.S. population will be Asian, Hispanic, or African American (Figure 13-5).40 Nutrition education programs and meal services will need to adjust to different customs, food patterns, and family roles. Growing diversity is also promoting greater interest in complementary and alternative medicine (CAM). (See the Focus on Culture box, “Cultural and Ethnic Differences in Health Practices” for related discussion.)
FIGURE 13-5 Percent of persons ages 65 and older according to race and ethnic group. The older population will continue to become more diverse in the coming years. (Data from Federal Interagency Forum on Aging-Related Statistics: Older Americans 2012: key indicators of well-being, Washington, D.C., 2012, U.S. Government Printing Office.)
.
Adult Stages Older Adult (65 to 85 Years)Aging in AmericaThe .docx
1. Adult Stages: Older Adult (65 to 85 Years)
Aging in America
The first of the baby boomer generation born between 1946 and
1964 is reaching age 65 and many are facing economic
uncertainty and spiraling health care costs. As the older
population grows, their personal, social, and health care needs
will be felt in all our lives. The young and middle-age adults
that we discussed earlier in this chapter will comprise the older
population of 2050 and beyond.
Following are some personal characteristics of the older
population and their potential impact on health and nutrition
services:
• Increase in life expectancy: Life expectancy is a general
measure of the overall health of a population.40 Over the past
century, life expectancy at birth rose significantly based on
improved sanitation, the discovery of antibiotics, and higher
standards of living (Figure 13-4). Better prevention and
treatment of heart disease, cancer, and stroke, the most common
causes of death in older adults, has contributed to longer life
expectancies. Sixty-five-year-olds can expect to live another 19
years, and 85-year-olds another 6 to 7 years.40 Those 85 and
older are the fastest growing age cohort in the United States and
will double in number over the next 25 years.
FIGURE 13-4 Life expectancy is increasing among older adults.
Men age 65 can expect to live 17 more years and women age 65
can expect to live 20 more years. At age 85, older adults can
expect to live another 6 to 7 years. (Data from Federal
Interagency Forum on Aging-Related Statistics: Older
Americans 2012: key indicators of well-being, Washington,
D.C., 2012, U.S. Government Printing Office.)
• Ethnic and racial diversity: Currently, 80% of the population
above age 64 is Caucasian, but this will change. By 2050, 42%
2. of the older U.S. population will be Asian, Hispanic, or African
American (Figure 13-5).40 Nutrition education programs and
meal services will need to adjust to different customs, food
patterns, and family roles. Growing diversity is also promoting
greater interest in complementary and alternative medicine
(CAM). (See the Focus on Culture box, “Cultural and Ethnic
Differences in Health Practices” for related discussion.)
FIGURE 13-5 Percent of persons ages 65 and older according to
race and ethnic group. The older population will continue to
become more diverse in the coming years. (Data from Federal
Interagency Forum on Aging-Related Statistics: Older
Americans 2012: key indicators of well-being, Washington,
D.C., 2012, U.S. Government Printing Office.)