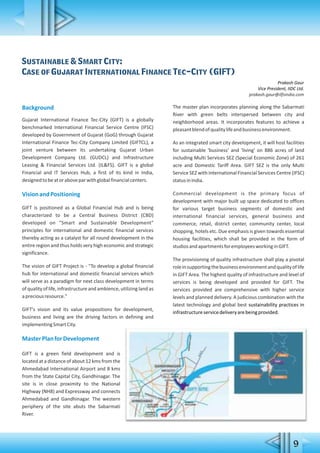
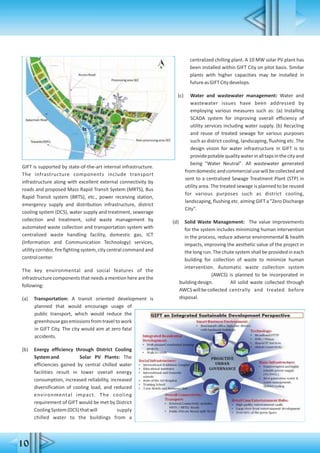
The document discusses the ongoing initiative by the Bombay Chamber of Commerce and the Environmental Management Centre to promote sustainability in business through their quarterly newsletter, 'Raising the Sustainability Quotient' (SQ), first published in 2011. It highlights various sustainability themes and challenges faced by businesses, emphasizing the urgency of sustainable development, particularly in the context of India's rapid urbanization and the need for smart cities. The publication includes updated articles selected by a jury of experts, covering crucial topics such as sustainable infrastructure, environmental governance, and the economic implications of biodiversity.

![36
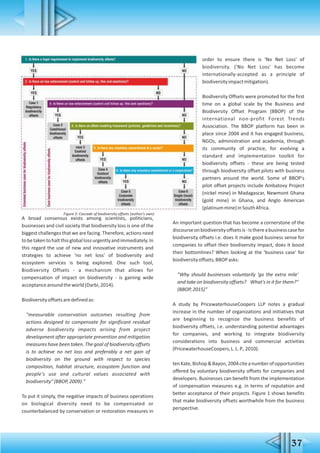
A broad consensus exists among scientists, politicians,
businesses and civil society that biodiversity loss is one of the
biggest challenges that we are facing. Therefore, actions need
tobetakentohaltthisgloballossurgentlyandimmediately.In
this regard the use of new and innovative instruments and
strategies to achieve 'no net loss' of biodiversity and
ecosystem services is being explored. One such tool,
Biodiversity Offsets - a mechanism that allows for
compensation of impact on biodiversity - is gaining wide
acceptancearoundtheworld(Darbi,2014).
Biodiversityoffsetsaredefinedas:
"measurable conservation outcomes resulting from
actions designed to compensate for significant residual
adverse biodiversity impacts arising from project
development after appropriate prevention and mitigation
measures have been taken. The goal of biodiversity offsets
is to achieve no net loss and preferably a net gain of
biodiversity on the ground with respect to species
composition, habitat structure, ecosystem function and
people's use and cultural values associated with
biodiversity"(BBOP,2009)."
To put it simply, the negative impacts of business operations
on biological diversity need to be compensated or
counterbalanced by conservation or restoration measures in
order to ensure there is 'No Net Loss' of biodiversity. ('No Net
Loss' has become internationally-accepted as a principle of
biodiversityimpactmitigation).
Biodiversity Offsets were promoted for the first time on a
global scale by the Business and Biodiversity Offset Program
(BBOP) of the international non-profit Forest Trends
Association. The BBOP platform has been in place since 2004
and it has engaged business, NGOs, administration and
academia, through its community of practice, for evolving a
standard and implementation toolkit for biodiversity offsets -
these are being tested through biodiversity offset pilots with
business partners around the world. Some of BBOP's pilot
offset projects include Ambatovy Project (nickel mine) in
Madagascar, Newmont Ghana (gold mine) in Ghana, and
AngloAmerican(platinummine)inSouthAfrica.
An important question that has become a cornerstone of the
discourse on biodiversity offsets is - Is there a business case
for biodiversity offsets i.e. does it make good business sense
for companies to offset their biodiversity impact, does it
boost their bottomlines? When looking at the 'business case'
forbiodiversityoffsets,BBOPasks:
"Why should businesses voluntarily 'go the extra mile'
and take on biodiversity offsets? What's in it for them?"
(BBOP,2015)"
A study by PricewaterhouseCoopers LLP notes a gradual
increase in the number of organizations and initiatives that
are beginning to recognize the business benefits of
biodiversity offsets, i.e. understanding potential advantages
for companies, and working to integrate biodiversity
considerations into business and commercial activities
(PricewaterhouseCoopers,L.L.P.,2010).
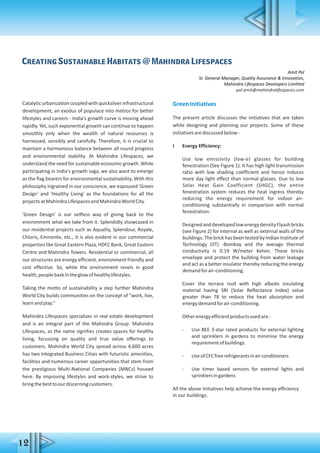
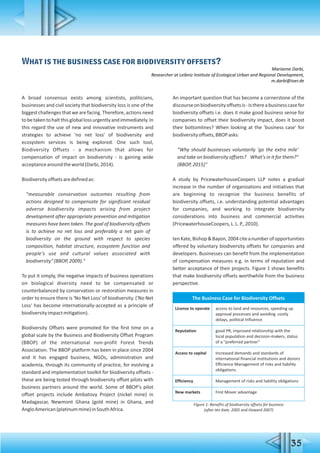
ten Kate, Bishop & Bayon, 2004 cite a number of
opportunities offered by voluntary biodiversity offsets for
companies and developers. Businesses can benefit from the
implementation of compensation measures e.g. in terms of
reputation and better acceptance of their projects. Figure 1
shows benefits that make biodiversity offsets worthwhile
fromthebusinessperspective.
In general terms, there are two types of motivations for
business to adopt biodiversity offsets, which align with the
valuesassignedtobiodiversitybyhumans:
1. Ethical value: altruistic motivation for the
implementationofbiodiversityoffsets.
2. Value of benefit: improvement in business and
enhancementofprofit
The most obvious case for such benefit is when biodiversity is
theprerequisiteforthebusinessactivities(e.g.tourism).
"The business case for biodiversity conservation is most
easily made when the business in question depends
directlyonbiodiversitytooperateandsurvive[…]Formany
other businesses the case for investing in biodiversity
conservationislessclear.Understandingwhatbiodiversity
means and how it affects business value is not always
straightforward."(Bishop,2006)
In the public, however, a rather negative view of biodiversity
offsets (and in particular of related business activities
initiatives)dominates,withbusinessesbeingaccusedof](https://image.slidesharecdn.com/sustainabilityquotient-180418074038/85/Sustainability-quotient-38-320.jpg)