This document recommends buying stock in Restaurant Brands International (QSR), owner of Burger King and Tim Hortons fast food chains. Key points include:
- QSR is undervalued and has potential for growth through global expansion of Tim Hortons and Burger King brands under successful owners like Jorge Lemann.
- Lemann and 3G Capital have a track record of acquiring and growing food brands like Anheuser-Busch InBev. There is potential for them to acquire more brands.
- QSR has advantages like lower taxes from being based in Canada, experience with franchising models, and diversification across brands and markets.
P13-3AWHITLOCK COMPANY Income Statement For the Year Ended N.docx
Restaurant Brands International Buy Recommendation
1. Student Research
This report is published for educationalpurposes
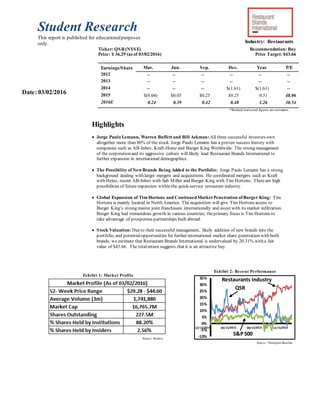
only. Industry: Restaurants
Exhibit 2: Recent Performance
Ticker: QSR(NYSE) Recommendation: Buy
Price: $ 36.29 (as of 03/02/2016) Price Target: $43.66
Earnings/Share Mar. Jun. Sep. Dec. Year P/E
Ratio2012 -- -- -- -- -- --
2013 -- -- -- -- -- --
2014 -- -- -- $(1.61) $(1.61) --
2015 $(0.04) $0.05 $0.25 $0.25 0.51 48.06
2016E 0.24 0.39 0.42 0.48 1.26 30.54
*Bolded/italicized figures are estimates
Highlights
Jorge Paulo Lemann, Warren Buffett and Bill Ackman: All three successful investors own
altogether more than 80% of the stock. Jorge Paulo Lemann has a proven success history with
companies such as AB-Inbev, Kraft-Heinz and Burger King Worldwide. The strong management
of the corporation and its aggressive culture will likely lead Restaurant Brands International to
further expansion in international demographics.
The Possibility of NewBrands Being Added to the Portfolio: Jorge Paulo Lemann has a strong
background dealing with larger mergers and acquisitions. He coordinated mergers such as Kraft
with Heinz, recent AB-Inbev with Sab Miller and Burger King with Tim Hortons. Thereare high
possibilities of future expansion within the quick-service restaurant industry.
Global Expansion of Tim Hortons and ContinuedMarket Penetration of Burger King: Tim
Hortons is mainly located in North America. The acquisition will give Tim Hortons access to
Burger King’s strong master joint franchisees internationally and assist with its market infiltration.
Burger King had tremendous growth in various countries; theprimary focus is Tim Hortons to
take advantage of prosperous partnerships built abroad.
Stock Valuation: Dueto their successful management, likely addition of new brands into the
portfolio, and potentialopportunities for further international market share penetration with both
brands, we estimate that Restaurant Brands International is undervalued by 20.31% with a fair
value of $43.66. The totalreturn suggests that it is an attractive buy.
Source: Thompson Baseline
Date: 03/02/2016
Source: Reuters
Exhibit 1: Market Profile
S&P500
-10%
-5%
0%
5%
10%
15%
20%
25%
30%
35% Restaurants Industry
QSR
S&P500
2. 03/02/2016Stetson University Student Research
2
Business Description
Company: Restaurant Brands International Inc (NYSE: QSR), is the third largest fast food chain in the
world. After the IPO in December 2014, in addition to Burger King Worldwide, Restaurant Brands now
also owns fast food donut coffee chain Tim Hortons, which has been operating mainly in North America
with 4,590 system-widerestaurants. The IPO was created to repeat Jorge Paulo Lemann success story on
Burger King to Tim Hortons towards global expansion.
Products: Through its franchises and stores, thecompany offers the following products (% of all revenue):
Tim Hortons (72.90%): Retail sales at Company owned restaurants with premium coffee, fruit
smoothies, donuts, grilled Panini and classic sandwiches, wraps and soups, distribution sales
exclusive to Tim Hortons franchisees, warehouse sales (69.1%), royalties based on a percentage of
sales reported by franchise restaurants and franchise fees paid by franchisees along with property
revenues from properties leased or subleased to franchisees (30.9%).
Burger King (27.01%): Retail sales at Company owned restaurants with burgers, chicken, salads,
veggies, breakfast, sides and sweets (7.95%) and royalties based on a percentage of sales reported
by franchise restaurants and franchise fees paid by franchisees along with property revenues from
properties leased or subleased to franchisees (92.05%).
Investment Rationale
Restaurant Brands International is being recommended a Buy for the following reasons.
Buy 3G Capital Management Success:JorgePaulo Lemann and 3G Capital had tremendous
success with previous purchases of AB Inbev, Heinz, and Burger King. Mr. Warren Buffett’s
conglomerate, Berkshire Hathaway, is helped finance Burger King Worldwide’s $11.4 billion
takeover of the Canadian restaurant chain Tim Hortons by buying $3 billion of preferred shares in
the new company. Mr. Buffett described 3G as “marvelous partners”and said, “They’revery
smart, they’revery focused. They’revery determined. They’renever satisfied.” 3G Capital took
Burger King private in 2010, buying the then slow-growing fast food chain for $3.3 billion and
two years later under Lemann's control, it returned to the public markets, at a valuation of around
$5 billion.
Highly Likely Acquisitions of NewBrands into Portfolio: Technically, a burger chain and
coffee shop satisfy theuse of theword "brands," but the name seems to call out for more. 3G,
Restaurant Brands' controlling shareholder, has a history of building conglomerates such as
Anheuser-Busch InBev, and it could be about to do so again. In December 2014, during a
Bloomberg interview, when hedge fund manager Bill Ackman who is also a top Restaurant
Brands shareholder, was asked by a reporter, “Is Restaurant Brands International looking to
expand further its portfolio in the food industry?”Ackman replied, “Restaurant Brands
International, the name itself suggests growth” noting that Restaurant Brands may be on the hunt
for additional takeover targets.
Growth Strategies: Restaurant Brands Internationalhas two main growth drivers.
Master Franchise Joint Venture Strategy (MFJV) will accelerate Tim Hortons
International Growth: The strategy involved sharing the rights to create Burger Kings
with partners in different parts of the world. The master joint venture partners control the
supply chain, procurement and marketing for franchisees in their regions. Restaurant Brands
International receives a meaningful minority stake in each joint venture. Such deals have
allowed Restaurant Brands to franchisee an additional 1,891 restaurants internationally in
just 2 years, representing a 15.76% growth. The North American Quick Service Industry is
highly competitiveso expanding market capitalization in different parts of the World allows
for greater sales and faster growth therefore minimizing risks by being less depend in the
North American market. Thesolid partnerships being built abroad are crucial in order to
expedite growth and increase both of thebrands value and recognition.
Exhibit 3: Company Overview
Source: Company 10-K
Source: Bloomberg
Exhibit 6: EBITDA Margin
0%
20%
40%
60%
80%
100%
Q12011 Q22012 Q32013 Q42014
0%
20%
40%
60%
80%
100%
Q12011 Q22012 Q32013 Q42014
Company Sales
Franchise & Property
Company Sales
Franchise & Property
0%
20%
40%
60%
80%
Q4
2012
Q1
2013
Q2
2013
Q3
2013
Q4
2013
Q1
2014
Q2
2014
TH
BKW
0
50
100
150
200
250
300
6/20/2012 6/20/2013 6/20/2014
MCD
BKW IPO BKW
Exhibit 7: BKW Return against
McDonald’s (after 3G Capital went
public)
Exhibit 5:Burger King(BK) Revenue
Breakdown
Source: Bloomberg
Source: Bloomberg
Source: Bloomberg
Exhibit 4:Tim Hortons (TH) Revenue
Breakdown
3. 03/02/2016Stetson University Student Research
3
Exhibit 9: QSR Sector Consumer
Spending (in billions)
Source: US Gov
Exhibit 8: Jorge Paulo Lemann
Building Conglomerates
Source: 3G Capital
Jorge Paul Lemann Building Conglomerates: JorgePaulo Lemann founded Banco Garantia in
1971, throughout its duration of almost three decades; Garantia became one of thelargest
investment firms in Brazil and gained a legendary reputation. Lemann and his two partners, Telles
and Sicupira, completely transformed thebusiness and banking world in Brazil. Lemann had
pioneered a new culture based on meritocracy that was revolutionary in Brazil at the time. Jorge
Paul Lemann implemented its culture built at theinvestment bank in a Brazilian brewery called
Brahma. After its successful management and rapid explosion, it acquired another Brazilian
brewery Antarctica changing its names to Ambev. In 2004, AmBev incorporated with Belgian
counterpart, InterBrew, for $11billion to become Ambev IB. And later it integrated with
Anheuser-Busch, turning thefirm into Anheuser-Busch InBev, therefore, making it the largest
brewery company in theworld. With a quarter of theworld’s market share, thecompany owns
global brands such as Budweiser, Corona, Stella Artois, Beck’s, as well as a series of leading local
brands. In Q4 2015, AB InBev announced theacquisition of SAB Miller for $106billion. Now one
out of three beers being purchased are from AB Inbev. Jorge Paulo Lemann orchestrated this
brewery conglomerate and his partnership with Warren Buffett and Bill Ackman won’t stop with
two fast food chains. They will take the same approach within the fast food industry.
Competitors: Restaurant Brands International main competitors are McDonald’s (NYSE: MCD) and
Dunkin Brands Group (NASDAQ:DNKN). Despitethequick service segment being highly competitive
industry, it is still a massive industry that increases revenue year after year. Restaurant Brands is part of the
Quick Service Restaurant sector (QSR).
Industry and PeerGroup Overview
Globally, fast food generates revenue of over $570 billion, which is bigger than the gross domestic
product of many countries. In the United States revenue was a $200 billion in 2015 which demonstrate a
lot of growth since the 1970 revenue of $6 billion. The industry is expected to have an annual growth of
2.5% for the next several years. The annual growth is below the long-term average, but it is displaying a
comeback from the downturn of the previous years.
There are over 200,000 fast food restaurants in the United States, and it is research shows that 50
million Americans eat at one of them every single day. The industry employs over 4 million people and
counting - restaurant franchises added over 200,000 jobs in 2015.
Consumers of fast food focus on taste, price and quality - in that order. While the food is often highly
processed and prepared in an assembly line, these restaurants focus on consistency of experience,
affordability, and speed. Exhibit 11 displays how the limited service industry takes less impact than
other types of services in the restaurants industry during the recession that took place in 2008.
Industry Benefits
The Quick Service Restaurant industry is a growing sector of thefood industry in International Markets.
The quick service segment has something that no other industry segment has, and that is a hedged risk to the
economic cycle. QSR’s are partly defensive. In lean times, fine dining and full service restaurants take the
biggest hit, while QSR’s is the in between and doesn’t see as much of an effect. Also, depending on the
economic conditions, quick service restaurants can adapt their business model due to their low operating
costs. Tough economic times cause consumers to adjust their spending on discretionary items, including
their eating-out habits. The US Government analysis showed that visits to sit-down restaurants declined
during and after the 2008-09 recession, while fast food visits were little changed. Exhibit 11 displays how
the limited-service industry takes less impact than other types of services in the restaurants industry during
the recession.
The share of the adult population purchasing fast food at a quick service restaurant on a given day stayed
fairly constant over 2008-09 at around 14.5%. In contrast, the share of adults visiting a sit-down restaurant
once or more on an average day showed a clear decline beginning in early 2008, thebeginning of the
financial crisis resulting in consumer uncertainty. In 2008, more than 20% of adults frequented a sit-down
restaurant on an average day; in late 2009, just 17.5% did. The sit-down restaurant suffered major losses
.because of their difficulty in adjusting operating costs due to it being of a more complex nature.
A
m
Be
v
2010 2011 2012 2013 2014
Consumer Spending Growth %
0%
10%
20%
30%
40%
50%
60%
70%
80%
90%
100%
2011 2012 2013 2014
-10%
-5%
0%
5%
10%
15%
20%
25%
2005 2008 2011
Exhibit 10: Market Share between
Key Players
Source: Bloomberg
Source: Bloomberg
Exhibit 11: Restaurant Industry
Growth
Dunkin’ Brands
Wendy’s
Co
Yum! Brands
Subway
Restaurant BrandsInternational
McDonald’s
Corp
Cafes/Bar
s
Pizza Full Service
Limited Service
4. 03/02/2016Stetson University Student Research
4
Exhibit 16: BK Franchisee
Requirements
Source: Tim Hortons Website
Exhibit 15: TH Franchisee
Requirements
Competitive Positioning
Most Efficient and Explosive Fast Food Operator in the World
Restaurant Brands International focus on providing efficiencies for both companies by improving operations
and increasing margins at every restaurant. The company is devoted to simplifying their operations by
adding more effective products to their menu instead of a vast quantity. Thecompany is dedicated to
modernizing therestaurant image and increase thecustomer satisfaction at both segments. Theincrease in
efficiencies will make Tim Hortons international growth process move at a faster pace.
Amongst the highest operating margins in theFast-Food Restaurant Sector: In 3G Capital’s culture, the
secret sauce is zero-based budgeting. Theprocess involves forcing managers every year to start at zero and
explain each and every cost they need, as opposed to merely adding to theprior year’s budget. It forces
operations to be lean, ultimately boosting thebottomline. Jorge Paulo Lemann and 3G Capital had
tremendous success with previous purchases of AB Inbev, Heinz and Burger King. The profit margin
(Exhibit 13) remains below key players in the industry dueto therepayment of the debt incurred by the
acquisition of Tim Hortons. Thehighest operating margin is from QSR (Exhibit 12) and it allows for a
faster repayment of debt therefore increasing theprofit margin and raising shareholder value.
Lower Taxes by Moving Headquarters to Canada: Even though upper management denied that tax rates
were not themain driver of the acquisition, it still displays an intelligent and aggressive approach in cutting
costs in order to accelerate growth. According to Bloomberg, Restaurant Brands International has thelowest
effective tax rate amongst the North American Restaurants Valuation Peer Index (Exhibit 14). While major
competitors such as McDonald’s, Yum! Brands and Wendy’s has an effective tax rate of 29.49%, 32.37%
and 36.85%, respectively; Restaurant Brands has only 10.44%. The taxation dollars not spent by payingthe
government will expedite theamount of debt incurred during the acquisition of Tim Horton’s and the
growth rate of both brands. Taxes for U.S. companies can go as high as 40%, which includes federal taxes
of 35% along with stateand local taxes, according to International Tax Review. Corporatefederal taxes in
Canada can range from 11% to 15%, and provincial taxes can range from 0% to 16%, according to Deloitte.
This gives a range of 11% to 31% for corporatetaxes, which is still lower than what a corporate
establishment may end up paying in the U.S.
SharedCosts to Boost Profitability: Having an already established relationship with various vendors
proves to help out the new franchisors significantly. In addition, Restaurant Brands International provides
training and guidance to their franchisees when they get into a tough position. This method has helped
Restaurant Brands International, and other companies that use the same model, to increase their revenue by
establishing franchises with high success rates and decreasing their risk from various market factors.
DiversifiedDemographics andNet Refranchising: Restaurant Brands International brings a big part of
their revenue from franchises in many different countries. This reduces the risk of being too dependent on
one market for its sales and moreover lessens economic threats of a single economy. Since the majority of
the revenue comes from franchises, they are able to use the franchisees as a shield from macroeconomic
factors. Thecompany has sold nearly all of the company owned stores and the only ones they kept are
surrounding the area of their headquarters, they were kept to use as a pilot being sources of testing for
products and operating developments. Thecompany states they do not want to increase the portfolio of
company operated stores; they are only focused on increasing the number of successful joint ventures in
strategic areas. Owning restaurants increases risks and includes many obstacles due to the economic cycles.
Successful Partnerships: Theleading advantage of using the franchise business model is that they partner
with wealthy private equities or individuals and use their capital and time to expand their brand at a faster
pace than they could on their own. Theprofits made from the franchise model helps to perpetuatetheir
model by devoting the profits fromthe franchises to training more franchisees, marketing, and advertising
the company’s brand.
Exhibit 14: Effective Tax Rates
Source: Bloomberg
Exhibit 12: OperatingMargin Growth
Source: Burger King Website
Source: Bloomberg
Source: Bloomberg
Exhibit 13: Profit Margin Growth
0%
10%
20%
30%
40%
50%
2015 Q1 2015 Q2 2015 Q3 2015 Q4
DNKN
QSR
MCD
WEN
Industry
-10%
-5%
0%
5%
10%
15%
20%
25%
2015 Q1 2015 Q2 2015 Q3 2015 Q4
WEN
QSR
DNKN
MCD
Industry
5. 03/02/2016Stetson University Student Research
5
Exhibit 21: BK US & Canada SSS
NRG
Exhibit 19: BK MCD NRG
Comparison
Exhibit 17: BKMCD SSS Comparison
Exhibit 18: TH DNKN SSS
Comparison
Exhibit 20: TH DNKN NRG
Comparison
Same Store Sales
OrganicGrowth: Same-store sales measure the percentage change in revenues generated by existing
restaurant locations over the same period last year. Same-store sales are in turn driven by thenumber of
customers visiting therestaurant (traffic), and the average amount spent per customer per visit (average
check). Traffic and average check are compelled by various factors, like product mix, price points, and
advertising and promotion. Tim Hortons and Burger King impresses when it comes to consistent growth.
Tim Hortons posted positivesame-storesales growth in Canada for over two decades, which is especially
difficult considering that there’s always at least one Tim Hortons within sight.
From Q4 2013, to Q4 2015, Burger King has on average better same store sales than its main competitor
McDonald’s;with 3.49% while McDonald’s only has 0.23%. Thedifference shows that Burger King is not
only growing in sizebut also in preference by the public. Tim Horton shows vast superiority over its main
competition Dunkin Donuts with average same store sales growth of 4.06% while Dunkin’ grew an average
of 1.76%.
Outlook: Theindustry same storesales are positively affected by GDP growth, consumer sentiment growth,
gas price growth, pent up demand, and negatively by interest rates. We are generally positive about the
overall outlook of the industry for the next few years due to healthier economic forecasts, which outweigh
the rising gas prices and interest rates. Based on predictions theindustry is expected to grow at around 12%
per year. The decline in thegasoline price is expected to positively benefit lower income consumers the
most. Customers of QSRs in the U.S. tend to skew toward lower income; therefore, we expect Burger King
to gain its fair share from such a tailwind.
Net Restaurant Growth: This approach measures how many restaurant openings subtracted by theclosing
to arrive at the growth. It allows investors to see how aggressive a brand is expanding in terms of building
new company operated restaurants or introducing new franchisee partnerships. FromQ4 2013 to Q4 2015,
Burger King had an average net restaurant growth of 1.39% while McDonald’s trailed behind with 0.50%.
Tim Hortons has also been successful in introducing partnerships and solidifying its growth. It grew an
average of 1.30% over thelast two years while Dunkin Donuts grew an average of 0.84%.
Geographic Penetration: The BK business is managed in four distinct geographic segments: (1)
United States and Canada (“BK – U.S. and Canada”); (2) Europe, the Middle East and Africa (“BK –
EMEA”); (3) Latin America and the Caribbean (“BK – LAC”); and (4) Asia Pacific (“BK – APAC”). In
each of these regions, Burger King has established several subsidiaries to develop strategic partnerships
and alliances to expand into new territories. The alliances will support Tim Hortons and make its
international transition faster and smoother. While exhibit 20 shows very weak net restaurant growth in
the US & Canada division, the other segments have shown impressive numbers and potential.
EMEA: The BK EMEA division has been doing extremely well. The restaurants are being
well accepted within the European population. Same store sales grew at an average rate of
3.21% while net restaurants grew at an average rate of 2.42%. This solid statistics are due to
successful partnerships in the EMEA region. In September 2015, Groupe Bertrand announced
being in talks with Quick's owner, investment found Qualium, to take over all the franchise
and convert all Quick restaurants in France into Burger King which will rebrand 509
restaurants and generate over €1billion in sales. (Exhibit 22)
LAC: The Latin America Division lived up to the expectations within the last couple years.
Since Q4 2013, same store sales grew at an average rate of 4.38%. The well acceptance and
increase in traffic also led to new openings. Net restaurant grew at an average of 2.40%. The
prosperous franchise joint ventures led the impressive numbers. The Latin American segment
has been very productive with unit growth and same store sales growth, which is part of the
corporate plan to take advantage of the growing middle class the region now experiences.
(Exhibit 23)
APAC: Another prosperous region is the Asia Pacific segment. Since Q4 2013, same stores
sales rose by an average rate of 3.82% while net restaurants grew by an average rate of 5.02%.
The master franchise in the APAC region, BK AsiaPac Pte Limited, created the single largest
international franchise agreement in the company history, a deal to open over 1000 stores in
China with a new "super"-franchise headed by the Kurdoglu family of Turkey. (Exhibit 24)
Source: Bloomberg
-2%
0%
2%
4%
6%
8%
10%
Q32013 Q22014 Q12015 Q42015
0%
1%
2%
3%
4%
Q42013 Q32014 Q22015
NRG
SSS
BK
MCD
Source: Bloomberg
Source: Bloomberg
0%
1%
2%
3%
4%
Q4
2013
Q1
2014
Q2
2014
Q3
2014
Q4
2014
Q1
2015
Q2
2015
Q3
2015
Q4
2015
-5%
0%
5%
10%
Q42013 Q32014 Q22015
-2%
0%
2%
4%
6%
8%
Q4
2013
Q1
2014
Q2
2014
Q3
2014
Q4
2014
Q1
2015
Q2
2015
Q3
2015
Q4
2015
TH
DNKN
DNKNTH
BK MCD
Source: Bloomberg
Source: Bloomberg
6. 03/02/2016Stetson University Student Research
6
Exhibit 22: BK EMEA SSS NRG
Exhibit 23: BK LAC SSS NRG
Exhibit 24: BK APAC SSS NRG
Exhibit 25: BKW SG&A Expenses
Exhibit 26: QSR Interest Expenses Exhibit 27: QSR Long-Term Debt
FinancialAnalysis
The Global Expansion of Two Iconic Brands and Its Increased Value
Top Line Growth: In the past year, top line growth of QSR, was largely attributed to growth in same store
sales due to product developments and effective marketing and also the addition of new franchisee
relationships increasing theamount of restaurants within both brands. In 2015, revenue grew by 13.41% and
there is still potentialgrowth since McDonald’s has 88.11% more restaurants than Restaurant Brands.
McDonald’s has an image of being saturated in the industry;on the other hand, Restaurant Brands remains
novelty in many countries. The globalization efforts being prioritizewill likely increase thescope and
revenue of the corporation.
Bottom Line Growth: In the past year, the basic GAAP earnings per share showed negative earnings
within thefirst two quarters after the IPO in Q4 2014 due to the large acquisition of Tim Hortons. The
repayment of debt will decrease the amount of interest payed and will lead to higher EPS growth. The
management of Restaurant Brands has an image of being diligent with costs and bottomline growth. Burger
King’s (BKW) earnings per share grew an impressive 94.12% from Fiscal Year 2012 to Fiscal Year 2013.
The increase in value and aggressive management led to thepurchase of Tim Hortons. This is becoming a
pattern and will likely lead to new acquisitions.
Debt Obligations: Burger King Worldwide Inc. acquired Tim Hortons Inc. for about C$12.5 billion or
$11.4 billion. With the purchase of Tim Hortons, interest is tax-deductible, so what that will mean is it will
substantially reduce theprofits of Tim Hortons and Burger King and therefore significantly reduce the
amount of tax money being payed. Berkshire Hathaway has committed $3 billion of preferred equity
financing and earns 9% annual interest on its investment. Since the acquisition and IPO, the long-term debt
decreased at an average rate of 1.24% and the interest expense decreased at an average rate of 2.44%. The
extinguishment of debt is impacting theamount paid on interest expenses and its increasing theshareholder
return. This accelerated pay off will increase cash flow in the long run and increase theability for new
takeover targets. Another possibleoption for a higher franchisee growth would be to sell Tim Hortons'
distribution and manufacturing centers to a third party. If Restaurant Brands decide to take action with this
approach, it would decrease the debt owed and interest paid along with thepossibility for faster international
expansion and higher franchisee returns. It would increase the profit margins due to less cost of revenue
expenses. However, there could be some bad publicity, meaning many will argue of a possible change in the
quality of its coffee beans, or other scenarios.
SG&A Expense: Restaurant Brands International’ SG&A expenses accounted for an average of 7.95% of
totalrevenue in thelast fiscal year. SG&A expenses were relatively high in thefirst few quarters’ post
acquisition. If we look at thenew management culture and historic data from BKW, theSG&A expenses
decreased from Q2 2011 to Q2 2014 at an average rate of 5.13%. This is numbers are aggressive and reflect
the management concern in creating value at all costs. It raised concerns in theCanadian population dueto
possibility of a many becoming unemployed. Restaurant Brands is effective in minimizing costs and within
a given time frame it will constantly deduct costs to a minimum without raising bad publicity. Mr. Warren
Buffett said at a Kraft-Heinz annual shareholder meeting, ““I tip my hat to what the 3G peoplehave done,
there were considerably more peoplein the job than needed” at the companies 3G bought. The he added, “I
hopeour Berkshire companies are not being run with more peoplethan they need, either.”
Source: Bloomberg
Source: Bloomberg
0%
2%
4%
6%
8%
Q32013 Q22014 Q12015 Q42015
-5%
0%
5%
10%
15%
Q32013 Q22014 Q12015 Q42015
0%
2%
4%
6%
8%
10%
12%
Q32013 Q22014 Q12015 Q42015
Source: Bloomberg
NRG
NRG
NRG
SSS
SSS
SSS
-30%
-20%
-10%
0%
10%
20%
0
50
100
150
Q2 2011 Q2 2012 Q2 2013 Q2 2014
Source: Bloomberg
Source: Bloomberg Source: Bloomberg
-8%
-6%
-4%
-2%
0%
110
115
120
125
130
Q12015 Q22015 Q32015 Q42015
SG&A
Percent Change
Percent Change
-4%
-3%
-2%
-1%
0%
1%
8400
8600
8800
9000
9200
Q12015 Q22015 Q32015 Q42015
Percent Change
Interest Expense
Long-Term Debt
7. 03/02/2016Stetson University Student Research
7
Pro Forma Analysis
In my pro forma, to arrive at my best estimations, I considered historical revenue of both brands
individually in accordance to restaurant growth and average same store sales growth. It mostly involved
franchisee growth since company operated restaurants will likely remain stable within the next four
quarters. I have also evaluated the mean analysts’ expectations from Thomson Reuters and Bloomberg
but with less weight since I believe the conversion of Quick Restaurants in France will happen faster
than the majority of analysts believe. The very little guidance given by the company during conference
calls and corporate fillings was also taken into consideration. The last portion considered when arriving
at my expected growth was the regression analysis comparing Restaurant Brands stock prices with gas
prices, the S&P 500 index and the McDonald’s stock prices. Since the IPO was recent at the end of
2014, Burger King’s Worldwide (BKW) prices were used to arrive at the end result.
Top Line Growth: Historically from Q3 2012 to Q3 2014, Tim Hortons top line growth were divided
between two segments; company operated with an average of 70.08% of total revenue and franchise
with an average of 25.34%. The Revenue breakdown within Tim Hortons is based on warehouse sales,
sales from restaurants Consol Fin 46R and company-operated restaurant sales with the smaller portion
of revenue due to limited restaurants actually owned by the brand. Tim Hortons has an extremely robust
and mature distribution warehousing and supply network and it supplies the majority of restaurants in
the North American segment. The warehouse benefits directly with the increase in franchisee
restaurants.
Burger King’s top line growth during Q4 2013 to Q3 2014 is mainly from franchise and property
revenues with an average of 92.57%, from the total revenue. Within the franchise and property segment,
royalties received from franchisees has an average of 66.21% of the total revenue, while property
revenue has an average of 20.82% and the rest being attributed to franchisee fees (initial payments and
renewal).
Tim Hortons ULC (THI US) - By Measure
In Millions of USD except Per Share Q3 2012 Q4 2012 Q1 2013 Q2 2013 Q3 2013 Q4 2013 Q1 2014 Q2 2014 Q3 2014
3 Months Ending 09/30/2012 12/29/2012 03/31/2013 06/30/2013 09/29/2013 12/29/2013 03/30/2014 06/29/2014 09/29/2014
Revenue 805.8 819.0 725.7 782.2 794.4 856.8 695.7 801.4 835.9
Company Operated 571.2 575.2 519.7 555.8 554.2 569.9 491.1 562.6 583.6
% of Total Revenue 70.89% 70.24% 71.61% 71.06% 69.76% 66.52% 70.59% 70.20% 69.82%
Warehouse Sales 477.5 478.8 427.7 458.1 455.9 475.7 410.6 86.5 491.4
% of Total Revenue 59.25% 58.46% 58.94% 58.56% 57.39% 55.53% 59.02% 10.79% 58.79%
Sales from Restaurants Consol FIN 46R 85.8 89.9 86.1 91.4 92.5 89.2 75.7 469.1 86.5
% of Total Revenue 10.65% 10.98% 11.86% 11.68% 11.64% 10.41% 10.88% 58.53% 10.35%
Company-operated Restaurant Sales 7.9 6.6 5.9 6.4 5.9 4.9 4.8 7.1 5.7
% of Total Revenue 0.98% 0.80% 0.82% 0.81% 0.74% 0.58% 0.69% 0.89% 0.68%
Franchise 234.6 243.8 206.0 226.4 240.2 286.9 204.6 238.8 252.3
% of Total Revenue 29.11% 29.76% 28.39% 28.94% 30.24% 33.48% 29.41% 29.80% 30.18%
Rents and Royalties 202.5 202.1 186.0 204.6 204.2 202.5 181.1 206.2 211.8
% of Total Revenue 25.13% 24.68% 25.62% 26.16% 25.70% 23.64% 26.03% 25.73% 25.34%
Franchise Fees 32.1 41.7 20.0 21.8 36.1 84.4 23.5 32.6 40.4
% of Total Revenue 3.98% 5.09% 2.76% 2.79% 4.54% 9.85% 3.37% 4.07% 4.84%
Number of Locations 4,138.00 4,264.00 4,288.00 4,304.00 4,350.00 4,485.00 4,524.00 4,546.00 4,590.00
% of Growth 3.04% 0.56% 0.37% 1.07% 3.10% 0.87% 0.49% 0.97%
Franchise 4,115.00 4,242.00 4,271.00 4,284.00 4,332.00 4,469.00 4,507.00 4,528.00 4,572.00
Company-Operated 23.00 22.00 17.00 20.00 18.00 16.00 17.00 18.00 18.00
Source: Bloomberg
8. 03/02/2016Stetson University Student Research
8
After the IPO, Tim Hortons represents themajority of revenue, with an average of 72.96% of the total
revenue, and it is mostly warehouse revenue since Tim Hortons accounts for less than one third of the total
restaurants. Burger King revenue is on average 27.04% of thetotal revenue since it now has a fully
franchise business model containing high margins out of royalties from franchisees.
Seasonality: Restaurant Brands is moderately seasonal. The restaurant sales are typically higher in the
spring and summer months when the weather is warmer. Due to the seasonality of the business, it is
important to look at the overall pictureand compare results in a quarterly based model. Historically, in the
first quarter sales are lower than other quarters. In relation to Tim Hortons, thereis an average historical
decrease of 6.14% from company operated revenue Q4 to Q1 and a decrease of 14.97% from franchisee
revenue within thelast 5 years. Burger King has also experienced an impact in Q1 revenue, 8.59% decrease
on average. I have taken into consideration the seasonality factor when estimating the first quarter of the
year.
Restaurant Brands International Inc (QSR CN) - By Measure
In Millions of USD except Per Share Q4 2014 Q1 2015 Q2 2015 Q3 2015 Q4 2015
3 Months Ending 12/31/2014 03/31/2015 06/30/2015 09/30/2015 12/31/2015
Revenue 416.3 932.0 1,041.4 1,019.7 1,057.0
Tim Hortons 142.1 682.4 763.2 737.7 771.5
% of Total Revenue 34.13% 73.22% 73.29% 72.34% 72.99%
Burger King 274.2 249.6 278.2 282.0 285.5
% of Total Revenue 65.87% 26.78% 26.71% 27.66% 27.01%
Adjusted EBITDA — 354.6 427.2 440.7 442.6
Tim Hortons — 183.9 234.3 244.0 243.4
Burger King — 170.7 192.9 196.7 199.2
Number of Locations 19,043 19,111 19,304 19,514 19,917
Burger King 14,372 14,387 14,528 14,669 15,003
% of Growth 0.10% 0.98% 0.97% 2.28%
Franchise 14,320 14,335 14,476 14,617 14,951
Company 52 52 52 52 52
Tim Hortons 4,671 4,724 4,776 4,845 4,914
% of Growth 1.13% 1.10% 1.44% 1.42%
Franchise 4,658 4,711 4,763 4,832 4,901
Company 13 13 13 13 13
Source: Bloomberg
Burger King Worldwide Inc (BKW US) - By Measure
In Millions of USD except Per Share Q4 2013 Q1 2014 Q2 2014 Q3 2014
3 Months Ending 12/31/201303/31/201406/30/201409/30/2014
Revenue 265.2 240.9 261.2 278.9
Franchise & Property 243.3 222.4 242.9 260.0
% of Total Revenue 91.74% 92.32% 92.99% 93.22%
Franchise royalties — 160.3 174.3 182.3
% of Total Revenue 66.54% 66.73% 65.36%
Property revenues — 53.5 54.3 54.3
% of Total Revenue 22.21% 20.79% 19.47%
Franchise Fees and Other Revenue — — 14.3 23.4
Renewal and other related franchise fees — 8.6 — —
Initial franchise fees — — — —
Company Restaurant 21.9 18.5 18.3 18.9
% of Total Revenue 8.26% 7.68% 7.01% 6.78%
Restaurants
Total System 13,667.00 13,677.00 13,808.00 13,960.00
% of Growth 0.07% 0.96% 1.10%
Company Restaurant 52.00 52.00 52.00 52.00
Franchise 13,615.00 13,625.00 13,756.00 13,908.00
Source: Bloomberg
9. 03/02/2016Stetson University Student Research
9
Overall, my final estimates included different weights from different sources. The analyst’s estimates
derived from Bloomberg and Reuters. My third weight was historical data from BKW and THI with the
addition of my futureoutlook with the proven management success. From my perspective, analysts were a
bit shy in relation to thecost cutting culture and strong market penetration mentality the group possesses.
The cost of revenue decreased at a 2.77% average rate during 2015, and I am optimisticit will continue to
decrease, as more cost synergies opportunities present itself. Therevenue growth is also higher than the
average analyst predictions and it is from my belief that Tim Hortons will have a higher growth
internationally and the acquisition of Quick in France will have a faster conversion to Burger King brand
than it is expected so thenumber will impact the net restaurant growth along with franchisee revenue.
Restaurant Brands International Inc (QSR CN) - GAAP
In Millions of USD except Per Share Q4 2014 Q1 2015 Q2 2015 Q3 2015 Q4 2015 Q1 2016 Est Q2 2016 Est Q3 2016 Est Q4 2016 Est
3 Months Ending 12/31/2014 03/31/2015 06/30/2015 09/30/2015 12/31/2015 03/31/2016 06/30/2016 9/30/2016 12/31/2016
Revenue 416.3 932.0 1,041.4 1,019.7 1,057.0 949.3 1,034.7 1,053.0 1,091.0
+ Sales & Services Revenue 416.3 932.0 1,041.4 1,019.7 1,057.0 949.3 1,034.7 1,053.0 1,091.0
- Cost of Revenue 104.8 436.5 475.9 446.6 454.9 398.7 434.6 442.3 458.2
+ Cost of Goods & Services 104.8 436.5 475.9 446.6 454.9 398.7 434.6 442.3 458.2
Gross Profit 311.5 495.5 565.5 573.1 602.1 550.6 600.1 610.7 632.8
+ Other Operating Income 0.0 0.0 0.0 0.0 0.0 0.0 0.0 0.0 0.0
- Operating Expenses 412.8 273.7 267.2 229.1 280.1 246.8 269.0 273.8 283.7
+ Selling, General & Admin 171.9 111.0 102.1 104.3 120.4 104.4 113.8 115.8 120.0
+ Other Operating Expense 240.9 162.7 165.1 124.8 159.7 142.4 155.2 158.0 163.7
Operating Income (Loss) -101.3 221.8 298.3 344.0 322.0 303.8 331.1 337.0 349.1
- Non-Operating (Income) Loss 128.2 123.6 163.7 116.4 116.0 116.0 116.0 116.0 116.0
+ Interest Expense, Net 128.2 123.9 123.8 116.0 116.0 116.0 116.0 116.0 116.0
+ Interest Expense 0.0 125.3 124.8 116.9 116.0 116.0 116.0 116.0 116.0
- Interest Income 0.0 1.4 1.0 0.9 0.0 0.0 0.0 0.0 0.0
+ Foreign Exch (Gain) Loss 0.0 0.0 9.6 10.9 1.6 0.0 0.0 0.0 0.0
+ Other Non-Op (Income) Loss 155.4 -0.3 30.3 -10.5 -1.6 0.0 0.0 0.0 0.0
Pretax income -384.9 98.2 134.6 227.6 206.0 187.8 215.1 221.0 233.1
- Income Tax Expense (Benefit) 4.5 47.3 43.8 44.7 21.5 37.2 40.6 41.3 42.8
Income (Loss) from Cont Ops -389.4 50.9 90.8 182.9 184.5 150.6 174.5 179.7 190.4
- Net Extraordinary Losses (Gains) 0.0 0.0 0.0 0.0 0.0 0.0 0.0 0.0 0.0
+ Discontinued Operations 0.0 0.0 0.0 0.0 0.0 0.0 0.0 0.0 0.0
+ XO & Accounting Changes 0.0 0.0 0.0 0.0 0.0 0.0 0.0 0.0 0.0
Income (Loss) Incl. MI -389.4 50.9 90.8 182.9 184.5 150.6 174.5 179.7 190.4
- Minority Interest -435.4 -9.7 13.7 65.8 65.3 30.7 33.4 34.0 35.2
Net Income, GAAP 46.0 60.6 77.1 117.1 119.2 119.9 141.1 145.7 155.1
- Preferred Dividends 13.8 68.7 67.5 67.5 67.5 67.5 67.5 67.5 67.5
- Other Adjustments 546.4 0.0 0.0 0.0 0.0 0.0 0.0 0.0 0.0
Net Income Avail to Common, GAAP -514.2 -8.1 9.6 49.6 51.7 52.4 73.6 78.2 87.6
Net Income Avail to Common, Adj -345.9 14.8 74.5 64.9 99.5 68.4 91.0 95.9 105.9
Net Abnormal Losses (Gains) 168.4 22.9 64.9 15.3 47.8 15.9 17.4 17.7 18.3
Net Extraordinary Losses (Gains) 0.0 0.0 0.0 0.0 0.0 0.0 0.0 0.0 0.0
Basic Weighted Avg Shares 319.1 202.2 202.4 202.4 206.9 206.9 206.9 206.9 206.9
Basic EPS, GAAP -1.61 -0.04 0.05 0.25 0.25 0.25 0.36 0.38 0.42
Basic EPS from Cont Ops, Adjusted -1.08 0.07 0.37 0.32 0.48 0.25 0.36 0.38 0.42
Diluted Weighted Avg Shares 376.7 467.2 476.4 476.5 474.7 474.7 474.7 474.7 474.7
Diluted EPS, GAAP -1.61 -0.04 0.05 0.24 0.25 0.25 0.36 0.38 0.42
Diluted EPS from Cont Ops, Adjusted -1.16 0.01 0.19 0.27 0.35 0.25 0.36 0.38 0.42
10. 03/02/2016Stetson University Student Research
10
Valuations
In this section, we estimatethe fair values of Restaurant Brands International’s stock. It should be noted that
all input datawere derived from historical company dataand pro forma estimates.
Sales Franchise Value Model: TheSales Franchise valuation is often used when dealing with companies
that are able to produce significant franchise value, i.e. repeating its business model at a higher profit
margin. This model distinguishes between a company’s current profit margin and the margin that can be
derived from future opportunities. Theunderlying assumption for Restaurant Brands is that it will be able to
improve its profit margin by lowering its operating costs through zero based cost strategy relating to
recently acquired Tim Hortons.
Investment Risk
FX Impact: In trading could be a factor distinguishing the stock returns of the same company under
different trading platforms. They are expected to move similarly but after analyzing and performing a
regression on both stocks returns, they only have a correlation of 0.94 and an adjusted r2 of 0.886 meaning
QSR only explains 88.6% of theQSR.TO return. Moreover, I analyzed the currency changes of the
Canadian dollars against the US dollars and have discovered that theCanadian dollar has depreciated
13.40% since theIPO. It means that 1 Canadian dollar went from being worth 0.8650 cents to just about
0.7490 cents during this couple of years. After running the regression with theCanadian dollars percent
changes, both the correlation and the adjusted r2 went up significantly to 0.983 and 0.967 meaning that the
changes in return from both platforms are attributed to FX fluctuations. If the Canadian dollars falls it makes
sense to invest in QSR.TO and if it rises we would want to invest in QSR. But theway to get rid of therisk
of currency movement is invest parallel in theETF Canadian Dollar which will hedge against the FX
impact.
Relationships with MFJV Flourish/Flounder: Theability of thecompany to grow thebrand relies in good
part on its ability to convince partners to invest capital to grow the brand and to drive growth and strong
businesses at store level on an ongoing basis.
Cyclicality: Although the restaurant industry is consumer cyclical, the quick service industry maintains a
slightly defensive position. Thequick service restaurants maintain good prices and a vast menu, therefore,
they benefit when the economy does well or if it does poorly. However, they also do not perform as well as
other companies in their prime business cycles. When theeconomy is doing well, they are second to the full
service restaurants, and when the economy is doing poorly they are the customer primary choice.
Additional Franchises Equal Additional Risk: Because franchises are an integral part of their business
model, I expect that Restaurant Brands International will continue to grow more and more with more and
more franchise openings. Even though there are programs and training for thenew franchisees, there is still
the risk of puttingthename and brand of Restaurant Brands International into other people’s hands. By
relying solely on thefranchise growth, the company becomes more susceptibleto owners that do not know
what they are doing, and could possibly harm thecompany. As Burger King and Tim Hortons are growing
at a rate much faster than m any of its competitors, they are taking on more risk.
Key Man/Investor: 3G has developed a reputation as successful investors. Should the company reduce its
equity position or influence in managing QSR, it could create uncertainty for QSR's share price. Warren
Buffett/Berkshire Hathaway's financial backing of thecompany via $3 billion in preferred shares and equity
warrants (since converted to more than 8mm QSR shares) has, in our view, increased the confidence of
investors for investing in QSR. Should Berkshire reduce or increase its position in the stock, it could affect
the confidence of investors and therefore the share price.
Interest Rates/Market Environment Sentiment: Themarket appears to favor high ROE/ROIC stories in
such a low interest rate environment. Furthermore, fund flows is driving interest in consumer staples and
discretionary stocks. A change in sentiment could be detrimental to the valuation of a stock like QSR. Also,
should interest rates rise, financing costs would increase, which would affect earnings growth and
potentially capitaldecisions for thoseinvesting in QSR's brand growth.
11. 03/02/2016Stetson University Student Research
11
Table of Contents
Appendix1: Income Statement 12
Appendix2: Common Size Income Statement 13
Appendix3: Balance Sheet 14
Appendix4: Common Size Balance Sheet 15
Appendix5: Statement of Cash Flows 16
Appendix6: Sales Franchise Value Model 17
Appendix7: Ratio Comparison 18
Appendix8: Regression Analysis 19
12. 03/02/2016Stetson University Student Research
12
Appendix 1: Income Statement
Source: Bloomberg
Restaurant Brands International Inc (QSR CN) - GAAP
In Millions of USD except Per Share Q4 2014 Q1 2015 Q2 2015 Q3 2015 Q4 2015
3 Months Ending 12/31/2014 03/31/2015 06/30/2015 09/30/2015 12/31/2015
Revenue 416.3 932.0 1,041.4 1,019.7 1,057.0
+ Sales & Services Revenue 416.3 932.0 1,041.4 1,019.7 1,057.0
- Cost of Revenue 104.8 436.5 475.9 446.6 454.9
+ Cost of Goods & Services 104.8 436.5 475.9 446.6 454.9
Gross Profit 311.5 495.5 565.5 573.1 602.1
+ Other Operating Income 0.0 0.0 0.0 0.0 0.0
- Operating Expenses 412.8 273.7 267.2 229.1 280.1
+ Selling, General & Admin 171.9 111.0 102.1 104.3 120.4
+ Other Operating Expense 240.9 162.7 165.1 124.8 159.7
Operating Income (Loss) -101.3 221.8 298.3 344.0 322.0
- Non-Operating (Income) Loss 128.2 123.6 163.7 116.4 116.0
+ Interest Expense, Net 128.2 123.9 123.8 116.0 116.0
+ Interest Expense 0.0 125.3 124.8 116.9 116.0
- Interest Income 0.0 1.4 1.0 0.9 0.0
+ Foreign Exch (Gain) Loss 0.0 0.0 9.6 10.9 1.6
+ Other Non-Op (Income) Loss 155.4 -0.3 30.3 -10.5 -1.6
Pretax income -384.9 98.2 134.6 227.6 206.0
- Income Tax Expense (Benefit) 4.5 47.3 43.8 44.7 21.5
Income (Loss) from Cont Ops -389.4 50.9 90.8 182.9 184.5
- Net Extraordinary Losses (Gains) 0.0 0.0 0.0 0.0 0.0
+ Discontinued Operations 0.0 0.0 0.0 0.0 0.0
+ XO & Accounting Changes 0.0 0.0 0.0 0.0 0.0
Income (Loss) Incl. MI -389.4 50.9 90.8 182.9 184.5
- Minority Interest -435.4 -9.7 13.7 65.8 65.3
Net Income, GAAP 46.0 60.6 77.1 117.1 119.2
- Preferred Dividends 13.8 68.7 67.5 67.5 67.5
- Other Adjustments 546.4 0.0 0.0 0.0 0.0
Net Income Avail to Common, GAAP -514.2 -8.1 9.6 49.6 51.7
Net Income Avail to Common, Adj -345.9 14.8 74.5 64.9 99.5
Net Abnormal Losses (Gains) 168.4 22.9 64.9 15.3 47.8
Net Extraordinary Losses (Gains) 0.0 0.0 0.0 0.0 0.0
Basic Weighted Avg Shares 319.1 202.2 202.4 202.4 206.9
Basic EPS, GAAP -1.61 -0.04 0.05 0.25 0.25
Basic EPS from Cont Ops -1.61 -0.04 0.05 0.25 0.25
Basic EPS from Cont Ops, Adjusted -1.08 0.07 0.37 0.32 0.48
Diluted Weighted Avg Shares 376.7 467.2 476.4 476.5 474.7
Diluted EPS, GAAP -1.61 -0.04 0.05 0.24 0.25
Diluted EPS from Cont Ops -1.61 -0.04 0.05 0.24 0.25
Diluted EPS from Cont Ops, Adjusted -1.16 0.01 0.19 0.27 0.35
13. 03/02/2016Stetson University Student Research
13
Appendix 2: Common Size Income Statement
Source: Bloomberg
Restaurant Brands International Inc (QSR CN) - GAAP
In Millions of USD except Per Share Q4 2014 Q1 2015 Q2 2015 Q3 2015 Q4 2015
3 Months Ending 12/31/2014 03/31/2015 06/30/2015 09/30/2015 12/31/2015
Revenue 100.00% 100.00% 100.00% 100.00% 100.00%
+ Sales & Services Revenue 100.00% 100.00% 100.00% 100.00% 100.00%
- Cost of Revenue 25.17% 46.83% 45.70% 43.80% 43.04%
+ Cost of Goods & Services 25.17% 46.83% 45.70% 43.80% 43.04%
Gross Profit 74.83% 53.17% 54.30% 56.20% 56.96%
+ Other Operating Income 0.00% 0.00% 0.00% 0.00% 0.00%
- Operating Expenses 99.16% 29.37% 25.66% 22.47% 26.50%
+ Selling, General & Admin 41.29% 11.91% 9.80% 10.23% 11.39%
+ Other Operating Expense 57.87% 17.46% 15.85% 12.24% 15.11%
Operating Income (Loss) -24.33% 23.80% 28.64% 33.74% 30.46%
- Non-Operating (Income) Loss 30.80% 13.26% 15.72% 11.42% 10.97%
+ Interest Expense, Net 30.80% 13.29% 11.89% 11.38% 10.97%
+ Interest Expense 0.00% 13.44% 11.98% 11.46% 10.97%
- Interest Income 0.00% 0.15% 0.10% 0.09% 0.00%
+ Foreign Exch (Gain) Loss 0.00% 0.00% 0.92% 1.07% 0.15%
+ Other Non-Op (Income) Loss 37.33% -0.03% 2.91% -1.03% -0.15%
Pretax income -92.46% 10.54% 12.92% 22.32% 19.49%
- Income Tax Expense (Benefit) 1.08% 5.08% 4.21% 4.38% 2.03%
Income (Loss) from Cont Ops -93.54% 5.46% 8.72% 17.94% 17.46%
- Net Extraordinary Losses (Gains) 0.00% 0.00% 0.00% 0.00% 0.00%
+ Discontinued Operations 0.00% 0.00% 0.00% 0.00% 0.00%
+ XO & Accounting Changes 0.00% 0.00% 0.00% 0.00% 0.00%
Income (Loss) Incl. MI -93.54% 5.46% 8.72% 17.94% 17.46%
- Minority Interest -104.59% -1.04% 1.32% 6.45% 6.18%
Net Income, GAAP 11.05% 6.50% 7.40% 11.48% 11.28%
- Preferred Dividends 3.31% 7.37% 6.48% 6.62% 6.39%
- Other Adjustments 131.25% 0.00% 0.00% 0.00% 0.00%
Net Income Avail to Common, GAAP -123.52% -0.87% 0.92% 4.86% 4.89%
Net Abnormal Losses (Gains) 40.44% 2.45% 6.23% 1.50% 4.53%
Net Extraordinary Losses (Gains) 0.00% 0.00% 0.00% 0.00% 0.00%
Basic Weighted Avg Shares 319.1 202.2 202.4 202.4 206.9
Basic EPS, GAAP -1.61 0.00 0.00 0.00 0.00
Basic EPS from Cont Ops -1.61 -0.04 0.05 0.25 0.25
Basic EPS from Cont Ops, Adjusted -1.0838 0.07 0.37 0.32 0.48
Diluted Weighted Avg Shares 376.7 467.2 476.4 476.5 474.7
Diluted EPS, GAAP -1.61 -0.04 0.05 0.24 0.25
Diluted EPS from Cont Ops -1.61 -0.04 0.05 0.24 0.25
Diluted EPS from Cont Ops, Adjusted -1.1631 0.01 0.19 0.27 0.35
16. 03/02/2016Stetson University Student Research
16
Appendix 5: Statement of Cash Flows
Source: Bloomberg
Restaurant Brands International Inc (QSR CN) - Standardized
In Millions of USD except Per Share Q1 2015 Q2 2015 Q3 2015 Q4 2015
3 Months Ending 03/31/2015 06/30/2015 09/30/2015 12/31/2015
Cash from Operating Activities
+ Net Income 60.6 77.1 117.1 119.2
+ Depreciation & Amortization 55.6 54.7 27.5 44.2
+ Non-Cash Items -16.3 50.1 72.6 199.1
+ Stock-Based Compensation 15.5 7.0 14.4 13.9
+ Deferred Income Taxes -38.0 -54.5 -22.3 82.5
+ Other Non-Cash Adj 6.2 97.6 80.5 102.7
+ Chg in Non-Cash Work Cap 161.8 63.7 224.8 -108.1
+ (Inc) Dec in Inventories -3.0 8.0 -10.1 14.3
+ Inc (Dec) in Accts Payable 24.4 14.9 99.5 52.4
+ Inc (Dec) in Other 140.4 40.8 135.4 -174.8
+ Net Cash From Disc Ops 0.0 0.0 0.0 0.0
Cash from Operating Activities 261.7 246.5 442.2 254.4
Cash from Investing Activities
+ Change in Fixed & Intang -29.4 -27.6 -9.0 -29.7
+ Disp in Fixed & Intang 0.0 0.0 16.9 2.7
+ Disp of Fixed Prod Assets — 0.0 16.9 2.7
+ Disp of Intangible Assets 0.0 0.0 0.0 0.0
+ Acq of Fixed & Intang -29.4 -27.6 -25.9 -32.4
+ Acq of Fixed Prod Assets -29.4 -27.6 -25.9 -32.4
+ Acq of Intangible Assets 0.0 0.0 0.0 0.0
+ Net Change in LT Investment 0.0 0.0 0.0 0.0
+ Dec in LT Investment 0.0 0.0 0.0 0.0
+ Inc in LT Investment 0.0 0.0 0.0 0.0
+ Net Cash From Acq & Div 0.0 0.0 0.0 0.0
+ Cash from Divestitures 0.0 0.0 0.0 0.0
+ Cash for Acq of Subs 0.0 0.0 0.0 0.0
+ Cash for JVs 0.0 0.0 0.0 0.0
+ Other Investing Activities 62.1 -29.6 -6.5 8.2
+ Net Cash From Disc Ops 0.0 0.0 0.0 0.0
Cash from Investing Activities 32.7 -57.2 -15.5 -21.5
Cash from Financing Activities
+ Dividends Paid 0.0 -124.5 -114.3 -123.6
+ Cash From (Repayment) Debt -1,020.6 -321.8 -18.2 -17.2
+ Cash (Repurchase) of Equity 2.5 1.2 0.0 1.9
+ Increase in Capital Stock 2.5 1.2 0.0 1.9
+ Decrease in Capital Stock 0.0 0.0 0.0 0.0
+ Other Financing Activities 1.4 -83.4 -3.2 -295.4
+ Net Cash From Disc Ops 0.0 0.0 0.0 0.0
Cash from Financing Activities -1,016.7 -528.5 -135.7 -434.3
Effect of Foreign Exchange Rates -59.0 6.2 -4.4 -16.3
Net Changes in Cash -781.3 -333.0 286.6 -217.7
Cash Paid for Taxes 42.9 36.7 12.2 116.5
Cash Paid for Interest 88.5 136.3 61.0 122.5
Reference Items
EBITDA 277.4 353.0 371.5 366.2
Trailing 12M EBITDA Margin — — — 33.78
Net Cash Paid for Acquisitions — — 0.0 0.0
Tax Benefit from Stock Options — — 0.0 0.5
Free Cash Flow 232.3 218.9 416.3 222.0
Free Cash Flow to Firm 297.2 303.1 510.2 326.7
Free Cash Flow to Equity -857.0 -170.4 347.5 140.0
Free Cash Flow per Basic Share 1.15 1.08 2.06 1.07
Price to Free Cash Flow — — — 6.98
Cash Flow to Net Income 4.32 3.20 3.78 2.13
Source: Bloomberg
17. 03/02/2016Stetson University Student Research
17
Appendix 6: Sales Franchise Value Model
Source: Student Estimates
Fair Value: $43.66
Undervaluation: 20.31%
SalesFranchise Value Model
Fair Value $43.66
Current Salesper Share $36.29
Current ProfitMargin 11.29%
Profit Margin on NewSales 15.30%
Sales/InvestedCapital 6.54%
RequiredRate of Return 8%
PresentValue of Future Sales Growth 9.50%
19. 03/02/2016Stetson University Student Research
19
Appendix 8: Regression Analysis
Source: Bloomberg, Excel
QSR Return against QSR.TO Return
With the inclusion of CAD/USD
20. 03/02/2016Stetson University Student Research
20
Sources:
Baseline
Bloomberg
CNBC
Morningstar
Yahoo Finance
Business Insider
Restaurant Brands International 10-Q
Restaurant Brands International 10-K
Restaurant Brands International Announcements
Restaurant Brands International Transcripts
Restaurant Brands International Conference Calls
Burger King Worldwide 10-Q
Burger King Worldwide10-K
Burger King Worldwide Announcement
Burger King Worldwide Transcripts
Burger King Worldwide Conference Calls
Tim Hortons 10-K
Tim Hortons 10-Q
21. 03/02/2016Stetson University Student Research
21
Disclosures:
Ownership and material conflicts of interest:
The author(s), or a memberof theirhousehold, of this report does not holda financial interest in the securities ofthis company.
The author(s), or a memberof theirhousehold, of this report does not knowof the existence ofanyconflicts of interest that might
bias the content orpublicationof this report.
Receiptof compensation:
Compensationof the author(s) of this report is not basedon investment bankingrevenue.
Position as a officer or director:
The author(s), or a memberof theirhousehold, does not serveas an officer, director oradvisory boardmemberof thesubject company.
Market making:
The author(s) does not act as a market maker in thesubject company’s securities.
Disclaimer:
The informationset forthhereinhas beenobtainedorderivedfromsources generally available to the public andbelievedby theauthor(s)
to be reliable, but the author(s) does not make anyrepresentation orwarranty, express or implied, as to its accuracyor completeness. The
information is not intendedtobe usedas the basis of any investment decisions by any person orentity. This informationdoes not constitute
investment advice, nor is it anofferor a solicitationof an offer to buy or sell anysecurity.