SlideShare a Scribd company logo
1 of 6
Download to read offline
research papers
796 https://doi.org/10.1107/S1600577517008013 J. Synchrotron Rad. (2017). 24, 796–801
Received 16 December 2016
Accepted 30 May 2017
Edited by D. A. Reis, SLAC National
Accelerator Laboratory, USA
‡ Present address: Joint Center for Artificial
Photosynthesis, California Institute of
Technology, Pasadena, CA 91125, USA.
Keywords: X-ray reflectivity; multilayer;
interdiffusion.
X-ray reflectivity measurement of interdiffusion
in metallic multilayers during rapid heating
J. P. Liu,a,b
J. Kirchhoff,a
L. Zhou,a
‡ M. Zhao,a
M. D. Grapes,a
D. S. Dale,c
M. D. Tate,d
H. T. Philipp,d
S. M. Gruner,c,d,e
T. P. Weihsa
and T. C. Hufnagela
*
a
Department of Materials Science and Engineering, Johns Hopkins University, Baltimore, MD 21218, USA, b
School
of Materials Science and Engineering, Beijing Institute of Technology, Beijing 100081, People’s Republic of China,
c
Cornell High Energy Synchrotron Source (CHESS), Cornell University, Ithaca, NY 14853, USA, d
Department of Physics,
Cornell University, Ithaca, NY 14853, USA, and e
Kavli Institute at Cornell for Nanoscale Science, Cornell University,
Ithaca, NY 14853, USA. *Correspondence e-mail: hufnagel@jhu.edu
A technique for measuring interdiffusion in multilayer materials during rapid
heating using X-ray reflectivity is described. In this technique the sample is bent
to achieve a range of incident angles simultaneously, and the scattered intensity
is recorded on a fast high-dynamic-range mixed-mode pixel array detector.
Heating of the multilayer is achieved by electrical resistive heating of the silicon
substrate, monitored by an infrared pyrometer. As an example, reflectivity data
from Al/Ni heated at rates up to 200 K s1
are presented. At short times the
interdiffusion coefficient can be determined from the rate of decay of the
reflectivity peaks, and it is shown that the activation energy for interdiffusion
is consistent with a grain boundary diffusion mechanism. At longer times the
simple analysis no longer applies because the evolution of the reflectivity
pattern is complicated by other processes, such as nucleation and growth of
intermetallic phases.
1. Introduction
Solid-state interdiffusion is of profound importance in
nanostructured materials, where the diffusion distances are
short and diffusion times can be small. In semiconductor
electronics, for example, the possibility of device failure
resulting from interdiffusion has spurred extensive research
into materials that can act as diffusion barriers between device
components (Nicolet, 1997). Because common analysis tech-
niques either require destructive depth profiling or are rather
slow, most studies of interdiffusion are performed ex situ,
often after isothermal annealing. Such studies usually assume
that the transients associated with heating and cooling the
specimen can be neglected.
In some situations, however, the transients themselves are
of interest, for example in rapid thermal annealing. In other
situations, interfacial reactions alter the structure of the
material in ways that make the interpretation of interdiffusion
measurements after the fact difficult or impossible. It is
therefore desirable to develop experimental techniques that
allow measurements in situ, while interdiffusion is occurring.
One such technique is X-ray reflectivity (low-angle
diffraction) performed on multilayer materials. In the low-
angle region the intensities of X-ray scattering peaks are
related to the composition modulations through the thickness
of the multilayer. By monitoring the change in the intensities
of these peaks we can measure interdiffusion. In fact, X-ray
reflectivity is among the most sensitive probes of interdiffu-
ISSN 1600-5775
sion, capable of measuring interdiffusion coefficients as low as
1027
m2
s1
(Greer, 1997).
In a conventional X-ray reflectivity measurement the scat-
tered intensity is recorded by step-scanning through a range of
angles. This makes in situ observations impractical except for
slow processes. To overcome this limitation, several techni-
ques have been developed for recording complete reflectivity
patterns simultaneously. For example, using a curved specimen
one can record the scattering over a range of angles simulta-
neously using a position-sensitive X-ray detector (Naudon
et al., 1989; Niggemeier et al., 1997; Stoev  Sakurai, 2013).
Another approach is to use an X-ray beam with a range of
wavelengths, either by dispersing the X-ray beam into a range
of angles (Matsushita et al., 2008) (again using a position-
sensitive detector) or, at a single angle, recording scattering
with an energy-sensitive detector (Neissendorfer et al., 1999;
Raghavendra Reddy et al., 2009).
In this paper we show how to use the curved-sample
approach to perform time-resolved in situ X-ray reflectivity
characterization of the initial stages of interdiffusion during
continuous heating of metallic multilayers. We have tested our
technique at heating rates up to 200 K s1
, but in principle it
can be applied at much higher rates, limited by the intensity of
the X-ray source and the capabilities of the X-ray detector.
During the initial stages of heating we can determine the
interdiffusion coefficient ~
D
D by a simple analysis of the rate of
decay of the peaks in the reflectivity pattern, which are related
to the composition modulation of the multilayer. At longer
times this simple analysis becomes unreliable because the
reflectivity pattern is affected by other processes, such as
nucleation and growth of intermetallic phases.
2. Experimental
The samples for this study were multilayer foils produced by
DC magnetron sputtering alternating layers of alluminum
alloy 1100 with layers of nickel–7 wt% vanadium. The ratio of
the Al layer thickness to the Ni–V layer thickness was 3:2,
which yields an atomic ratio of Al:Ni–V of 1:1. The bilayer
period of the layers (i.e. the sum of one Al and one Ni–V layer
thickness) was 20–30 nm. Because X-ray reflectivity is strongly
sensitive to the roughness of the layers and the roughness
increases with the number of layers deposited, we restricted
the thickness of our samples to three to six bilayer periods
(Al/Ni layer pairs). The multilayers were deposited onto
500 mm-thick polished Si wafers, onto which we also deposited
300 nm-thick gold pads by thermal evaporation (Fig. 1a).
(A 20 nm-thick layer of tungsten was deposited first to
promote adhesion of the gold to the silicon substrate.) The
gold pads provided electrical contacts to permit resistive
heating of the doped Si substrate, which in turn heated the
multilayer. The power source for these experiments was a
series array of 9 Vor 12 V batteries, switched with a solid-state
relay to allow control of the duration of the current pulse. We
monitored the temperature of the multilayer during heating
with a single-wavelength infrared pyrometer (Kleiber KGA
740-LO), sampling at 50 Hz. The lowest temperature that can
be measured with this pyrometer is 475 K, so we were unable
to use it to track the very earliest stages of heating.
Angle-dispersive X-ray reflectivity uses curved specimens
so that the angle of incidence of X-rays on the surface varies
with position, as shown in Fig. 1(b). Although multilayers can
be deposited on curved substrates, we elected instead to use
flat substrates which we then bent in a specially designed
loading fixture. Pragmatically, flat substrates are cheaper than
precisely polished curved substrates, and it is easier to deposit
uniform multilayers on them. This approach also allows flex-
ibility in choosing the radius of curvature (and thus the range
of angles over which the reflectivity is measured). Our four-
point bending apparatus is illustrated in Fig. 1(b). The two
lower loading rods are fixed in position, and bending is
achieved by using stepper motors to displace the two upper
rods. Gaps in the upper rods (not shown) provide a clear path
for the X-rays, and the rods (which are made of steel) are
electrically isolated from the substrate by kapton tape. Prior to
each reflectivity measurement we measured the curvature of
the specimen by means of a parallel-beam curvature setup
similar to that described by Floro et al. (1996).
The experiments described here were performed at station
A2 of the Cornell High Energy Synchrotron Source (CHESS)
using a Si(111) double-crystal monochromator to select
12.0 keV X-rays, with a flux of approximately 5  1010
photons
s1
mm2
. The beam height (0.3 mm) yielded a range of
incident angles from zero to approximately 1.3
, depending on
the radius of curvature of the specimen (typically about
research papers
J. Synchrotron Rad. (2017). 24, 796–801 J. P. Liu et al.  X-ray reflectivity measurement of interdiffusion 797
Figure 1
(a) The samples had lithographically patterned regions of Al/Ni
multilayer (4 cm long by 1 cm wide) along with gold pads (0.5 cm by
1 cm) to act as electrical contacts. (b) The samples were dynamically bent
in a four-point loading apparatus, with the curvature of the specimen
measured by a laser wafer-curvature technique and temperature
monitored by an optical pyrometer. (c) Example raw data from a 3  1
section of chips on the MMPAD array.
500 mm). The X-ray detector was a mixed-mode pixel array
detector (MMPAD), which is capable of framing continuously
at high rates (up to 1 kHz) and has a large dynamic range
(4  107
photons pixel1
) (Tate et al., 2013). The dynamic
range is useful because it allows both the low- and high-order
scattering peaks, which can differ in intensity by many orders
of magnitude, to be measured simultaneously. The detector
used here employed a 3  2 array of MMPAD chips (with
each chip having a square 128  128 array of 150 mm pixels)
although only a single row of three chips was used for these
measurements (Fig. 1c). With this detector placed 1013 mm
from the sample we recorded scattering over a range of scat-
tering vectors (q = 4 sin =, where  is one-half of the
scattering angle and  is the X-ray wavelength) of about
3 nm1
. The width of the X-ray beam was 1 mm, and the one-
dimensional reflectivity patterns shown below were obtained
by simply summing the output from the detector across the
width of the beam at each row of pixels corresponding to a
given value of q.
Fig. 2 shows X-ray reflectivity data from an Al/Ni multilayer
sample with a nominal bilayer period of  = 20 nm, recorded
two ways: using the apparatus described above, and on a
conventional parallel-beam diffractometer (Philips MRD)
using Cu K radiation with the sample nominally flat.
Although the basic features of the laboratory reflectivity data
are reproduced in the in situ synchrotron experiment, the
agreement is not perfect. There are several reasons for this.
First, the in situ technique records some non-specular scat-
tering (incident 6¼ exit) in addition to the desired specular
scattering (incident = exit). Second, there is variation in the
incident intensity in the in situ case due to the intensity profile
along the height of the synchrotron beam. Third, no attempt
has been made to correct for geometrical aberrations such as
anticlastic bending of the substrate. Finally, the energy band-
pass and the angular divergence of the X-ray beam are
different between the two cases.
Despite these differences the two reflectivity profiles are in
reasonably good agreement. Both profiles show an intensity
plateau below about q = 0.4 nm1
which is due to total
external reflection of X-rays from the multilayer. Above this,
both profiles show a series of low-angle scattering peaks from
the multilayer structure.
3. Results and discusson
Fig. 3(a) shows reflectivity data from an Al/Ni multilayer
recorded in situ during heating at 40 K s1
. The intensity of the
first peak (shown in the inset) decreases with increasing
temperature. The amplitudes of the peaks in the low-angle
region are proportional to the square of the amplitude of the
composition modulation (Cook, 1969; Paulson  Hilliard,
1977). If no phase transformation occurs (a point to which we
return below) as interdiffusion proceeds, the composition of
the multilayer becomes more uniform and the intensity of the
low-angle peaks decreases.
For the more common case of interdiffusion studied at
constant temperature, the intensity of a low-angle scattering
peak IðtÞ at time t is related to that at initial time t0 by
ln
IðtÞ
Iðt0Þ
 
¼ 
82
n2 ~
D
Dt
2
; ð1Þ
where n is the order of the reflection and ~
D
D is the interdiffu-
sion coefficient (Wang et al., 1999). The bulk interdiffusion
research papers
798 J. P. Liu et al.  X-ray reflectivity measurement of interdiffusion J. Synchrotron Rad. (2017). 24, 796–801
Figure 2
Comparison of reflectivity profiles measured with the in situ apparatus
and a conventional laboratory diffractometer. The intensities have been
normalized to match in the total external reflection region at small q.
Here, and in the other figures, log refers to base-10 logarithm while
ln refers to natural (base e) logarithm
Figure 3
(a) Evolution of the X-ray reflectivity of an Al/Ni multilayer with nominal bilayer period  = 25 nm during heating at 40 K s1
. Each exposure was
100 ms. The inset shows the first low-angle scattering peak in more detail. (b) Evolution of peak intensity, plotted as ln[I(T)/I(473 K)], with time for
determination of ~
D
D.
coefficient ~
D
D can therefore be determined from the slope of a
plot of ln½IðtÞ=Iðt0Þ against t.
There are several issues with applying equation (1) to the
present case. First, our experiments were conducted at
constant heating rate. We make the assumption that because
our heating rates are high and ~
D
D increases exponentially with
temperature, the amount of interdiffusion that occurs at
temperature T over a given interval t is large compared with
the amount of interdiffusion that occurred in heating up to
that temperature. This assumption is easily checked by
comparing the integral of the diffusion equation for constant
heating rate with that for isothermal interdiffusion (given the
activation energy for interdiffusion) (Khawam  Flanagan,
2006). This assumption allows us to recast equation (1) in
terms of temperature and write
ln
IðTÞ
IðT0Þ
 
¼ 
82
n2 ~
D
Dt
2
; ð2Þ
where t is the interval between measurements (100 ms for
the experiments described here). Fig. 3(b) shows a plot of
ln½IðTÞ=IðT0Þ against t, for T0 = 473 K.
Another potential complication in the application of
equation (1) for measuring interdiffusion in multilayers is that
it does not apply to situations in which the concentration
gradients are very steep. As discussed by Greer  Spaepen
(1985), however, this effect is small when the bilayer period
  6d, where d is the atomic spacing parallel to the diffusion
direction. The interplanar spacings of Al and Ni are around
2.0–2.3 Å [for the Ni(111) and Al(111) planes, respectively],
much smaller than the bilayer periods used here (20–30 nm).
Furthermore, the substantial intermixing that occurs during
sputter deposition of Al/Ni multilayers (Gavens et al., 2000)
acts to reduce the concentration gradient. Therefore, equation
(1) can be applied without an explicit correction for the effect
of the concentration gradient.
Fig. 4(a) shows the interdiffusion coefficient ~
D
D as a function
of temperature, determined from the decay of the low-angle
scattering peaks using equation (2), for several combinations
of bilayer period and heating rates. We begin by focusing our
attention on the low-temperature end of Fig. 4(a). If the
evolution of the composition profile is dominated by a single
thermally activated diffusion mechanism, then ~
D
D should
increase exponentially with temperature. To check this,
Fig. 4(b) shows an Arrhenius plot of ln ~
D
D versus 1/T for the
 = 25 nm multilayer heated at 40 K s1
. We see that at the
lowest temperatures the behavior is indeed linear, with an
apparent activation energy for interdiffusion of Ea = 92 
7 kJ mol1
. Data for the  = 30 nm multilayer heated at
200 K s1
yield a similar value, Ea = 80  19 kJ mol1
. We
were not able to extract a reliable activation energy for the
smallest bilayer period ( = 20 nm) due to substantial inter-
diffusion that occurred during heating up to the lowest
temperature at which we could make reliable pyrometer
measurements (475 K).
Du and co-workers (Du et al., 2003) performed a critical
assessment of bulk interdiffusion coefficients in a variety of
systems and reported an activation energy of Ea =
144.6 kJ mol1
for diffusion of Ni in face-centered-cubic Al,
based on indirect observations by Erdélyi and co-workers
(Erdélyi et al., 1978). If we assume that interdiffusion is
dominated by diffusion of nickel [because nickel is known to
be a fast diffuser in aluminium (Edelstein et al., 1994)], as a
rough approximation we may also take this value of activation
energy as representative of interdiffusion. For Ni-rich alloys,
Watanabe and co-workers reported higher activation energies
for interdiffusion, Ea = 214–277 kJ mol1
(Watanabe et al.,
1994). Taken together, this prior work, though limited,
suggests an activation energy for interdiffusion of roughly Ea =
200  50 kJ mol1
.
However, those earlier measurements were from higher
temperatures [742–924 K (Erdélyi et al., 1978) and 1050–
1400 K (Watanabe et al., 1994)] than those we used for our
determination of Ea (Fig. 4b). It is reasonable to suspect that
grain boundary diffusion may dominate at lower tempera-
tures, particularly for our multilayers where the grain size is
research papers
J. Synchrotron Rad. (2017). 24, 796–801 J. P. Liu et al.  X-ray reflectivity measurement of interdiffusion 799
Figure 4
(a) Interdiffusion coefficient ~
D
D for several combinations of bilayer period and heating rate. Labels A, B and C identify the peaks in ~
D
D for the multilayer
with  = 25 nm discussed in the main text and referenced in Fig. 5. The inset shows the data for  = 20 nm in more detail. (b) Arrhenius plot for
determination of activation energy Ea for the  = 25 nm sample from part (a). The fit is to the five data points from the lowest temperature range (485 K
to 530 K).
of the order of a few nanometers. If we assume that this is
the case, and that the activation energy for grain boundary
diffusion is about half that for lattice diffusion [based on an
average value for face-centered-cubic metals (Brown (1980)],
we arrive at a value of around 100  25 kJ mol1
. This is
consistent with recent measurements (at temperatures similar
to ours) by Grieseler and co-workers who reported Ea =
120 kJ mol1
and also assumed a grain boundary diffusion
mechanism (Grieseler et al., 2014). Another point of
comparison is an activation energy for solid-state interdiffu-
sion of 77  1 kJ mol1
calculated by Fritz and co-workers
based on the ignition threshold for self-propagating reactions
in Al/Ni–V multilayers very similar to those considered here
(Fritz et al., 2013). All of these numbers are reasonably
consistent with our measured values of 	90 kJ mol1
.
After this initial stage of interdiffusion during which ~
D
D
increases exponentially with temperature, more complex
behavior is observed at higher temperatures (Fig. 4a). This
complexity presumably results from other processes that also
affect the composition profile of the multilayer. Al/Ni multi-
layers undergo a series of intermetallic formation reactions
with increasing temperature, the details of which depend on
the overall composition, bilayer period and heating rate
(Knepper et al., 2009; Grapes et al., 2014). Activation energies
for phase transformations occurring at constant heating rate
are commonly determined using the Kissinger equation,
ln
_
T
T
Tpeak
!
¼ ln
AR
Ea
 

Ea
RTpeak
; ð3Þ
where _
T
T is the heating rate, Tpeak is the temperature at the
peak maximum in a DSC scan, A is a pre-exponential
constant, R is the gas constant and Ea is the activation energy.
Data drawn from Grapes (2016) for the formation of Al3Ni,
Al3Ni2 and AlNi at various heating rates are shown in Fig. 5.
Also indicated on this plot are the temperatures of the three
peaks in ~
D
D labeled A, B and C in Fig. 4(a) for the  = 25 nm
sample heated at 40 K s1
. Peaks B and C appear at
temperatures close to those expected for the formation of
Al3Ni and Al3Ni2, respectively. The decrease in apparent ~
D
D
above these temperatures may or may not be real. The
intermetallic phases act as diffusion barriers and reduce ~
D
D,
although we note that these phases also have grain boundaries
which would reduce their effectiveness as diffusion barriers.
Alternatively, the formation of the intermetallic phases may
affect the reflectivity pattern in ways that only make it appear
that ~
D
D is decreasing.
Peak A, on the other hand, occurs at a lower temperature
than would be expected for formation of any intermetallic
phase at this heating rate. In our view, this behavior most
likely results from the composition dependence of ~
D
D. In
particular, if grain boundary diffusion dominates at low
temperatures then it may be that the Al grain boundaries
quickly become saturated with Ni, which would slow down
subsequent diffusion.
4. Conclusions
We have demonstrated an X-ray reflectivity technique for
measuring solid-state interdiffusion in multilayer materials
during rapid heating. Here we have demonstrated the tech-
nique at rates of up to 200 K s1
but it could readily be
extended to higher rates. We have, for example, collected
reflectivity patterns with reasonably good signal-to-noise
ratios in as little as 2 ms, implying the ability to collect data at
heating rates as fast as 104
K s1
. More detailed studies, for
example of interlayer roughness, may also be possible from a
more complete consideration of the two-dimensional reflec-
tivity profiles (Fig. 1). This would require careful corrections
for the intensity profile of the incident beam and geometrical
aberrations due to the curved sample (Stoev  Sakurai, 2013),
along with modeling of the specular and diffusion scattering
from the specimens.
Acknowledgements
JK, MZ, LZ, TPW and TCH gratefully acknowledge support
for this work from the US Department of Energy under grant
No. DE-SC002509. JPL gratefully acknowledges financial
support from the Chinese Scholarship Council (CSC). This
work is based upon research conducted at the Cornell High
Energy Synchrotron Source (CHESS) which is supported by
the National Science Foundation and the National Institutes
of Health/National Institute of General Medical Sciences
under NSF award DMR-1332208. Detector development at
Cornell is supported by the DOE Grant No. DE-SC0016035
and CHESS.
References
Brown, A.  Ashby, M. F. (1980). Acta Metall. 28, 1085–1101.
Cook, H. E.  Hilliard, J. E. (1969). J. Appl. Phys. 40, 2191–2198.
research papers
800 J. P. Liu et al.  X-ray reflectivity measurement of interdiffusion J. Synchrotron Rad. (2017). 24, 796–801
Figure 5
Kissinger plots for the formation of the intermetallic phases Al3Ni, Al3Ni2
and AlNi, based on DSC data from Grapes (2016). Points A, B and C
refer to the temperatures at which peaks in ~
D
D occur for the  = 25 nm
sample (Fig. 4a). Joining them is a line indicating a heating rate of
40 K s1
; the arrow indicates the direction of increasing temperature
along this line. At this heating rate, peak B occurs at a temperature close
to that which would be expected for formation of Al3Ni and peak C near
the temperature expected for Al3Ni2.
Du, Y., Chang, Y. A., Huang, B. Y., Gong, W. P., Jin, Z. P., Xu, H. H.,
Yuan, Z. H., Liu, Y., He, Y. H.  Xie, F. Y. (2003). Mater. Sci. Eng.
A, 363, 140–151.
Edelstein, A., Everett, R., Richardson, G., Qadri, S., Altman, E.,
Foley, J.  Perepezko, J. (1994). J. Appl. Phys. 76, 7850–7859.
Erdélyi, G., Beke, D., Kedves, F.  Godeny, I. (1978). Philos. Mag. B,
38, 445–462.
Floro, J., Chason, E.  Lee, S. (1996). MRS Symp. Proc. 406, 491–496.
Fritz, G. M., Spey, S. J., Grapes, M. D.  Weihs, T. P. (2013). J. Appl.
Phys. 113, 014901.
Gavens, A., Van Heerden, D., Mann, A., Reiss, M.  Weihs, T. (2000).
J. Appl. Phys. 87, 1255–1263.
Grapes, M. D. (2016). PhD thesis, Johns Hopkins University, UK.
Grapes, M. D., LaGrange, T., Woll, K., Reed, B. W., Campbell, G. H.,
LaVan, D. A.  Weihs, T. P. (2014). APL Mater. 2, 116102.
Greer, A. L. (1997). Curr. Opin. Solid State Mater. Sci. 2, 300–304.
Greer, A. L.  Spaepen, F. (1985). Synthetic Modulated Structures,
edited by L. L. Chiang and B. C. Giessen, ch. 11, pp. 419–486. New
York: Academic Press.
Grieseler, R., Au, I. S., Kups, T.  Schaaf, P. (2014). Phys. Status Solidi
A, 211, 2635–2644.
Khawam, A.  Flanagan, D. R. (2006). J. Phys. Chem. B, 110, 17315–
17328.
Knepper, R., Snyder, M. R., Fritz, G., Fisher, K., Knio, O. M.  Weihs,
T. P. (2009). J. Appl. Phys. 105, 083504.
Matsushita, T., Niwa, Y., Inada, Y., Nomura, M., Ishii, M., Sakurai, K.
 Arakawa, E. (2008). Appl. Phys. Lett. 92, 024103.
Naudon, A., Chihab, J., Goudeau, P.  Mimault, J. (1989). J. Appl.
Cryst. 22, 460–464.
Neissendorfer, F., Pietsch, U., Brezesinski, G.  Möhwald, H. (1999).
Meas. Sci. Technol. 10, 354–361.
Nicolet, M. A. (1997). Defect Diffusion Forum, 143, 1271–1284.
Niggemeier, U., Lischka, K., Plotz, W. M.  Holy, V. (1997). J. Appl.
Cryst. 30, 905–908.
Paulson, W. M.  Hilliard, J. E. (1977). J. Appl. Phys. 48, 2117–
2123.
Raghavendra Reddy, V., Gupta, A., Gome, A., Leitenberger, W. 
Pietsch, U. (2009). J. Phys. Condens. Matter, 21, 186002.
Stoev, K.  Sakurai, K. (2013). Powder Diffr. 28, 105–111.
Tate, M. W., Chamberlain, D., Green, K. S., Philipp, H. T., Purohit, P.,
Strohman, C.  Gruner, S. M. (2013). J. Phys. Conf. Ser. 425,
062004.
Wang, W. H., Bai, H. Y., Zhang, M., Zhao, J. H., Zhang, X. Y.  Wang,
W. K. (1999). Phys. Rev. B, 59, 10811–10822.
Watanabe, M., Horita, Z., Sano, T.  Nemoto, M. (1994). Acta Metall.
Mater. 42, 3389–3396.
research papers
J. Synchrotron Rad. (2017). 24, 796–801 J. P. Liu et al.  X-ray reflectivity measurement of interdiffusion 801

More Related Content

What's hot

Characterization Of Layered Structures By X Ray Diffraction Techniques
Characterization Of Layered Structures By X Ray Diffraction TechniquesCharacterization Of Layered Structures By X Ray Diffraction Techniques
Characterization Of Layered Structures By X Ray Diffraction Techniquesicernatescu
 
ELECTRICAL AND STRUCTURAL PROPERTIES OF ZnSe THIN FILMS BY ELECTRODEPOSITION ...
ELECTRICAL AND STRUCTURAL PROPERTIES OF ZnSe THIN FILMS BY ELECTRODEPOSITION ...ELECTRICAL AND STRUCTURAL PROPERTIES OF ZnSe THIN FILMS BY ELECTRODEPOSITION ...
ELECTRICAL AND STRUCTURAL PROPERTIES OF ZnSe THIN FILMS BY ELECTRODEPOSITION ...IKHIOYA IMOSOBOMEH LUCKY
 
The Indices of Refraction of Molecular-Beam Epitaxy–Grown BexZn1–xTe Ternary ...
The Indices of Refraction of Molecular-Beam Epitaxy–Grown BexZn1–xTe Ternary ...The Indices of Refraction of Molecular-Beam Epitaxy–Grown BexZn1–xTe Ternary ...
The Indices of Refraction of Molecular-Beam Epitaxy–Grown BexZn1–xTe Ternary ...Oleg Maksimov
 
A Study of Pulse by Pulse Microscale Patch Transfer Using Picosecond Laser
A Study of Pulse by Pulse Microscale Patch Transfer Using Picosecond LaserA Study of Pulse by Pulse Microscale Patch Transfer Using Picosecond Laser
A Study of Pulse by Pulse Microscale Patch Transfer Using Picosecond LaserIJERA Editor
 
Characterization of nanoparticles & its regulatory aspects
Characterization of nanoparticles & its regulatory aspectsCharacterization of nanoparticles & its regulatory aspects
Characterization of nanoparticles & its regulatory aspectsvivek vyas
 
Methods of investigation of structure
Methods of investigation of structureMethods of investigation of structure
Methods of investigation of structureSCE.Surat
 
Phan bo kich thuoc tu pho x ray
Phan bo kich thuoc tu pho x rayPhan bo kich thuoc tu pho x ray
Phan bo kich thuoc tu pho x rayTuấn Trần
 
Different technique for investigation of fiber structure..
Different technique for investigation of fiber structure..Different technique for investigation of fiber structure..
Different technique for investigation of fiber structure..Hasanuzzaman Hasan
 
2011-IPP-CT Data Evaluation of Fibre Reinforced Polymers to Determine Fibre L...
2011-IPP-CT Data Evaluation of Fibre Reinforced Polymers to Determine Fibre L...2011-IPP-CT Data Evaluation of Fibre Reinforced Polymers to Determine Fibre L...
2011-IPP-CT Data Evaluation of Fibre Reinforced Polymers to Determine Fibre L...Kana Arunachalam Kannappan
 
Fibre structure investigation vignan1
Fibre structure  investigation vignan1Fibre structure  investigation vignan1
Fibre structure investigation vignan1Md Vaseem Chavhan
 
1989 optical measurement of the refractive index, layer thickness, and volume...
1989 optical measurement of the refractive index, layer thickness, and volume...1989 optical measurement of the refractive index, layer thickness, and volume...
1989 optical measurement of the refractive index, layer thickness, and volume...pmloscholte
 
Online particle sizing for wet processes
Online particle sizing for wet processesOnline particle sizing for wet processes
Online particle sizing for wet processesTian Lin
 
Terahertz Spectroscopic Analysis and Multispectral Imaging of Epitaxially Gro...
Terahertz Spectroscopic Analysis and Multispectral Imaging of Epitaxially Gro...Terahertz Spectroscopic Analysis and Multispectral Imaging of Epitaxially Gro...
Terahertz Spectroscopic Analysis and Multispectral Imaging of Epitaxially Gro...Applied Research and Photonics, Inc.
 
Effect of Sn Doping on Structural and Electrical Properties of ZnO Thin Films...
Effect of Sn Doping on Structural and Electrical Properties of ZnO Thin Films...Effect of Sn Doping on Structural and Electrical Properties of ZnO Thin Films...
Effect of Sn Doping on Structural and Electrical Properties of ZnO Thin Films...journal ijrtem
 

What's hot (20)

Characterization Of Layered Structures By X Ray Diffraction Techniques
Characterization Of Layered Structures By X Ray Diffraction TechniquesCharacterization Of Layered Structures By X Ray Diffraction Techniques
Characterization Of Layered Structures By X Ray Diffraction Techniques
 
ELECTRICAL AND STRUCTURAL PROPERTIES OF ZnSe THIN FILMS BY ELECTRODEPOSITION ...
ELECTRICAL AND STRUCTURAL PROPERTIES OF ZnSe THIN FILMS BY ELECTRODEPOSITION ...ELECTRICAL AND STRUCTURAL PROPERTIES OF ZnSe THIN FILMS BY ELECTRODEPOSITION ...
ELECTRICAL AND STRUCTURAL PROPERTIES OF ZnSe THIN FILMS BY ELECTRODEPOSITION ...
 
Development of tribological PVD coatings
Development of tribological PVD coatingsDevelopment of tribological PVD coatings
Development of tribological PVD coatings
 
The Indices of Refraction of Molecular-Beam Epitaxy–Grown BexZn1–xTe Ternary ...
The Indices of Refraction of Molecular-Beam Epitaxy–Grown BexZn1–xTe Ternary ...The Indices of Refraction of Molecular-Beam Epitaxy–Grown BexZn1–xTe Ternary ...
The Indices of Refraction of Molecular-Beam Epitaxy–Grown BexZn1–xTe Ternary ...
 
A Study of Pulse by Pulse Microscale Patch Transfer Using Picosecond Laser
A Study of Pulse by Pulse Microscale Patch Transfer Using Picosecond LaserA Study of Pulse by Pulse Microscale Patch Transfer Using Picosecond Laser
A Study of Pulse by Pulse Microscale Patch Transfer Using Picosecond Laser
 
Characterization of nanoparticles & its regulatory aspects
Characterization of nanoparticles & its regulatory aspectsCharacterization of nanoparticles & its regulatory aspects
Characterization of nanoparticles & its regulatory aspects
 
Methods of investigation of structure
Methods of investigation of structureMethods of investigation of structure
Methods of investigation of structure
 
Phan bo kich thuoc tu pho x ray
Phan bo kich thuoc tu pho x rayPhan bo kich thuoc tu pho x ray
Phan bo kich thuoc tu pho x ray
 
Different technique for investigation of fiber structure..
Different technique for investigation of fiber structure..Different technique for investigation of fiber structure..
Different technique for investigation of fiber structure..
 
2011-IPP-CT Data Evaluation of Fibre Reinforced Polymers to Determine Fibre L...
2011-IPP-CT Data Evaluation of Fibre Reinforced Polymers to Determine Fibre L...2011-IPP-CT Data Evaluation of Fibre Reinforced Polymers to Determine Fibre L...
2011-IPP-CT Data Evaluation of Fibre Reinforced Polymers to Determine Fibre L...
 
Thin films seen in the light of high energy synchrotron radiation: stress and...
Thin films seen in the light of high energy synchrotron radiation: stress and...Thin films seen in the light of high energy synchrotron radiation: stress and...
Thin films seen in the light of high energy synchrotron radiation: stress and...
 
Fibre structure investigation vignan1
Fibre structure  investigation vignan1Fibre structure  investigation vignan1
Fibre structure investigation vignan1
 
1989 optical measurement of the refractive index, layer thickness, and volume...
1989 optical measurement of the refractive index, layer thickness, and volume...1989 optical measurement of the refractive index, layer thickness, and volume...
1989 optical measurement of the refractive index, layer thickness, and volume...
 
Online particle sizing for wet processes
Online particle sizing for wet processesOnline particle sizing for wet processes
Online particle sizing for wet processes
 
POSTER_RONAK
POSTER_RONAKPOSTER_RONAK
POSTER_RONAK
 
Terahertz Spectroscopic Analysis and Multispectral Imaging of Epitaxially Gro...
Terahertz Spectroscopic Analysis and Multispectral Imaging of Epitaxially Gro...Terahertz Spectroscopic Analysis and Multispectral Imaging of Epitaxially Gro...
Terahertz Spectroscopic Analysis and Multispectral Imaging of Epitaxially Gro...
 
Pa nalytical pdf
Pa nalytical pdfPa nalytical pdf
Pa nalytical pdf
 
HiPIMS: technology, physics and thin film applications.
HiPIMS: technology, physics and thin film applications.HiPIMS: technology, physics and thin film applications.
HiPIMS: technology, physics and thin film applications.
 
Gixrd
GixrdGixrd
Gixrd
 
Effect of Sn Doping on Structural and Electrical Properties of ZnO Thin Films...
Effect of Sn Doping on Structural and Electrical Properties of ZnO Thin Films...Effect of Sn Doping on Structural and Electrical Properties of ZnO Thin Films...
Effect of Sn Doping on Structural and Electrical Properties of ZnO Thin Films...
 

Similar to 1426777

1996 strain in nanoscale germanium hut clusters on si(001) studied by x ray d...
1996 strain in nanoscale germanium hut clusters on si(001) studied by x ray d...1996 strain in nanoscale germanium hut clusters on si(001) studied by x ray d...
1996 strain in nanoscale germanium hut clusters on si(001) studied by x ray d...pmloscholte
 
Non-parabolicity and band gap renormalisation in Si doped ZnO
Non-parabolicity and band gap renormalisation in Si doped ZnONon-parabolicity and band gap renormalisation in Si doped ZnO
Non-parabolicity and band gap renormalisation in Si doped ZnOUniversity of Liverpool
 
Effective Density of Lunar Cores
Effective Density of Lunar CoresEffective Density of Lunar Cores
Effective Density of Lunar CoresRobert West
 
ELECTRICAL AND STRUCTURAL PROPERTIES OF ZnSe THIN FILMS BY ELECTRODEPOSITION ...
ELECTRICAL AND STRUCTURAL PROPERTIES OF ZnSe THIN FILMS BY ELECTRODEPOSITION ...ELECTRICAL AND STRUCTURAL PROPERTIES OF ZnSe THIN FILMS BY ELECTRODEPOSITION ...
ELECTRICAL AND STRUCTURAL PROPERTIES OF ZnSe THIN FILMS BY ELECTRODEPOSITION ...IKHIOYA IMOSOBOMEH LUCKY
 
Ringed structure and_a_gap_at_1_au_in_the_nearest_protoplanetary_disk
Ringed structure and_a_gap_at_1_au_in_the_nearest_protoplanetary_diskRinged structure and_a_gap_at_1_au_in_the_nearest_protoplanetary_disk
Ringed structure and_a_gap_at_1_au_in_the_nearest_protoplanetary_diskSérgio Sacani
 
Electron Diffraction Using Transmission Electron Microscopy
Electron Diffraction Using Transmission Electron MicroscopyElectron Diffraction Using Transmission Electron Microscopy
Electron Diffraction Using Transmission Electron MicroscopyLe Scienze Web News
 
fw1728_Final Year Project Report Submission
fw1728_Final Year Project Report Submissionfw1728_Final Year Project Report Submission
fw1728_Final Year Project Report SubmissionFreddy White
 
BettySlamaPRE2011
BettySlamaPRE2011BettySlamaPRE2011
BettySlamaPRE2011Betty Slama
 
Detection of Low-Speed Layer (Lvl) In Seismic Refraction Survey Using Combine...
Detection of Low-Speed Layer (Lvl) In Seismic Refraction Survey Using Combine...Detection of Low-Speed Layer (Lvl) In Seismic Refraction Survey Using Combine...
Detection of Low-Speed Layer (Lvl) In Seismic Refraction Survey Using Combine...iosrjce
 
H021201058064
H021201058064H021201058064
H021201058064theijes
 
XrayStress&CapillaryOptics_Janting
XrayStress&CapillaryOptics_JantingXrayStress&CapillaryOptics_Janting
XrayStress&CapillaryOptics_JantingJakob Janting
 
Analysis and simulations of optimal geometry shapes of the 4 and 9 nano hole ...
Analysis and simulations of optimal geometry shapes of the 4 and 9 nano hole ...Analysis and simulations of optimal geometry shapes of the 4 and 9 nano hole ...
Analysis and simulations of optimal geometry shapes of the 4 and 9 nano hole ...IJECEIAES
 
STM Observation of the Si(111) - (7×7) Reconstructed Surface Modified by Exce...
STM Observation of the Si(111) - (7×7) Reconstructed Surface Modified by Exce...STM Observation of the Si(111) - (7×7) Reconstructed Surface Modified by Exce...
STM Observation of the Si(111) - (7×7) Reconstructed Surface Modified by Exce...IJECEIAES
 
Annealing and Microstructural Characterization of Tin-Oxide Based Thick Film ...
Annealing and Microstructural Characterization of Tin-Oxide Based Thick Film ...Annealing and Microstructural Characterization of Tin-Oxide Based Thick Film ...
Annealing and Microstructural Characterization of Tin-Oxide Based Thick Film ...Anis Rahman
 
ConorWilman_Manchester_Investigation of an effective low-cost THz TDS system
ConorWilman_Manchester_Investigation of an effective low-cost THz TDS systemConorWilman_Manchester_Investigation of an effective low-cost THz TDS system
ConorWilman_Manchester_Investigation of an effective low-cost THz TDS systemConor Wilman
 

Similar to 1426777 (20)

1996 strain in nanoscale germanium hut clusters on si(001) studied by x ray d...
1996 strain in nanoscale germanium hut clusters on si(001) studied by x ray d...1996 strain in nanoscale germanium hut clusters on si(001) studied by x ray d...
1996 strain in nanoscale germanium hut clusters on si(001) studied by x ray d...
 
Non-parabolicity and band gap renormalisation in Si doped ZnO
Non-parabolicity and band gap renormalisation in Si doped ZnONon-parabolicity and band gap renormalisation in Si doped ZnO
Non-parabolicity and band gap renormalisation in Si doped ZnO
 
DissertationDefense
DissertationDefenseDissertationDefense
DissertationDefense
 
THz Plasmonics
THz PlasmonicsTHz Plasmonics
THz Plasmonics
 
Effective Density of Lunar Cores
Effective Density of Lunar CoresEffective Density of Lunar Cores
Effective Density of Lunar Cores
 
ELECTRICAL AND STRUCTURAL PROPERTIES OF ZnSe THIN FILMS BY ELECTRODEPOSITION ...
ELECTRICAL AND STRUCTURAL PROPERTIES OF ZnSe THIN FILMS BY ELECTRODEPOSITION ...ELECTRICAL AND STRUCTURAL PROPERTIES OF ZnSe THIN FILMS BY ELECTRODEPOSITION ...
ELECTRICAL AND STRUCTURAL PROPERTIES OF ZnSe THIN FILMS BY ELECTRODEPOSITION ...
 
Ringed structure and_a_gap_at_1_au_in_the_nearest_protoplanetary_disk
Ringed structure and_a_gap_at_1_au_in_the_nearest_protoplanetary_diskRinged structure and_a_gap_at_1_au_in_the_nearest_protoplanetary_disk
Ringed structure and_a_gap_at_1_au_in_the_nearest_protoplanetary_disk
 
Electron Diffraction Using Transmission Electron Microscopy
Electron Diffraction Using Transmission Electron MicroscopyElectron Diffraction Using Transmission Electron Microscopy
Electron Diffraction Using Transmission Electron Microscopy
 
fw1728_Final Year Project Report Submission
fw1728_Final Year Project Report Submissionfw1728_Final Year Project Report Submission
fw1728_Final Year Project Report Submission
 
BettySlamaPRE2011
BettySlamaPRE2011BettySlamaPRE2011
BettySlamaPRE2011
 
Detection of Low-Speed Layer (Lvl) In Seismic Refraction Survey Using Combine...
Detection of Low-Speed Layer (Lvl) In Seismic Refraction Survey Using Combine...Detection of Low-Speed Layer (Lvl) In Seismic Refraction Survey Using Combine...
Detection of Low-Speed Layer (Lvl) In Seismic Refraction Survey Using Combine...
 
H021201058064
H021201058064H021201058064
H021201058064
 
Nano group 9.pdf
Nano group 9.pdfNano group 9.pdf
Nano group 9.pdf
 
paper
paperpaper
paper
 
XrayStress&CapillaryOptics_Janting
XrayStress&CapillaryOptics_JantingXrayStress&CapillaryOptics_Janting
XrayStress&CapillaryOptics_Janting
 
Analysis and simulations of optimal geometry shapes of the 4 and 9 nano hole ...
Analysis and simulations of optimal geometry shapes of the 4 and 9 nano hole ...Analysis and simulations of optimal geometry shapes of the 4 and 9 nano hole ...
Analysis and simulations of optimal geometry shapes of the 4 and 9 nano hole ...
 
OpticsExpress_Afshin
OpticsExpress_AfshinOpticsExpress_Afshin
OpticsExpress_Afshin
 
STM Observation of the Si(111) - (7×7) Reconstructed Surface Modified by Exce...
STM Observation of the Si(111) - (7×7) Reconstructed Surface Modified by Exce...STM Observation of the Si(111) - (7×7) Reconstructed Surface Modified by Exce...
STM Observation of the Si(111) - (7×7) Reconstructed Surface Modified by Exce...
 
Annealing and Microstructural Characterization of Tin-Oxide Based Thick Film ...
Annealing and Microstructural Characterization of Tin-Oxide Based Thick Film ...Annealing and Microstructural Characterization of Tin-Oxide Based Thick Film ...
Annealing and Microstructural Characterization of Tin-Oxide Based Thick Film ...
 
ConorWilman_Manchester_Investigation of an effective low-cost THz TDS system
ConorWilman_Manchester_Investigation of an effective low-cost THz TDS systemConorWilman_Manchester_Investigation of an effective low-cost THz TDS system
ConorWilman_Manchester_Investigation of an effective low-cost THz TDS system
 

Recently uploaded

Software and Systems Engineering Standards: Verification and Validation of Sy...
Software and Systems Engineering Standards: Verification and Validation of Sy...Software and Systems Engineering Standards: Verification and Validation of Sy...
Software and Systems Engineering Standards: Verification and Validation of Sy...VICTOR MAESTRE RAMIREZ
 
An introduction to Semiconductor and its types.pptx
An introduction to Semiconductor and its types.pptxAn introduction to Semiconductor and its types.pptx
An introduction to Semiconductor and its types.pptxPurva Nikam
 
CCS355 Neural Network & Deep Learning UNIT III notes and Question bank .pdf
CCS355 Neural Network & Deep Learning UNIT III notes and Question bank .pdfCCS355 Neural Network & Deep Learning UNIT III notes and Question bank .pdf
CCS355 Neural Network & Deep Learning UNIT III notes and Question bank .pdfAsst.prof M.Gokilavani
 
8251 universal synchronous asynchronous receiver transmitter
8251 universal synchronous asynchronous receiver transmitter8251 universal synchronous asynchronous receiver transmitter
8251 universal synchronous asynchronous receiver transmitterShivangiSharma879191
 
What are the advantages and disadvantages of membrane structures.pptx
What are the advantages and disadvantages of membrane structures.pptxWhat are the advantages and disadvantages of membrane structures.pptx
What are the advantages and disadvantages of membrane structures.pptxwendy cai
 
Comparative Analysis of Text Summarization Techniques
Comparative Analysis of Text Summarization TechniquesComparative Analysis of Text Summarization Techniques
Comparative Analysis of Text Summarization Techniquesugginaramesh
 
complete construction, environmental and economics information of biomass com...
complete construction, environmental and economics information of biomass com...complete construction, environmental and economics information of biomass com...
complete construction, environmental and economics information of biomass com...asadnawaz62
 
Concrete Mix Design - IS 10262-2019 - .pptx
Concrete Mix Design - IS 10262-2019 - .pptxConcrete Mix Design - IS 10262-2019 - .pptx
Concrete Mix Design - IS 10262-2019 - .pptxKartikeyaDwivedi3
 
Churning of Butter, Factors affecting .
Churning of Butter, Factors affecting  .Churning of Butter, Factors affecting  .
Churning of Butter, Factors affecting .Satyam Kumar
 
Call Girls Narol 7397865700 Independent Call Girls
Call Girls Narol 7397865700 Independent Call GirlsCall Girls Narol 7397865700 Independent Call Girls
Call Girls Narol 7397865700 Independent Call Girlsssuser7cb4ff
 
Instrumentation, measurement and control of bio process parameters ( Temperat...
Instrumentation, measurement and control of bio process parameters ( Temperat...Instrumentation, measurement and control of bio process parameters ( Temperat...
Instrumentation, measurement and control of bio process parameters ( Temperat...121011101441
 
IVE Industry Focused Event - Defence Sector 2024
IVE Industry Focused Event - Defence Sector 2024IVE Industry Focused Event - Defence Sector 2024
IVE Industry Focused Event - Defence Sector 2024Mark Billinghurst
 
An experimental study in using natural admixture as an alternative for chemic...
An experimental study in using natural admixture as an alternative for chemic...An experimental study in using natural admixture as an alternative for chemic...
An experimental study in using natural admixture as an alternative for chemic...Chandu841456
 
CCS355 Neural Networks & Deep Learning Unit 1 PDF notes with Question bank .pdf
CCS355 Neural Networks & Deep Learning Unit 1 PDF notes with Question bank .pdfCCS355 Neural Networks & Deep Learning Unit 1 PDF notes with Question bank .pdf
CCS355 Neural Networks & Deep Learning Unit 1 PDF notes with Question bank .pdfAsst.prof M.Gokilavani
 
CCS355 Neural Network & Deep Learning Unit II Notes with Question bank .pdf
CCS355 Neural Network & Deep Learning Unit II Notes with Question bank .pdfCCS355 Neural Network & Deep Learning Unit II Notes with Question bank .pdf
CCS355 Neural Network & Deep Learning Unit II Notes with Question bank .pdfAsst.prof M.Gokilavani
 
main PPT.pptx of girls hostel security using rfid
main PPT.pptx of girls hostel security using rfidmain PPT.pptx of girls hostel security using rfid
main PPT.pptx of girls hostel security using rfidNikhilNagaraju
 

Recently uploaded (20)

Software and Systems Engineering Standards: Verification and Validation of Sy...
Software and Systems Engineering Standards: Verification and Validation of Sy...Software and Systems Engineering Standards: Verification and Validation of Sy...
Software and Systems Engineering Standards: Verification and Validation of Sy...
 
An introduction to Semiconductor and its types.pptx
An introduction to Semiconductor and its types.pptxAn introduction to Semiconductor and its types.pptx
An introduction to Semiconductor and its types.pptx
 
CCS355 Neural Network & Deep Learning UNIT III notes and Question bank .pdf
CCS355 Neural Network & Deep Learning UNIT III notes and Question bank .pdfCCS355 Neural Network & Deep Learning UNIT III notes and Question bank .pdf
CCS355 Neural Network & Deep Learning UNIT III notes and Question bank .pdf
 
8251 universal synchronous asynchronous receiver transmitter
8251 universal synchronous asynchronous receiver transmitter8251 universal synchronous asynchronous receiver transmitter
8251 universal synchronous asynchronous receiver transmitter
 
🔝9953056974🔝!!-YOUNG call girls in Rajendra Nagar Escort rvice Shot 2000 nigh...
🔝9953056974🔝!!-YOUNG call girls in Rajendra Nagar Escort rvice Shot 2000 nigh...🔝9953056974🔝!!-YOUNG call girls in Rajendra Nagar Escort rvice Shot 2000 nigh...
🔝9953056974🔝!!-YOUNG call girls in Rajendra Nagar Escort rvice Shot 2000 nigh...
 
What are the advantages and disadvantages of membrane structures.pptx
What are the advantages and disadvantages of membrane structures.pptxWhat are the advantages and disadvantages of membrane structures.pptx
What are the advantages and disadvantages of membrane structures.pptx
 
Comparative Analysis of Text Summarization Techniques
Comparative Analysis of Text Summarization TechniquesComparative Analysis of Text Summarization Techniques
Comparative Analysis of Text Summarization Techniques
 
complete construction, environmental and economics information of biomass com...
complete construction, environmental and economics information of biomass com...complete construction, environmental and economics information of biomass com...
complete construction, environmental and economics information of biomass com...
 
Concrete Mix Design - IS 10262-2019 - .pptx
Concrete Mix Design - IS 10262-2019 - .pptxConcrete Mix Design - IS 10262-2019 - .pptx
Concrete Mix Design - IS 10262-2019 - .pptx
 
Churning of Butter, Factors affecting .
Churning of Butter, Factors affecting  .Churning of Butter, Factors affecting  .
Churning of Butter, Factors affecting .
 
Call Girls Narol 7397865700 Independent Call Girls
Call Girls Narol 7397865700 Independent Call GirlsCall Girls Narol 7397865700 Independent Call Girls
Call Girls Narol 7397865700 Independent Call Girls
 
Exploring_Network_Security_with_JA3_by_Rakesh Seal.pptx
Exploring_Network_Security_with_JA3_by_Rakesh Seal.pptxExploring_Network_Security_with_JA3_by_Rakesh Seal.pptx
Exploring_Network_Security_with_JA3_by_Rakesh Seal.pptx
 
Instrumentation, measurement and control of bio process parameters ( Temperat...
Instrumentation, measurement and control of bio process parameters ( Temperat...Instrumentation, measurement and control of bio process parameters ( Temperat...
Instrumentation, measurement and control of bio process parameters ( Temperat...
 
Design and analysis of solar grass cutter.pdf
Design and analysis of solar grass cutter.pdfDesign and analysis of solar grass cutter.pdf
Design and analysis of solar grass cutter.pdf
 
IVE Industry Focused Event - Defence Sector 2024
IVE Industry Focused Event - Defence Sector 2024IVE Industry Focused Event - Defence Sector 2024
IVE Industry Focused Event - Defence Sector 2024
 
An experimental study in using natural admixture as an alternative for chemic...
An experimental study in using natural admixture as an alternative for chemic...An experimental study in using natural admixture as an alternative for chemic...
An experimental study in using natural admixture as an alternative for chemic...
 
CCS355 Neural Networks & Deep Learning Unit 1 PDF notes with Question bank .pdf
CCS355 Neural Networks & Deep Learning Unit 1 PDF notes with Question bank .pdfCCS355 Neural Networks & Deep Learning Unit 1 PDF notes with Question bank .pdf
CCS355 Neural Networks & Deep Learning Unit 1 PDF notes with Question bank .pdf
 
CCS355 Neural Network & Deep Learning Unit II Notes with Question bank .pdf
CCS355 Neural Network & Deep Learning Unit II Notes with Question bank .pdfCCS355 Neural Network & Deep Learning Unit II Notes with Question bank .pdf
CCS355 Neural Network & Deep Learning Unit II Notes with Question bank .pdf
 
young call girls in Rajiv Chowk🔝 9953056974 🔝 Delhi escort Service
young call girls in Rajiv Chowk🔝 9953056974 🔝 Delhi escort Serviceyoung call girls in Rajiv Chowk🔝 9953056974 🔝 Delhi escort Service
young call girls in Rajiv Chowk🔝 9953056974 🔝 Delhi escort Service
 
main PPT.pptx of girls hostel security using rfid
main PPT.pptx of girls hostel security using rfidmain PPT.pptx of girls hostel security using rfid
main PPT.pptx of girls hostel security using rfid
 

1426777

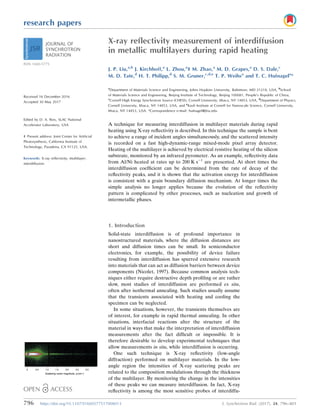
  • 1. research papers 796 https://doi.org/10.1107/S1600577517008013 J. Synchrotron Rad. (2017). 24, 796–801 Received 16 December 2016 Accepted 30 May 2017 Edited by D. A. Reis, SLAC National Accelerator Laboratory, USA ‡ Present address: Joint Center for Artificial Photosynthesis, California Institute of Technology, Pasadena, CA 91125, USA. Keywords: X-ray reflectivity; multilayer; interdiffusion. X-ray reflectivity measurement of interdiffusion in metallic multilayers during rapid heating J. P. Liu,a,b J. Kirchhoff,a L. Zhou,a ‡ M. Zhao,a M. D. Grapes,a D. S. Dale,c M. D. Tate,d H. T. Philipp,d S. M. Gruner,c,d,e T. P. Weihsa and T. C. Hufnagela * a Department of Materials Science and Engineering, Johns Hopkins University, Baltimore, MD 21218, USA, b School of Materials Science and Engineering, Beijing Institute of Technology, Beijing 100081, People’s Republic of China, c Cornell High Energy Synchrotron Source (CHESS), Cornell University, Ithaca, NY 14853, USA, d Department of Physics, Cornell University, Ithaca, NY 14853, USA, and e Kavli Institute at Cornell for Nanoscale Science, Cornell University, Ithaca, NY 14853, USA. *Correspondence e-mail: hufnagel@jhu.edu A technique for measuring interdiffusion in multilayer materials during rapid heating using X-ray reflectivity is described. In this technique the sample is bent to achieve a range of incident angles simultaneously, and the scattered intensity is recorded on a fast high-dynamic-range mixed-mode pixel array detector. Heating of the multilayer is achieved by electrical resistive heating of the silicon substrate, monitored by an infrared pyrometer. As an example, reflectivity data from Al/Ni heated at rates up to 200 K s1 are presented. At short times the interdiffusion coefficient can be determined from the rate of decay of the reflectivity peaks, and it is shown that the activation energy for interdiffusion is consistent with a grain boundary diffusion mechanism. At longer times the simple analysis no longer applies because the evolution of the reflectivity pattern is complicated by other processes, such as nucleation and growth of intermetallic phases. 1. Introduction Solid-state interdiffusion is of profound importance in nanostructured materials, where the diffusion distances are short and diffusion times can be small. In semiconductor electronics, for example, the possibility of device failure resulting from interdiffusion has spurred extensive research into materials that can act as diffusion barriers between device components (Nicolet, 1997). Because common analysis tech- niques either require destructive depth profiling or are rather slow, most studies of interdiffusion are performed ex situ, often after isothermal annealing. Such studies usually assume that the transients associated with heating and cooling the specimen can be neglected. In some situations, however, the transients themselves are of interest, for example in rapid thermal annealing. In other situations, interfacial reactions alter the structure of the material in ways that make the interpretation of interdiffusion measurements after the fact difficult or impossible. It is therefore desirable to develop experimental techniques that allow measurements in situ, while interdiffusion is occurring. One such technique is X-ray reflectivity (low-angle diffraction) performed on multilayer materials. In the low- angle region the intensities of X-ray scattering peaks are related to the composition modulations through the thickness of the multilayer. By monitoring the change in the intensities of these peaks we can measure interdiffusion. In fact, X-ray reflectivity is among the most sensitive probes of interdiffu- ISSN 1600-5775
  • 2. sion, capable of measuring interdiffusion coefficients as low as 1027 m2 s1 (Greer, 1997). In a conventional X-ray reflectivity measurement the scat- tered intensity is recorded by step-scanning through a range of angles. This makes in situ observations impractical except for slow processes. To overcome this limitation, several techni- ques have been developed for recording complete reflectivity patterns simultaneously. For example, using a curved specimen one can record the scattering over a range of angles simulta- neously using a position-sensitive X-ray detector (Naudon et al., 1989; Niggemeier et al., 1997; Stoev Sakurai, 2013). Another approach is to use an X-ray beam with a range of wavelengths, either by dispersing the X-ray beam into a range of angles (Matsushita et al., 2008) (again using a position- sensitive detector) or, at a single angle, recording scattering with an energy-sensitive detector (Neissendorfer et al., 1999; Raghavendra Reddy et al., 2009). In this paper we show how to use the curved-sample approach to perform time-resolved in situ X-ray reflectivity characterization of the initial stages of interdiffusion during continuous heating of metallic multilayers. We have tested our technique at heating rates up to 200 K s1 , but in principle it can be applied at much higher rates, limited by the intensity of the X-ray source and the capabilities of the X-ray detector. During the initial stages of heating we can determine the interdiffusion coefficient ~ D D by a simple analysis of the rate of decay of the peaks in the reflectivity pattern, which are related to the composition modulation of the multilayer. At longer times this simple analysis becomes unreliable because the reflectivity pattern is affected by other processes, such as nucleation and growth of intermetallic phases. 2. Experimental The samples for this study were multilayer foils produced by DC magnetron sputtering alternating layers of alluminum alloy 1100 with layers of nickel–7 wt% vanadium. The ratio of the Al layer thickness to the Ni–V layer thickness was 3:2, which yields an atomic ratio of Al:Ni–V of 1:1. The bilayer period of the layers (i.e. the sum of one Al and one Ni–V layer thickness) was 20–30 nm. Because X-ray reflectivity is strongly sensitive to the roughness of the layers and the roughness increases with the number of layers deposited, we restricted the thickness of our samples to three to six bilayer periods (Al/Ni layer pairs). The multilayers were deposited onto 500 mm-thick polished Si wafers, onto which we also deposited 300 nm-thick gold pads by thermal evaporation (Fig. 1a). (A 20 nm-thick layer of tungsten was deposited first to promote adhesion of the gold to the silicon substrate.) The gold pads provided electrical contacts to permit resistive heating of the doped Si substrate, which in turn heated the multilayer. The power source for these experiments was a series array of 9 Vor 12 V batteries, switched with a solid-state relay to allow control of the duration of the current pulse. We monitored the temperature of the multilayer during heating with a single-wavelength infrared pyrometer (Kleiber KGA 740-LO), sampling at 50 Hz. The lowest temperature that can be measured with this pyrometer is 475 K, so we were unable to use it to track the very earliest stages of heating. Angle-dispersive X-ray reflectivity uses curved specimens so that the angle of incidence of X-rays on the surface varies with position, as shown in Fig. 1(b). Although multilayers can be deposited on curved substrates, we elected instead to use flat substrates which we then bent in a specially designed loading fixture. Pragmatically, flat substrates are cheaper than precisely polished curved substrates, and it is easier to deposit uniform multilayers on them. This approach also allows flex- ibility in choosing the radius of curvature (and thus the range of angles over which the reflectivity is measured). Our four- point bending apparatus is illustrated in Fig. 1(b). The two lower loading rods are fixed in position, and bending is achieved by using stepper motors to displace the two upper rods. Gaps in the upper rods (not shown) provide a clear path for the X-rays, and the rods (which are made of steel) are electrically isolated from the substrate by kapton tape. Prior to each reflectivity measurement we measured the curvature of the specimen by means of a parallel-beam curvature setup similar to that described by Floro et al. (1996). The experiments described here were performed at station A2 of the Cornell High Energy Synchrotron Source (CHESS) using a Si(111) double-crystal monochromator to select 12.0 keV X-rays, with a flux of approximately 5 1010 photons s1 mm2 . The beam height (0.3 mm) yielded a range of incident angles from zero to approximately 1.3 , depending on the radius of curvature of the specimen (typically about research papers J. Synchrotron Rad. (2017). 24, 796–801 J. P. Liu et al. X-ray reflectivity measurement of interdiffusion 797 Figure 1 (a) The samples had lithographically patterned regions of Al/Ni multilayer (4 cm long by 1 cm wide) along with gold pads (0.5 cm by 1 cm) to act as electrical contacts. (b) The samples were dynamically bent in a four-point loading apparatus, with the curvature of the specimen measured by a laser wafer-curvature technique and temperature monitored by an optical pyrometer. (c) Example raw data from a 3 1 section of chips on the MMPAD array.
  • 3. 500 mm). The X-ray detector was a mixed-mode pixel array detector (MMPAD), which is capable of framing continuously at high rates (up to 1 kHz) and has a large dynamic range (4 107 photons pixel1 ) (Tate et al., 2013). The dynamic range is useful because it allows both the low- and high-order scattering peaks, which can differ in intensity by many orders of magnitude, to be measured simultaneously. The detector used here employed a 3 2 array of MMPAD chips (with each chip having a square 128 128 array of 150 mm pixels) although only a single row of three chips was used for these measurements (Fig. 1c). With this detector placed 1013 mm from the sample we recorded scattering over a range of scat- tering vectors (q = 4 sin =, where is one-half of the scattering angle and is the X-ray wavelength) of about 3 nm1 . The width of the X-ray beam was 1 mm, and the one- dimensional reflectivity patterns shown below were obtained by simply summing the output from the detector across the width of the beam at each row of pixels corresponding to a given value of q. Fig. 2 shows X-ray reflectivity data from an Al/Ni multilayer sample with a nominal bilayer period of = 20 nm, recorded two ways: using the apparatus described above, and on a conventional parallel-beam diffractometer (Philips MRD) using Cu K radiation with the sample nominally flat. Although the basic features of the laboratory reflectivity data are reproduced in the in situ synchrotron experiment, the agreement is not perfect. There are several reasons for this. First, the in situ technique records some non-specular scat- tering (incident 6¼ exit) in addition to the desired specular scattering (incident = exit). Second, there is variation in the incident intensity in the in situ case due to the intensity profile along the height of the synchrotron beam. Third, no attempt has been made to correct for geometrical aberrations such as anticlastic bending of the substrate. Finally, the energy band- pass and the angular divergence of the X-ray beam are different between the two cases. Despite these differences the two reflectivity profiles are in reasonably good agreement. Both profiles show an intensity plateau below about q = 0.4 nm1 which is due to total external reflection of X-rays from the multilayer. Above this, both profiles show a series of low-angle scattering peaks from the multilayer structure. 3. Results and discusson Fig. 3(a) shows reflectivity data from an Al/Ni multilayer recorded in situ during heating at 40 K s1 . The intensity of the first peak (shown in the inset) decreases with increasing temperature. The amplitudes of the peaks in the low-angle region are proportional to the square of the amplitude of the composition modulation (Cook, 1969; Paulson Hilliard, 1977). If no phase transformation occurs (a point to which we return below) as interdiffusion proceeds, the composition of the multilayer becomes more uniform and the intensity of the low-angle peaks decreases. For the more common case of interdiffusion studied at constant temperature, the intensity of a low-angle scattering peak IðtÞ at time t is related to that at initial time t0 by ln IðtÞ Iðt0Þ ¼ 82 n2 ~ D Dt 2 ; ð1Þ where n is the order of the reflection and ~ D D is the interdiffu- sion coefficient (Wang et al., 1999). The bulk interdiffusion research papers 798 J. P. Liu et al. X-ray reflectivity measurement of interdiffusion J. Synchrotron Rad. (2017). 24, 796–801 Figure 2 Comparison of reflectivity profiles measured with the in situ apparatus and a conventional laboratory diffractometer. The intensities have been normalized to match in the total external reflection region at small q. Here, and in the other figures, log refers to base-10 logarithm while ln refers to natural (base e) logarithm Figure 3 (a) Evolution of the X-ray reflectivity of an Al/Ni multilayer with nominal bilayer period = 25 nm during heating at 40 K s1 . Each exposure was 100 ms. The inset shows the first low-angle scattering peak in more detail. (b) Evolution of peak intensity, plotted as ln[I(T)/I(473 K)], with time for determination of ~ D D.
  • 4. coefficient ~ D D can therefore be determined from the slope of a plot of ln½IðtÞ=Iðt0Þ against t. There are several issues with applying equation (1) to the present case. First, our experiments were conducted at constant heating rate. We make the assumption that because our heating rates are high and ~ D D increases exponentially with temperature, the amount of interdiffusion that occurs at temperature T over a given interval t is large compared with the amount of interdiffusion that occurred in heating up to that temperature. This assumption is easily checked by comparing the integral of the diffusion equation for constant heating rate with that for isothermal interdiffusion (given the activation energy for interdiffusion) (Khawam Flanagan, 2006). This assumption allows us to recast equation (1) in terms of temperature and write ln IðTÞ IðT0Þ ¼ 82 n2 ~ D Dt 2 ; ð2Þ where t is the interval between measurements (100 ms for the experiments described here). Fig. 3(b) shows a plot of ln½IðTÞ=IðT0Þ against t, for T0 = 473 K. Another potential complication in the application of equation (1) for measuring interdiffusion in multilayers is that it does not apply to situations in which the concentration gradients are very steep. As discussed by Greer Spaepen (1985), however, this effect is small when the bilayer period 6d, where d is the atomic spacing parallel to the diffusion direction. The interplanar spacings of Al and Ni are around 2.0–2.3 Å [for the Ni(111) and Al(111) planes, respectively], much smaller than the bilayer periods used here (20–30 nm). Furthermore, the substantial intermixing that occurs during sputter deposition of Al/Ni multilayers (Gavens et al., 2000) acts to reduce the concentration gradient. Therefore, equation (1) can be applied without an explicit correction for the effect of the concentration gradient. Fig. 4(a) shows the interdiffusion coefficient ~ D D as a function of temperature, determined from the decay of the low-angle scattering peaks using equation (2), for several combinations of bilayer period and heating rates. We begin by focusing our attention on the low-temperature end of Fig. 4(a). If the evolution of the composition profile is dominated by a single thermally activated diffusion mechanism, then ~ D D should increase exponentially with temperature. To check this, Fig. 4(b) shows an Arrhenius plot of ln ~ D D versus 1/T for the = 25 nm multilayer heated at 40 K s1 . We see that at the lowest temperatures the behavior is indeed linear, with an apparent activation energy for interdiffusion of Ea = 92 7 kJ mol1 . Data for the = 30 nm multilayer heated at 200 K s1 yield a similar value, Ea = 80 19 kJ mol1 . We were not able to extract a reliable activation energy for the smallest bilayer period ( = 20 nm) due to substantial inter- diffusion that occurred during heating up to the lowest temperature at which we could make reliable pyrometer measurements (475 K). Du and co-workers (Du et al., 2003) performed a critical assessment of bulk interdiffusion coefficients in a variety of systems and reported an activation energy of Ea = 144.6 kJ mol1 for diffusion of Ni in face-centered-cubic Al, based on indirect observations by Erdélyi and co-workers (Erdélyi et al., 1978). If we assume that interdiffusion is dominated by diffusion of nickel [because nickel is known to be a fast diffuser in aluminium (Edelstein et al., 1994)], as a rough approximation we may also take this value of activation energy as representative of interdiffusion. For Ni-rich alloys, Watanabe and co-workers reported higher activation energies for interdiffusion, Ea = 214–277 kJ mol1 (Watanabe et al., 1994). Taken together, this prior work, though limited, suggests an activation energy for interdiffusion of roughly Ea = 200 50 kJ mol1 . However, those earlier measurements were from higher temperatures [742–924 K (Erdélyi et al., 1978) and 1050– 1400 K (Watanabe et al., 1994)] than those we used for our determination of Ea (Fig. 4b). It is reasonable to suspect that grain boundary diffusion may dominate at lower tempera- tures, particularly for our multilayers where the grain size is research papers J. Synchrotron Rad. (2017). 24, 796–801 J. P. Liu et al. X-ray reflectivity measurement of interdiffusion 799 Figure 4 (a) Interdiffusion coefficient ~ D D for several combinations of bilayer period and heating rate. Labels A, B and C identify the peaks in ~ D D for the multilayer with = 25 nm discussed in the main text and referenced in Fig. 5. The inset shows the data for = 20 nm in more detail. (b) Arrhenius plot for determination of activation energy Ea for the = 25 nm sample from part (a). The fit is to the five data points from the lowest temperature range (485 K to 530 K).
  • 5. of the order of a few nanometers. If we assume that this is the case, and that the activation energy for grain boundary diffusion is about half that for lattice diffusion [based on an average value for face-centered-cubic metals (Brown (1980)], we arrive at a value of around 100 25 kJ mol1 . This is consistent with recent measurements (at temperatures similar to ours) by Grieseler and co-workers who reported Ea = 120 kJ mol1 and also assumed a grain boundary diffusion mechanism (Grieseler et al., 2014). Another point of comparison is an activation energy for solid-state interdiffu- sion of 77 1 kJ mol1 calculated by Fritz and co-workers based on the ignition threshold for self-propagating reactions in Al/Ni–V multilayers very similar to those considered here (Fritz et al., 2013). All of these numbers are reasonably consistent with our measured values of 90 kJ mol1 . After this initial stage of interdiffusion during which ~ D D increases exponentially with temperature, more complex behavior is observed at higher temperatures (Fig. 4a). This complexity presumably results from other processes that also affect the composition profile of the multilayer. Al/Ni multi- layers undergo a series of intermetallic formation reactions with increasing temperature, the details of which depend on the overall composition, bilayer period and heating rate (Knepper et al., 2009; Grapes et al., 2014). Activation energies for phase transformations occurring at constant heating rate are commonly determined using the Kissinger equation, ln _ T T Tpeak ! ¼ ln AR Ea Ea RTpeak ; ð3Þ where _ T T is the heating rate, Tpeak is the temperature at the peak maximum in a DSC scan, A is a pre-exponential constant, R is the gas constant and Ea is the activation energy. Data drawn from Grapes (2016) for the formation of Al3Ni, Al3Ni2 and AlNi at various heating rates are shown in Fig. 5. Also indicated on this plot are the temperatures of the three peaks in ~ D D labeled A, B and C in Fig. 4(a) for the = 25 nm sample heated at 40 K s1 . Peaks B and C appear at temperatures close to those expected for the formation of Al3Ni and Al3Ni2, respectively. The decrease in apparent ~ D D above these temperatures may or may not be real. The intermetallic phases act as diffusion barriers and reduce ~ D D, although we note that these phases also have grain boundaries which would reduce their effectiveness as diffusion barriers. Alternatively, the formation of the intermetallic phases may affect the reflectivity pattern in ways that only make it appear that ~ D D is decreasing. Peak A, on the other hand, occurs at a lower temperature than would be expected for formation of any intermetallic phase at this heating rate. In our view, this behavior most likely results from the composition dependence of ~ D D. In particular, if grain boundary diffusion dominates at low temperatures then it may be that the Al grain boundaries quickly become saturated with Ni, which would slow down subsequent diffusion. 4. Conclusions We have demonstrated an X-ray reflectivity technique for measuring solid-state interdiffusion in multilayer materials during rapid heating. Here we have demonstrated the tech- nique at rates of up to 200 K s1 but it could readily be extended to higher rates. We have, for example, collected reflectivity patterns with reasonably good signal-to-noise ratios in as little as 2 ms, implying the ability to collect data at heating rates as fast as 104 K s1 . More detailed studies, for example of interlayer roughness, may also be possible from a more complete consideration of the two-dimensional reflec- tivity profiles (Fig. 1). This would require careful corrections for the intensity profile of the incident beam and geometrical aberrations due to the curved sample (Stoev Sakurai, 2013), along with modeling of the specular and diffusion scattering from the specimens. Acknowledgements JK, MZ, LZ, TPW and TCH gratefully acknowledge support for this work from the US Department of Energy under grant No. DE-SC002509. JPL gratefully acknowledges financial support from the Chinese Scholarship Council (CSC). This work is based upon research conducted at the Cornell High Energy Synchrotron Source (CHESS) which is supported by the National Science Foundation and the National Institutes of Health/National Institute of General Medical Sciences under NSF award DMR-1332208. Detector development at Cornell is supported by the DOE Grant No. DE-SC0016035 and CHESS. References Brown, A. Ashby, M. F. (1980). Acta Metall. 28, 1085–1101. Cook, H. E. Hilliard, J. E. (1969). J. Appl. Phys. 40, 2191–2198. research papers 800 J. P. Liu et al. X-ray reflectivity measurement of interdiffusion J. Synchrotron Rad. (2017). 24, 796–801 Figure 5 Kissinger plots for the formation of the intermetallic phases Al3Ni, Al3Ni2 and AlNi, based on DSC data from Grapes (2016). Points A, B and C refer to the temperatures at which peaks in ~ D D occur for the = 25 nm sample (Fig. 4a). Joining them is a line indicating a heating rate of 40 K s1 ; the arrow indicates the direction of increasing temperature along this line. At this heating rate, peak B occurs at a temperature close to that which would be expected for formation of Al3Ni and peak C near the temperature expected for Al3Ni2.
  • 6. Du, Y., Chang, Y. A., Huang, B. Y., Gong, W. P., Jin, Z. P., Xu, H. H., Yuan, Z. H., Liu, Y., He, Y. H. Xie, F. Y. (2003). Mater. Sci. Eng. A, 363, 140–151. Edelstein, A., Everett, R., Richardson, G., Qadri, S., Altman, E., Foley, J. Perepezko, J. (1994). J. Appl. Phys. 76, 7850–7859. Erdélyi, G., Beke, D., Kedves, F. Godeny, I. (1978). Philos. Mag. B, 38, 445–462. Floro, J., Chason, E. Lee, S. (1996). MRS Symp. Proc. 406, 491–496. Fritz, G. M., Spey, S. J., Grapes, M. D. Weihs, T. P. (2013). J. Appl. Phys. 113, 014901. Gavens, A., Van Heerden, D., Mann, A., Reiss, M. Weihs, T. (2000). J. Appl. Phys. 87, 1255–1263. Grapes, M. D. (2016). PhD thesis, Johns Hopkins University, UK. Grapes, M. D., LaGrange, T., Woll, K., Reed, B. W., Campbell, G. H., LaVan, D. A. Weihs, T. P. (2014). APL Mater. 2, 116102. Greer, A. L. (1997). Curr. Opin. Solid State Mater. Sci. 2, 300–304. Greer, A. L. Spaepen, F. (1985). Synthetic Modulated Structures, edited by L. L. Chiang and B. C. Giessen, ch. 11, pp. 419–486. New York: Academic Press. Grieseler, R., Au, I. S., Kups, T. Schaaf, P. (2014). Phys. Status Solidi A, 211, 2635–2644. Khawam, A. Flanagan, D. R. (2006). J. Phys. Chem. B, 110, 17315– 17328. Knepper, R., Snyder, M. R., Fritz, G., Fisher, K., Knio, O. M. Weihs, T. P. (2009). J. Appl. Phys. 105, 083504. Matsushita, T., Niwa, Y., Inada, Y., Nomura, M., Ishii, M., Sakurai, K. Arakawa, E. (2008). Appl. Phys. Lett. 92, 024103. Naudon, A., Chihab, J., Goudeau, P. Mimault, J. (1989). J. Appl. Cryst. 22, 460–464. Neissendorfer, F., Pietsch, U., Brezesinski, G. Möhwald, H. (1999). Meas. Sci. Technol. 10, 354–361. Nicolet, M. A. (1997). Defect Diffusion Forum, 143, 1271–1284. Niggemeier, U., Lischka, K., Plotz, W. M. Holy, V. (1997). J. Appl. Cryst. 30, 905–908. Paulson, W. M. Hilliard, J. E. (1977). J. Appl. Phys. 48, 2117– 2123. Raghavendra Reddy, V., Gupta, A., Gome, A., Leitenberger, W. Pietsch, U. (2009). J. Phys. Condens. Matter, 21, 186002. Stoev, K. Sakurai, K. (2013). Powder Diffr. 28, 105–111. Tate, M. W., Chamberlain, D., Green, K. S., Philipp, H. T., Purohit, P., Strohman, C. Gruner, S. M. (2013). J. Phys. Conf. Ser. 425, 062004. Wang, W. H., Bai, H. Y., Zhang, M., Zhao, J. H., Zhang, X. Y. Wang, W. K. (1999). Phys. Rev. B, 59, 10811–10822. Watanabe, M., Horita, Z., Sano, T. Nemoto, M. (1994). Acta Metall. Mater. 42, 3389–3396. research papers J. Synchrotron Rad. (2017). 24, 796–801 J. P. Liu et al. X-ray reflectivity measurement of interdiffusion 801