1. Abstract
ASPM is a mitotic protein expressed at low
levels in normal tissues. We identified ASPM
as being both mutated and amplified in early
lesions and invasive breast cancer. 1
We used qPCR and immunofluorescence to
validate these results in cell lines, and then
analyzed the effect of ASPM inhibition on
growth of normal, premalignant and invasive
breast cancer cells using growth assays and
cell cycle analysis.
Our results suggest that ASPM may be a
biomarker for breast cancer forming potential,
as well as a putative prophylactic target.
Background
ASPM, abnormal spindle-like microcephaly-
associated protein, is a mitotic spindle
regulatory protein assisting in microtubule
polymerization and centriole stabilization.2
It is
largely expressed in embryonic tissues, and
not in adult tissues.3,6
ASPM inactivation is
associated with human neuropathies. ASPM
upregulation has been observed in gliomas
and in basal-like breast cancer. 6,7
Rationale
We performed a screen to detect genes that
were preferentially mutated in a subset of
invasive breast cancer associated with poor
patient survival1
. We then performed a
second screen to identify early drivers of
aggressive breast cancer from the top thirty-
two preferentially mutates genes. From this
screen ASPM was the top candidate.
Hypothesis
ASPM is upregulated in premalignant breast
cells and is required for their growth.
Conclusions
1.ASPM levels are low in normal breast
cells but increase as stages of breast
cancer progress.
2.ASPM knockdown does not affect the
growth or division of normal breast cells
(hTERT).
3.Knockdown of ASPM inhibits growth and
affects cell division for both pre-malignant
breast cancer cells (DCIS.com) and
invasive breast cancer cells (MCF7),
indicating ASPM is important for
proliferation in these cell types.
Implications
If ASPM is not required by normal breast
cells compared to pre-malignant and
invasive breast cells, then
1.ASPM may be a good biomarker for high
risk lesions
2.ASPM may be a target for breast cancer
prevention
Materials/Methods
1.Transfections were performed using
Dharmafect and Opti-Mem along with the
appropriate siRNA treatment.
2.RNA for qPCR was extracted using the
Qiagen QiaShredder and RNeasy Mini Kits.
cDNA was made using PT 200 Peltier Thermal
Cycler. qRT-PCR was performed using 7900
HT Fast Real-Time PCR System and analyzed
with Sequence Detection Systems (SDS)
software.
3.Cell cycle analysis was performed using the
Accuri C6 Flow Cytometer. Data was
analyzed using FlowJo software.
4.Immunofluorescence used ASPM antibody
(1:500) and goat-anti-rabbit antibody (488) as
the primary and secondary antibodies,
respectively. Slides were mounted using
Vectashield Mounting Medium for
Flouroescence with Dapi. Pictures were taken
using a Nikon Eclipse Ti Microscope.
References
1) Haricharan et al. BCRT. 2014.
2) Xu et al. PlosOne. 2012.
3) Fish et al. PNAS. 2006.
4) Oncomine Database
5) BioGPS Database
6) Higgins et al. BMC Cell Biology. 2010.
7) Zhong et al. Cell Cycle. 2005
ASPM Knockout Studies
The Role of ASPM in Normal, Pre-Malignant and Invasive
Breast Cancer Cells
Kristen Maslar, Svasti Haricharan, Powel Brown
Cancer Prevention & Research Institute of Texas Summer Research Program
Department of Clinical Cancer Prevention
Specific Aims
1. Test whether ASPM is overexpressed in
premalignant cells relative to normal breast
cells using qRT-PCR and immunofluorescence.
2. Test whether ASPM is required for the
growth of pre-invasive, but not for the growth of
normal breast cells using a growth assay.
3. Test whether ASPM is required for mitosis in
pre-invasive but not normal breast cells using
cell cycle analysis.
ASPM Functional Profile
ASPM gene expression
Results
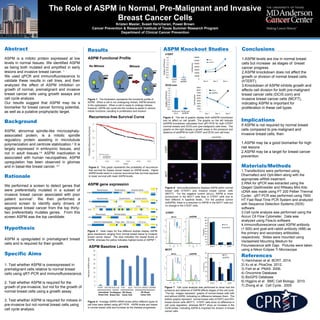
Figure 4: Average ASPM mRNA levels within different types of
cell lines were tested using qRT-PCR. ASPM levels are lowest
in normal breast cells and increase as the disease progresses.
ASPM Baseline Levels
Figure 3: Heat maps for five different studies display ASPM
gene expression ranging from normal breast tissue to invasive
breast cancer tissue. The blue indicates the lowest levels of
ASPM, whereas the yellow indicates highest levels of ASPM4, 5
.
Recurrence-free Survival Curve
Figure 2: This graph represents the probability of recurrence-
free survival for breast cancer based on ASPM levels. Higher
ASPM levels result in a worse recurrence-free survival opposed
to lower survival with lower ASPM levels.
Figure 1: The illustration represents the functional profile of
ASPM. When a cell is not undergoing mitosis, ASPM remains
in the cyptoplasm. When a cell is ready to undergo mitosis,
however, ASPM can cycle into the nucleus to assist in various
mitotic functions, resulting in proliferation and division.
Figure 5: The set of graphs display both siASPM knockdown
and its affect on cell growth. The graphs on the left indicate
siASPM knockdown calculated from qRT-PCR for both hTERT
(normal breast) and DCIS.com (pre-malignant) cells lines. The
graphs on the right display a growth assay in the presence and
absence of siASPM for both hTERT and DCIS.com cell lines.
siLuc siASPM
hTERT
DCIS.com
hTERT
MCF7
Figure 7: Cell cycle analysis was performed to show how the
presence and absence of ASPM affects stages of the cell cycle.
The top images represent graphs of normal breast cells with
and without ASPM, indicating no difference between them. The
bottom graphs represent normal breast cells (hTERT) and ER+
breast cancer cells (MCF7). hTERT cells show no difference in
cell cycle regulation, whereas MCF7 show an increase in the
G2/M phase, indicating ASPM is important for division in breast
cancer cells.
Figure 6: Immunofluorescence displays ASPM within normal
breast cells (hTERT) and invasive breast cancer cells
(MCF7). For the negative control (siLuc), ASPM is more
pronounced in the MCF7 cells than in hTERT cells due to
their different in baseline levels. For the positive control
(siASPM), there is a reduction in ASPM in the MCF7 cells but
no change in the hTERT cells.
siLuc siASPM
No Mitosis Mitosis
2. Title of the Poster Presentation Goes Here
Authors of the Poster Presentation Goes Here
Institutional and/or Graduate School of Biomedical
Sciences Affiliation Goes Here
Title of the Poster Presentation Goes Here
Authors of the Poster Presentation Goes Here
Institutional and/or Graduate School of Biomedical
Sciences Affiliation Goes Here