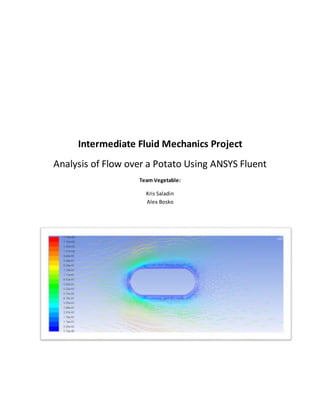
1. Intermediate Fluid Mechanics Project
Analysis of Flow over a Potato Using ANSYS Fluent
Team Vegetable:
Kris Saladin
Alex Bosko
2. Introduction
Thisexperimentdetailsthe analysisof fluidflow overapeeledpotatousingANSYSFluent14.5.
The versatilityof the Fluentprogramallowsforquickflow estimationsof objectsormore complex and
detailed analysisif needed. Flowestimationsare first calculated withrelevantequations fromclass and
bookvalues usingstatedinitialconditions.Thisestimationisthencomparedwiththe analysisgenerated
by Fluent. The accuracyand error of Fluentcalculationsare shownwithrefinementstudiesof meshsize,
convergence tolerance,boundarydistance,andReynoldsnumber; thenproved tobe importantor
negligible.VariablessuchasReynoldsnumber,coefficientof drag, and boundarylayerthickness are
calculatedand usedinbothwrittenequationsandFluent.Valuesfordragforce on the potato were
foundto be 0.01875 Newtons usingwrittenequationsand0.4023 Newtons usingthe Fluentcalculation;
showingasmall variationwithbothapproaches.Thisconcludedthateachapproach couldbe valid
dependingondesiredaccuracy.
Problem Specifications
OperatingConditionsand Estimated FlowProperties
An initial estimation forgeneral flow description overthe potatobegan withcalculatingthe
Reynoldsnumber. Forsimplicity,we assume the shape tobe aflat plate.Also,since ourobjectis
streamlined,we donothave to worryabout the calculationsforflow separation.Reynoldsnumber
equationisdefined:
𝑅𝑒 =
𝜌𝑉𝐿
𝜇
Equation (1)
Where:(𝜌) isdefinedasthe fluiddensity,(V)isthe fluidvelocity,(L) isthe lengthof the object,
and (𝜇) isthe fluidviscosity. Forourtheoretical experiment,boundaryconditionswere chosentobe:
𝜌 = 1.0
𝑘𝑔
𝑚3
V = 1
𝑚
𝑠
L = 0.25 m 𝜇 = 0.04
𝑘𝑔
𝑚∗𝑠
ComputingEquation(1) withthese valuesproduced aReynoldsnumberof 6.25. For a flatplate,thislow
Reynoldsnumbercorrelateswiththe Laminarflow region:Re < 1e5. Thisis nota Stokesorcreepingflow
because itisnot Re << 1.
Afterdeterminingthe flow type tobe laminar, total dragforce onour potato couldthenbe
estimatedusingthe equation:
𝐹𝐷 =
1
2
𝜌𝑉2 𝐶 𝐷 𝐴 .
Equation (2)
3. Coefficientof drag(𝐶 𝐷) and frontal area(A) were the only new variablesneeded. The frontal
area forour potato isdescribedasthe lengthtimesthe diameter,or:
𝐴 = 𝐿𝑑 = 0.0125 𝑚2 .
Equation (3)
Coefficientof dragcouldbe found byapproximatingthe potato’sshape asanellipsoid. FromTable 11-2
‘FluidMechanics’textbook, anellipsoid’scoefficientof drag inlaminarflow:
𝐶 𝐷 = 0.3 𝑓𝑜𝑟
𝐿
𝑑
= 2.5 𝑎𝑛𝑑 𝑅𝑒 < 2 ∗ 105.
Where (𝐿/𝑑) isdefinedasthe ellipsoid’s lengthtodiameterratio.Combiningthese valueswithEquation
(2) gave us a total drag force estimationof 0.001875 Newtons.
While ReynoldsnumberandNavier-Stokesrelationships describe the approximatebehaviorof
our fluidflowproperties;examiningmore closelynearthe boundariesof ourfluidrequiresthe
estimationof aboundarylayerthickness.Thisthicknessisdescribedas the approximatedistance
perpendiculartothe potato’ssurface where flow velocityhasreachedfree streamvelocity. The
equationforboundarylayerthickness (derivedfromthe Blasiussolution)forlaminarflow overaflat
plate isgivenas:
𝛿
𝐿
=
4.91
√ 𝑅𝑒 𝐿
.
Equation (4)
Where (𝛿) isthe boundarylayerthicknessand(𝑅𝑒 𝐿) isthe Reynolds numberwithrespecttolength.
Usingthe statedvariablesfor(L) and(Re) above,boundarylayerthicknesswasestimatedtobe 0.491 m
at the endof the potato. This boundaryconditionislaterusedwhencreatinganinflationlayerinFluent.
OtherboundaryconditionsneededbyFluentforsimulationinclude:avelocityinlet,apressure
outlet,andwalls (showninFigure 1).Forour initial testing,the velocityinletwasspecifiedasthe
leftmostarc(blue half circle) andourpressure outletasthe rightmostarc (redhalf circle).These two
arcs were made to be 5 timesthe characteristicsize of the potato(laterexplainedin analysisand
discussion).Finally,wallswere simplydefinedasthe outline of the potato.
4. Figure (1): Fluent Boundary Conditions Explained
Results with Analysis and Discussion
Generatinga Mesh
The Fluentprogramusesmesheswithinacreated geometrytocalculate flow properties.The
computercan analyze datain eachmeshsquare and then generate anoverall analysis.More mesh
divisions will increase the accuracyof the analysisbutalso requiresmore time toprocess.A more
complex systemwill take longerforcalculationstorun. Refiningthe mesh aroundourpotato couldbe
done byincreasingthe numberof divisionsselectedaroundthe walls,inlet,andoutlet.Forthe initial
case,the numberof divisions wassetequal to50 (Figure 2) and the methodof patternusedwas
triangles.The resultof thissettingproducedagoodbase flow analysiswithenoughmeshsizesnearthe
potatobody.In creatingan accurate meshrepresentation aninflationlayerhadtobe usedaswell.This
layertellsthe computerhowtoaccuratelycapture the boundarylayerregionnearthe walls byinputting
the layerthicknessfoundpreviouslytobe 0.491 metersfromEquation(4).
Figure (2): Mesh at 50 Divisions
Pressure OutletVelocityInlet
Walls
5. Alsoa factor consideredingeneratingthismeshbodywasthe distance of farfieldboundaries.
Thisis lookedatfurtherin the sectionon “Far-fieldBoundaryEffects”.Topreventthese conditionsfrom
impactingoursolution,boundarydistances(forthe inletandoutletarc) were setto5 timesthe
characteristicsize of the potato.
MeshRefinementStudy
One way todetermine accuracyanderror in 𝐶 𝐷 calculations byFluentiswithameshrefinement
study. Asstatedpreviously,meshrefinementinvolvesincreasingthe numberof meshdivisionstocreate
a more accurate flowrepresentation.The baseline numberof divisionsforall surfaceswassetto50
(shownabove inFigure 2).That numberwasdoubledeachtime fora total of four cases. At 50 divisions
the estimatedcoefficientof drag byFluentwas0.65632 (double thatof ourinitial estimate).
Figure(3): Mesh at 100 Divisions Figure (4):Mesh at 200 Divisions
The above Figures3 & 4 show meshdivisions becomingsmallerandmore frequent,especially
aroundthe body.Thisinturn, more adequatelycapturesregionswhere flow mightexperience rapid
change and as a result,betteranalysisconclusions.Coefficientof draginthese twoscenarioswas
calculatedtobe 0.65676 and 0.65711, respectively.
Figure (5): Mesh at 400 Divisions
6. In the final case of 400 divisions,the coefficientof dragoutput byFluentwas0.65764. At this
setting,the mostuniformpatternisseenaroundthe bodygivingan accurate representation of a
realisticscenario.Thisisfurtherexplained inFigures6& 7 below;the comparisonof analysesfor
velocityvectorfields at50 and 400 meshdivisions.
Figure (6): VelocityField at 50 Divisions Figure (7):Velocity Field at 400 Divisions
As predicted,the velocityflowpatternsare slightlybetterdefinedwith400 meshdivisions.This
allowsfora more accurate solutionto(inthiscase) the coefficientof dragoutput. Alsoseenispartof
the boundarylayerthickness, 𝛿.Streamvelocityisshownasorange/redarrows whichveerawayfrom
the potato afterpassingover.Thisseemstobe accurate,visually,since ourthicknesswasnearlytwice
that of the potato’slength. Comparingall fourcasesinTable (1) below,the valuesforcoefficientof drag
showan increasingtrendathighermeshresolutions.Thistrendisnotlinearhowever,andseemsto
converge ona value between0.657 and0.658. The convergence wasfoundbythe change in 𝐶 𝐷 value
decreasingasthe numberof divisionsincreased(showninthe 3rd
columnof Table 1).
Figure (8):Semi-Log Plot of Cd vs. Numberof Divisions Table (1)
0 0.002 0.004 0.006 0.008 0.01 0.012 0.014
0.6562
0.6564
0.6566
0.6568
0.657
0.6572
0.6574
Relative mesh size based on number of divisions on potato surface
Dragcoefficient
Actual Data
Powerfit
Mesh Divisions 𝑪 𝑫 ∆𝑪 𝑫
50 0.65632 -
100 0.65676 0.00044
200 0.65711 0.00035
400 0.65724 0.00013
7. Withthisdata, a semi-logplotof 𝐶 𝐷 versusnumberof divisions (Figure 8) wasalsocreatedto
estimate the percenterrorin the mostrefinedsolution. 𝐶 𝐷 calculatedforthe finestmeshcompared
withitsexactvalue resultedinapercenterrorof 0.0547%. Thiserror islow and acceptable forthis
experiment. If anevenfinermeshwasused,say,1000 divisions,thenthe errorwouldbe evenlowerif
not zero.
Effectof Convergence Tolerance on 𝑪 𝑫
Additionally,errorcanalso be shownbythe impact of convergence tolerancesonthe coefficient
of drag.A refinementstudycanbe done in thiscase as well; takingthe valuesof 𝐶 𝐷 outputbyFluentat
smallertolerances. Datawastakenat a single Reynoldsnumberandmeshresolution toisolate errorand
are shownbelowinTable 2.
Figure (9):ConvergenceToleranceEffecton Cd Table (2)
We findthatas the tolerance became smaller, 𝐶 𝐷 alsobecame smaller. Again,muchlike the mesh
refinementstudy,thistrendisnotlinearshowing 𝐶 𝐷 meetingata single value.Forthis,itcanbe
assumed thatany tolerance value higherthan1E-12 will converge toanapproximate 𝐶 𝐷 of 0.657. Figure
(9) supportsthisargumentwithanear horizontal line atthisvalue.
Effectof Far-FieldBoundary Conditionson 𝑪 𝑫
The effectof far-fieldboundaryconditionsisanothercase where accuracy/errorin 𝐶 𝐷
calculationscanbe found.Boundaryconditionsare the velocityinletandpressure outletshownin
Figure (1).If these boundariesare tooclose tothe potato body, data will be corruptedandthe accuracy
of estimationswillbe lost.The bestwaytoavoidthisis to create a large boundarydistance tonegate
any possible effects.Here we willprove thiseffectby documenting 𝐶 𝐷 valuesatboundarydistancesof 5,
10
-12
10
-10
10
-8
10
-6
10
-4
10
-2
0.655
0.66
0.665
0.67
0.675
0.68
CD vs. Convergence Tolerances
Convergence Tolerance
DragCoefficient
Convergence Tolerance 𝑪 𝑫 ∆𝑪 𝑫
1.00E-03 0.6752 -
1.00E-04 0.6590 -0.0162
1.00E-05 0.6578 -0.0012
1.00E-12 0.6575 -0.0003
8. 20, and 80 timesthe characteristicsize of the potato.Figure (9) below showsthe three distances,
increasingfromlefttoright.
Figure (10): Boundary Distances of 5, 20, and 80 Times Characteristic Size
To isolate the errorof these three cases,meshsize andconvergence tolerance wereheld
constantat 400 divisionsand1E-12, respectively. 𝐶 𝐷 valuesoutputby Fluentforthe three casesshowed,
like othercases, adecreasingnon-lineartrend. Forthisexperiment,anyeffects seenatgreaterthan80
timesthe characteristicsize canbe considerednegligible due totheirsmall nature.Table (3) below
showsthe change in 𝐶 𝐷 withboundarydistance.
Boundary Distance 𝑪 𝑫 ∆𝑪 𝑫
5X 0.6593 -
20X 0.5746 -0.0847
80X 0.5554 -0.0192
Table (3)
From a boundarydistance of 5X to 20X, the 𝐶 𝐷 value changesalmostby0.1. Thisseemsquite
significantbutalsotapersoff dramatically from20Xto 80X, leavingthe conclusionstatedabove thatany
error seenfroma boundarydistance greaterthan80x isnegligible.
Effectof ReynoldsNumber on 𝑪 𝑫
The final variance on 𝐶 𝐷 can be foundthroughdifferencesinthe Reynoldsnumberforfluid
flow. If the propertiesforviscosity,density,andlengthof ourobjectare heldconstant;the onlywayto
vary Reynoldsnumberisthoughthe magnitude of flow velocity.Muchlike varying the system’smesh
size,convergence tolerance,andboundarydistance;varyingthe flow velocitywill alsovarythe
coefficientof drag. However,thiscancause the objectto have flow separation/turbulence if the
Reynoldsnumberbecomestoogreat.For the purposesof thisexperiment,flow needstoremainsteady
therefore the initial flowvelocityselectedwaslow. Figure (9) andTable (4) show the data forchanging
𝐶 𝐷 versusReynoldsnumber.Errorcalculatedinthe mostrefinedsolutionwasplottedaserrorbarsalong
withthe data trend.
9. Figure (11): 𝐶 𝐷 versusReynoldsNumber Table (4)
Althoughthe errorbars shownare small incomparison tothe data; scalingfor 𝐶 𝐷 islarge (from0.2 to
1.8) which is a much greaterrange than our data waspreviously. Ata laminarflow,dragcoefficientsfor
streamlined objectsdonotvary widelywithincreasingvelocity/Reynoldsnumber.Forthe case of our
potatoa small increase in Reynoldsnumbershowedalarge change in 𝐶 𝐷 unlike the original estimateof
0.3 for the entire range of Re < 2E5. The solutionstill convergedata flow velocityof 2m/sbut it could
be interpretedfromthe datathat if flowvelocitywasincreasedfurtherthissolutionwouldnotremain
steady.
Conclusions
Our original estimatefordragcoefficient,assumingthe shape of the potatoto be an ellipsoid,
provedacceptable forroughcalculationsbut wasnotnearlyas accurate as the Fluent flow analysis.This
was obviouslyaroughestimate provingthe benefitof acomputerizedcalculation. Since the potato
shape wasfoundnot to be as streamlinedasanellipsoid; dragcoefficientwasgreaterandvaried
drasticallywithsmall changesinthe Reynoldsnumber. While ourinitial valuefordragforce was
0.001875 Newtons, the total value producedbyFluentwas 0.4023 Newtons.Nota large change inthe
grand scheme of things,butthisdependsonthe scope of what’sneededinanexperiment.
The purpose of this analysiswasto shedlightonwhere valuesof errorcome fromin Fluentand
compare themto the solution approachesderivedinclass.Thisallowsustoapproachproblemsat
differentlevelsdependingonthe accuracy of calculationsneeded.Forexample,if a companyneededa
quickestimate fordragof an ellipse-shapedobject,aquickReynoldsnumbercalculationfollowedbya
bookcheck of 𝐶 𝐷 values couldtell youalmostinstantaneouslythe answer.However,if amore detailed
analysisisneeded - dependingonthe level of error;more time putintoFluentwouldyielda more
precise result.
3 4 5 6 7 8 9 10 11 12 13
0.2
0.4
0.6
0.8
1
1.2
1.4
1.6
1.8
CD vs RE: With Error Bars
RE
CD
Flow Velocity [m/s] 𝑹 𝒆 𝑪 𝑫 ∆𝑪 𝑫
0.5 3.125 0.26795
0.875 5.47 0.55016 0.28221
1.25 7.81 0.88686 0.3367
1.625 10.17 1.27022 0.38336
2 12.5 1.69525 0.42503
10. Works Cited
Çengel, Yunus A., and John M. Cimbala. Fluid Mechanics: Fundamentals and
Applications. 2nd ed. Boston: McGraw-Hill Higher Education, 2006. Print.
Nomenclature
Variable Definition Units
𝐴 Area m2
𝐶 𝐷 Drag Coefficient -
𝑑 Diameter m
𝛿 Boundary Layer Thickness m
𝐹𝐷 Drag Force N
𝐿 Length m
𝜇 Viscosity
𝑘𝑔
𝑚 ∗ 𝑠
𝜌 Density 𝑘𝑔/𝑚3
𝑅 𝑒 Reynolds number -
𝑉 Velocity
𝑚
𝑠